3 Month 10 Year Spread

A very important economic and financial indicator is the 3 month 10 year spread or 3-month 10-year curve, which is simply the difference between the 10-year US Treasury yield and the 3-month US Treasury yield. It is also referred to as 10y3m, 3m/10y, 10y-3m yield spread and so on, but “3 month 10 year” spread or “10 year 3 month” spread are the most common names. There are other yield curve spreads as well, including the most popular 2s10s spread.

Below is a chart of the US Treasury 3m-10y spread through time.

How is the 3 month 10 year spread calculated?

We can see how the US Treasury 3m10y spread is calculated below, by simply subtracting the 3-month yield (red line) from the 10-year yield (blue line).

What is the significance of the 3-month 10-year spread?

Historically, steep yield curves (indicated by a high 3m10y reading) are often followed by strong economic and financial market performance, while flat yield curves (indicated by low 3m10y readings) are followed by weaker performance.

Sometimes the yield curve flattens so much that it “inverts” and shorter-term rates are higher than longer-term rates (and the 3m10y reading goes negative). An “inverted yield curve” is typically seen as a warning sign as inverted yield curves are often followed by recessions. The gray bars in the above charts indicate recessions.

The 3m/10y spread has perhaps the best record of predicting recessions out of all of the yield curve spreads. Read our comparison of different spreads records in predicting recessions.

This measure even inverted prior to the 2020 recession and did not invert (and generate a false recession signal) in the 1980s or 1990s as some other yield curve spreads did. For these reasons, the 3m/10y curve is viewed as the most reliable yield curve spread indicator and is closely watched by the Federal Reserve. Learn more about why this spread precedes recessions.

However, in recent blog posts and press conferences, the Federal Reserve has begun focusing on the near-term forward yield spread (instead of the 3m10y curve) as a predictor of recessions and indicator of economic conditions.

How to track the 3-month 10-year curve?

You can find the 3m10y on many websites. My favorite website to track this spread through time is FRED (Federal Reserve Economic Data), which is published by the Federal Reserve Bank of St. Louis. The first chart (above) can also be found here.

Other yield curve spreads

There are many other yield curve spreads that market participants and policymakers monitor, such as the 2s10s and many others.

5s30s

One economic indicator is the US Treasury 5s30s curve or 5s30s spread, which is simply the difference between the 30-year US Treasury yield and the 5-year US Treasury yield. It is also referred to as 30s5s, 5s/30s, 30-5 yield spread and so on, but 5s30s is the most common name. There are other yield curve spreads as well, including the most popular 2s10s spread.

Below is a chart of the US Treasury 5s30s through time.

How is the 5s30s calculated?

We can see how the US Treasury 5s30s spread is calculated below, by simply subtracting the 5-year yield (blue line) from the 30-year yield (red line).

What is the significance of the 5s30s?

Historically, steep yield curves (indicated by a high 5s30s reading) are often followed by strong economic and financial market performance, while flat yield curves (indicated by low 5s30s readings) are followed by weaker performance.

Sometimes the yield curve flattens so much that it “inverts” and shorter-term rates are higher than longer-term rates (and the 5s30s reading goes negative). An “inverted yield curve” is typically seen as a warning sign as inverted yield curves are often followed by recessions. The gray bars in the above charts indicate recessions.

The 5s30s does not have a great record relative to some other yield curve measures. This measure did not invert prior to the 2020 recession (although maybe we can forgive it for not predicting a pandemic!) and it also inverted multiple times in the 1980s without an immediate recession. For a brief summary of which yield curve measures have the best track record of “predicting” recessions, read this post of whether the yield curve predicts recessions.

How to track the 5s30s

You can find the 5s30s on many websites. My favorite website to track the 5s30s is FRED (Federal Reserve Economic Data), which is published by the Federal Reserve Bank of St. Louis. The first chart (above) can also be found here.

Other yield curve spreads

There are many other yield curve spreads that market participants and policymakers monitor, such as the 2s10s, the 3-month 10-year spread, and many others. For an up-to-date look at other yield curve spreads, see our yield curve spread chart page.

5s10s

One economic indicator is the US Treasury 5s10s curve or 5s10s spread, which is simply the difference between the 10-year US Treasury yield and the 5-year US Treasury yield. It is also referred to as 10s52s, 5s/10s, 10-5 yield spread and so on, but 5s10s is the most common name. There are other yield curve spreads as well, including the most popular 2s10s spread.

Below is a chart of the 5s10s through time.

How is the 5s10s calculated?

We can see how the US Treasury 5s10s spread is calculated below, by simply subtracting the 5-year yield (red line) from the 10-year yield (blue line).

What is the significance of the 5s10s?

Historically, steep yield curves (indicated by a high 5s10s reading) are often followed by strong economic and financial market performance, while flat yield curves (indicated by low 5s10s readings) are followed by weaker performance.

Sometimes the yield curve flattens so much that it “inverts” and shorter-term rates are higher than longer-term rates (and the 5s10s reading goes negative). An “inverted yield curve” is typically seen as a warning sign as inverted yield curves are often followed by recessions. The gray bars in the above charts indicate recessions.

The 5s10s seems to be one of the worst yield curve measures, in terms of predicting recessions. This measure did not invert prior to the 2020 recession (although maybe we can forgive it for not predicting a pandemic!) and it also inverted several times in the 1980s and 1990s without any immediate recession. For a brief summary of which yield curve measures have the best track record of “predicting” recessions, read this post of whether the yield curve predicts recessions.

How to track the 5s10s

You can find the US Treasury 5s10s on many websites. My favorite website to track the 5s10s is FRED (Federal Reserve Economic Data), which is published by the Federal Reserve Bank of St. Louis. The first chart (above) can also be found here.

Other yield curve spreads

There are many other yield curve spreads that market participants and policymakers monitor, such as the 2s10s, the 3-month 10-year spread, and many others. For an up-to-date look at other yield curve spreads, see our yield curve spread chart page.

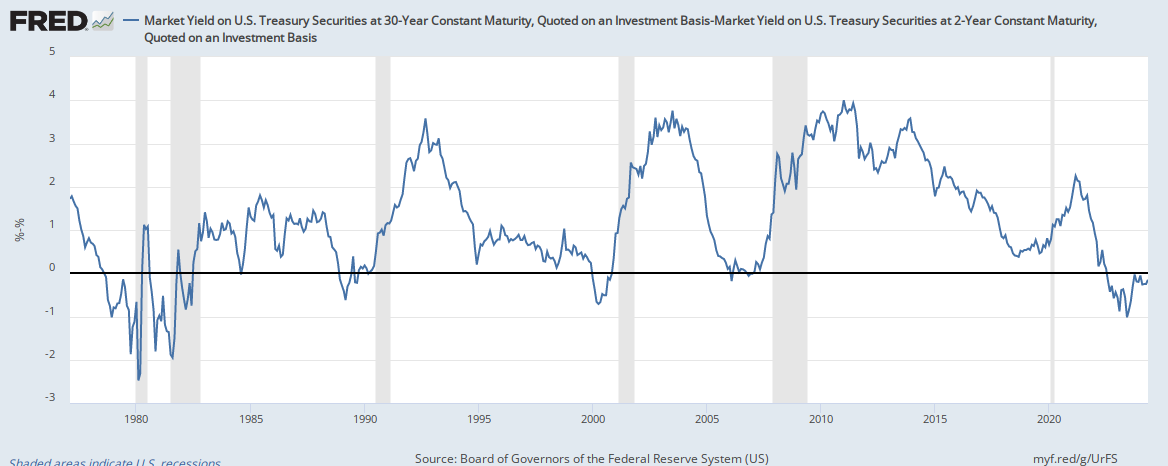
2s30s

One economic indicator is the 2s30s curve or 2s30s spread, which is simply the difference between the 30-year US Treasury yield and the 2-year US Treasury yield. It is also referred to as 30s2s, 2s/30s, 30-2 yield spread and so on, but 2s30s is the most common name. There are other yield curve spreads as well, including the most popular 2s10s spread.

Below is a chart of the 2s30s through time.

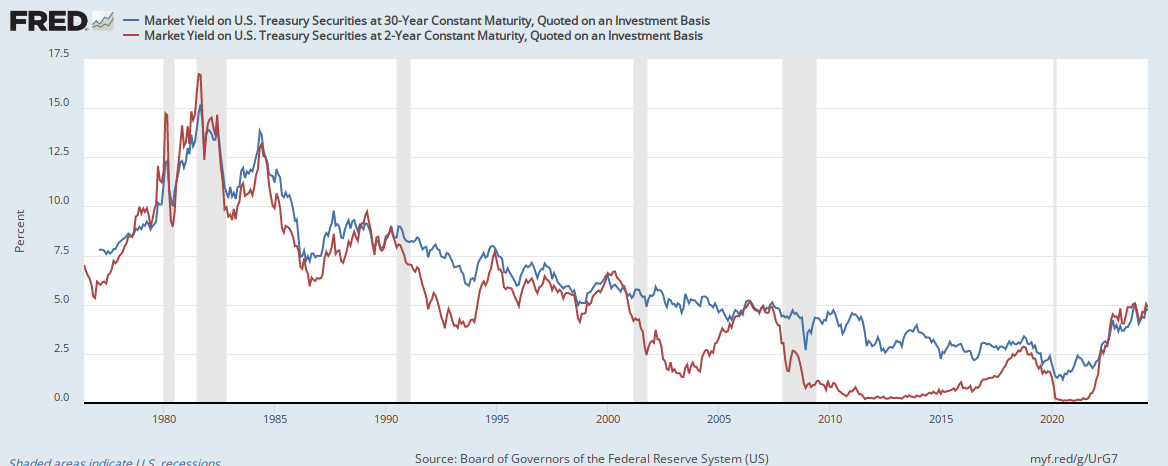
How is the 2s30s calculated?

We can see how the 2s30s spread is calculated below, by simply subtracting the 2-year yield (red line) from the 30-year yield (blue line).

What is the significance of the 2s30s?

Historically, steep yield curves (indicated by a high 2s30s reading) are often followed by strong economic and financial market performance, while flat yield curves (indicated by low 2s30s readings) are followed by weaker performance.

Sometimes the yield curve flattens so much that it “inverts” and shorter-term rates are higher than longer-term rates (and the 2s30s reading goes negative). An “inverted yield curve” is typically seen as a warning sign as inverted yield curves are often followed by recessions. The gray bars in the above charts indicate recessions.

The 2s30s does not have a great record relative to some other yield curve measures. This measure did not invert prior to the 2020 recession (although maybe we can forgive it for not predicting a pandemic!) and it also inverted briefly in the early 1980s many years before another inversion and recession. For a brief summary of which yield curve measures have the best track record of “predicting” recessions, read this post of whether the yield curve predicts recessions.

How to track the 2s30s

You can find the 2s30s on many websites. My favorite website to track the 2s30s is FRED (Federal Reserve Economic Data), which is published by the Federal Reserve Bank of St. Louis. The first chart (above) can also be found here.

Other yield curve spreads

There are many other yield curve spreads that market participants and policymakers monitor, such as the 2s10s, the 3-month 10-year spread, and many others. For an up-to-date look at other yield curve spreads, see our yield curve spread chart page.

Accredited Investor vs Qualified Client vs Qualified Purchaser

Private market investing typically requires investors to qualify as an Accredited Investor, a Qualified Client, or a Qualified Purchaser. These terms and related criteria are designed to protect investors, although some argue that they also limit investor opportunity.

Publicly-traded assets and investment vehicles register with the Securities and Exchange Commission (SEC), while private investment vehicles are exempt from registration if they follow certain rules. The idea being that the SEC will allow funds to not register if they limit their offerings to those who have the financial ability to tolerate risk and/or the sophistication to understand the risks. Different exemptions are available, but each exemption has rules about what types of investors a fund can accept. Some funds can only accept accredited investors, some can accept qualified clients, and some can accept qualified purchasers.

Accredited Investor

One of the prerequisites to private market investing is to be an “accredited investor,” as many private investment vehicles require investors to be accredited (even if there are additional requirements to be a qualified client or qualified purchaser). Both people and entities can be accredited investors.

Benefits of being an accredited investor

The primary benefit to being an accredited investor is that the investment universe is the opportunity to invest in private investments. Non-accredited investors are generally limited to publicly-traded assets and funds that have been registered with the SEC. Below are some examples of why it is beneficial to be accredited:

  • Nearly all private investment vehicles are “Reg D” offerings, which require investors to be accredited.
  • Many real estate funds rely on the 3(c)(5)(C) exemption, which requires investors to be accredited.
  • The accredited investor standard is viewed as a default investor qualification in many contexts and may be used to restrict access to additional products and services.

How do people qualify as accredited investors?

Individuals can qualify as an accredited investor with their income OR with their net worth.

Based on income

To qualify as an accredited investors based on income, an investor must have:

  • earned at least $200,000 in each of the prior two years and have a reasonable expectation of the same for the current year, OR
  • earned at least $300,000 jointly with their spouse (or a “spousal equivalent”) in each of the prior two years and have a reasonable expectation of the same for the current year.

Based on net worth

To qualify as an accredited investor based on net worth, an investor must have a net worth of at least $1 million. The equity and debt in a primary residence must be excluded from the net worth calculation (unless the debt exceeds value of the home, in which case ).

Other ways

There are some less common ways for individuals to qualify as an accredited investor as well:

  • Hold, in good standing, any of the following securities licensing designations: Series 7, Series 65, or Series 82.
  • Be a “knowledgeable employee” of the fund (or affiliate) in which the investor is investing.
  • Be a client of a family office.

How do entities qualify as an accredited investor?

Investors who want to invest through an entity (such as a trust or business) are subject to a different set of criteria:

  • The entity must own at least $5 million of investments, OR
  • All owners of the entity must be accredited investors.
  • Certain types of financial firms are also accredited investors.

It is important to note that there is no way for entities to qualify based on revenue or income. It is also important to note that the accredited investor rules may apply to different types of entities differently, although those differences are outside the scope of this particular post.

The accredited investor definition can be found here and a summary from the SEC can be found here.

Qualified Client

Qualified clients are a step up from accredited investors in terms of net worth.

Benefits of being a Qualified Client

The main benefit to being a qualified client is that the investment universe is even larger than for accredited investors. Many private equity, private debt, venture capital, and hedge funds cannot rely on the same registration exemptions that real estate funds do, so they often rely on the 3(c)1 exemption. However, these 3(c)1 funds can only accept qualified clients, so investors who wish to allocate beyond real estate generally need to be qualified clients. Yet, even many real estate funds rely on the 3(c)1 exemption, so being a qualified client really opens up the opportunity set.

3(c)1 funds are allowed to charge a performance allocation (also known as a performance fee or incentive fee). Since many private equity funds and hedge funds charge performance fees (above a hurdle rate), many are organized as 3(c)1 funds (or 3(c)7 funds if they are larger, generally).

Definition of Qualified Client

A Qualified Client is:

  • A person or entity that owns at least $2.2 million of investments (the definition of investments excludes residences). Assets owned jointly with a spouse can be counted.
  • A person or entity who invest at least $1.1 million with the adviser. In other words, if someone has a net worth of $1.5 million, they are not a qualified client. But if they invest $1 million in a single fund, then they are a qualified client.
  • A Qualified Purchaser.
  • Certain “knowledgeable employees” of the fund and/or it’s affiliates.

Funds that require investors to be qualified clients usually require the investor to be accredited too. The definition of a qualified client can be found here and (similar to the treatment of accredited investors) the application of qualified client criteria to certain types of entities often varies from fund to fund.

Qualified Purchaser

Qualified purchaser is the highest qualification of these three common investor qualifications.

Benefits of being a Qualified Purchaser

There are several benefits to being a Qualified Purchaser, most of which relate to being allowed to invest in 3(c)7 funds.

  • While many funds rely on the 3(c)1 exemption, the downside is that they are only allowed to have 99 investors. So many funds decide to rely on the 3(c)7 exemption instead, which allows the fund to have 499 investors. However, only qualified purchasers are allowed to invest in 3(c)7 funds. Thus, the investment universe for qualified purchasers is larger than for qualified clients or accredited investors
  • Some sponsors launch parallel funds, meaning that they manage one 3(c)1 fund and one 3(c)7 fund that both invest in the same strategy. If the 3(c)1 has used up its 99 investor slots, qualified purchasers can still invest in the 3(c)7 fund (which has 499 investors slots).
  • Many funds have a cap of 25% on ERISA-protected accounts, meaning that less than 25% of the fund can be from accounts such as 401k’s, SEP IRAs, etc. If there are parallel funds and one fund has reached its ERISA cap, a qualified investor may be able to invest in the second parallel fund.

3(c)7 funds are also allowed to charge a performance allocation (also known as a performance fee or incentive fee). Since many hedge funds and private equity funds charge performance fees (usually above a preferred return), many are organized as 3(c)7 funds (or 3(c)1 funds if they are smaller, generally).

Definition of Qualified Purchaser

A Qualified Purchaser is:

  • A person or family-owned entity that owns at least $5 million of investments (the definition of investments excludes residences). Assets owned jointly with a spouse can be counted.
  • An entity where all of the “equity owners” are Qualified Purchasers.
  • An individual or entity that invests at least $25 million on a discretionary basis (either for themselves or on behalf of other Qualified Purchasers).
  • Certain “knowledgeable employees” of the fund and/or it’s affiliates.

Funds that require investors to be qualified purchasers usually require the investor to be accredited too. The definition of a qualified client can be found here and (similar to the treatment of accredited investors and qualified clients) the application of qualified purchaser criteria to certain types of entities often varies from fund to fund.

Concluding Thoughts

In my experience, the accredited investor qualification is the best known among individual investors, while qualified client and qualified purchaser terms are not as widely known. Investors should understand which criteria they meet in order to better understand the investments that they are allowed to invest in.

Financial Advice for New Parents

“Do you have any financial advice for new parents?”

A handful of friends have asked this question in the past week. The question often relates to childcare expenses or college savings plans, but I usually advise new parents to prioritize the below items before anything else:

  • Buy enough term life insurance to provide for your family if you and/or your spouse die prematurely. There’s no “right” amount, so ask yourself what you would want covered if you passed. Your salary of x years? Your spouse’s salary so he/she wouldn’t have to work for y years? Childcare expenses for z years? Payoff a mortgage? College tuition? Other expenses? Add those numbers up and go get some quotes.
  • Establish an estate plan, including a revocable living trust and will. The will should appoint a guardian for your children if you pass away while they’re still minors, although the courts do have the final say. The will also directs what to do with assets that were excluded from the trust (or forgotten to be put in the trust, which I see very often!). The trust should help avoid probate for assets placed within it and provide for supervision of the assets for the benefit of the children.

Buying insurance and establishing an estate plan are simple steps, but each does require some time and money. Fortunately, each item can be a one-time decision, which may be a relief for new parents who are completely overwhelmed!

In my experience though, insurance agents are hungry for business and often provide speedy and over-the-top service. And unless there is some complexity, my observation is that most attorneys can draft an estate plan within a couple days of an initial meeting.

These two steps might not optimize your financial life, but they may protect your kids against the worst outcomes.

Frequently Asked Questions (FAQs)

Many of my friends are having kids these days, which means I’m being asked about 529s more than anything else. Below are just a few of the common questions:

  • Should I open a 529?
  • Which company should I use?
  • How much should I contribute?

My answer to all of the above is:

  • Are you properly insured?
  • Is your estate plan in order?

If not, my advice is generally “Go get properly insured and engage an estate planning attorney. Before investing money for an uncertain future, invest to protect your family should anything unexpected happen.”

The above is educational and is NOT legal or financial advice. Every situation is different and I’m not an insurance agent or an attorney.

Why This Site Exists

The reason I created this site is because I believe sharing my knowledge and experience can generate a positive impact.

People have questions

This site was inspired by the friends and family who are always hitting me up with financial questions. The constant questions are a reminder that it’s difficult to find quality and trustworthy financial information. I started posting answers to the most common questions in attempt to share my knowledge with a much larger audience… and to reduce the amount of time I had to cut and paste the same email or text 🙂 Now I can just reply: “Read this post and then let’s talk!”

My reach is limited

Most of my time is spent helping people via my investment advisory firm and I find that work incredibly satisfying. However, my firm can only serve so many clients. Writing and sharing my knowledge is one way for me to broaden my impact.

People are underserved by financial advisors

Most of the American population does not have access to high-quality advice. I won’t get into all the reasons for it here, but many people are unable to work with a fee-based financial advisor. There are others who may qualify to work with an advisor, but don’t due to trust issues with the industry, cultural norms, or they just prefer to do things themselves. I believe many of these people can still benefit from some generalized information, even if it’s not personalized to their situations.

There is a lot of bad information out there

There is a lot of great information on the web. Unfortunately, there is also a lot of bad information too. I see so many things that are just plain false, missing context, or heavily biased. Obviously, I cannot stop bad content from being published, but I can write reliable information.

My hope is that this site will be a trustworthy source for financial information and answers.

A Brief History of Direct Indexing, Custom Indexing, Personalized Indexing, and SMAs

The growth of direct indexing (also referred to as custom indexing, personalized indexing, or an index SMA [separately managed accounts]) is a major development in the investing and wealth management space. Before getting into the details of what it is and how it can be used, I believe it is helpful to review the history of mutual funds and index funds, as well as the major developments that occurred in 2019.

The Invention of Mutual Funds

One hundred years ago, many Americans were investing in the stock market and they relied on brokers to execute their buy and sell orders. The brokers charged commissions, but investors were exposed to other trading costs like the bid-ask spread and unscrupulous market makers (the SEC was not established until 1934). Buying a stock could be an expensive ordeal for individuals, much less buying many stocks to build a diversified portfolio.

In 1924, the first “mutual fund” was launched. Individual investors could now pool their capital in a fund and the fund would buy stocks. Rather than receive shares of stock, investors received shares of the pooled vehicle (they owned the underlying stock mutually, hence the name mutual fund). In a sense, the mutual fund was just a wrapper that held individual stocks. The primary benefit was that investors could purchase a diversified portfolio of stocks with a single purchase.

The Invention of Index Funds

The concept of index investing had been publicly theorized as early as the 1950s. While the mutual fund wrapper was a good vehicle to realize economies of scale for individual investors, some investors were convinced that a lower-cost passively-managed portfolio was superior to a higher-cost actively-managed portfolio. The first index funds were launched in the 1970s and index investing has primarily been delivered to individual investors in a fund wrapper ever since. Rather than buying the individual securities in an index, individuals have overwhelming bought index funds which hold the individual securities in an index. Today, index funds dominate the mutual fund landscape and are nearly synomous with exchange-traded funds (ETFs). The indexing industry’s trade journal and affiliated conference even re-branded from Index Universe to ETF.com and the Inside Indexing conference is now the Index ETFs conference.

Direct Indexing pre-2019

Some index investors have been investing via separately-managed accounts (SMAs) rather than funds, since at least the early 1990s. However, just a handful of firms offered this “direct indexing” service to investment advisors (and individual investors) and minimum investment requirements were relatively high due to high fixed costs. Although minimum investment requirements had declined over the years, even incurring a fee of just $5/trade (multiplied by hundreds of trades per year) limited direct indexing to larger portfolios. Prior to 2019, there were several “robo-advisors” that rolled out direct indexing offerings, but those offerings left a lot to be desired. However, there have been a handful of recent developments and new entrants that have made direct indexing a much more attractive and feasible option for many investors.

What Changed in 2019

In February 2019, the 2019 Inside ETFs conference began with a keynote on “The State of the ETF Union.” Rather than focus on ETFs, the joint keynote speakers (Matt Hougan of Insides ETFs and Dave Nadig of ETF.com) focused on what was coming next. Hougan and Nadig predicted that there would be a “great unwrapping” as investors shifted from index fund investing to direct investing. The presentation centered on JustInvest’s direct indexing solution (Just Invest was acquired by Vanguard in 2021), although it mentioned that Parametric (owned by Eaton Vance at the time, which was acquired by Morgan Stanley in 2021) and Aperio (later acquired by BlackRock in 2020) has large direct index offerings. For the top names in the index fund world to say this was surprisingly to say the least, but their timing could not have been more prescient (as evidenced by all the acquisitions in 2020 and 2021)!

Charles Schwab cut their trading commissions to $0 on October 1, 2019.  TD Ameritrade followed suit that afternoon, E-Trade the next day, Fidelity the next week, and Vanguard the following quarter. After a decades-long price war that saw trading fees reduced a dollar or two at a time, every major broker went to zero in an instant. The elimination of trading fees was a long-awaited and welcome development for all investors. It also meant that much smaller accounts could utilize direct indexing and the wave of custodians introducing fractional share trading should reduce the minimum account size even further. 

Looking Ahead

I have a lot of jokes about forecasts and predictions, so I will not offer any here. However, I have observed changes that I expect will continue:

  • Direct indexing will be the best choice for many taxable accounts, especially for investors with the highest tax rates. Mutual funds and ETFs will remain appropriate in many situations, but direct indexing will increasingly be the right choice.
  • There will be an increase in the number of direct indexing providers and services. I have used several direct indexing solutions and can say that investors need to clearly understand the benefits and drawbacks of each offering. I have seen some great direct indexing offerings, as well as some terrible ones.
  • A direct indexing offering will be table stakes for every investment advisor. Advisors have increasingly adopted and recommended direct indexing as trading costs have declined over the years, but there is no excuse to not have a direct indexing option today.

Alternative Investments Definition

At a recent conference, I was reminded that definitions in the “alternative investment” space can be ambiguous and sponsors/managers are more than willing to slap the “alternative” label on nearly any investment product for marketing purposes.

One of the most helpful lessons I learned about “alternative” investments was that there is no such thing as an “alternative” asset. Every investable asset is either equity or debt. Let’s look at some common assets:

  • Stocks = equity in a company
  • Bonds = debt owed by a company
  • Real Estate = equity in a land or building
  • Mortgages = debt owed by a real estate owner
  • Commodities = equity in a physical asset

*Derivatives could technically be classified as a third category, but they will “derive” their value from equity or debt and can behave like either depending on the structure.

So the most important thing to know about alternative investments is that there’s no such thing. “Alternative” describes an asset’s place in a classification system, but not an inherent attribute. Hybrid assets, structured products, hedge funds, private equities, infrastructure, and so on can all be disaggregated into equity and debt.

So before investing in an “alternative” investment, throw out the alternative moniker and understand what exactly the investment is and how it will behave. This simplified framework has been invaluable to me and I hope it is for you too!

MSCI World ex-USA vs MSCI EAFE

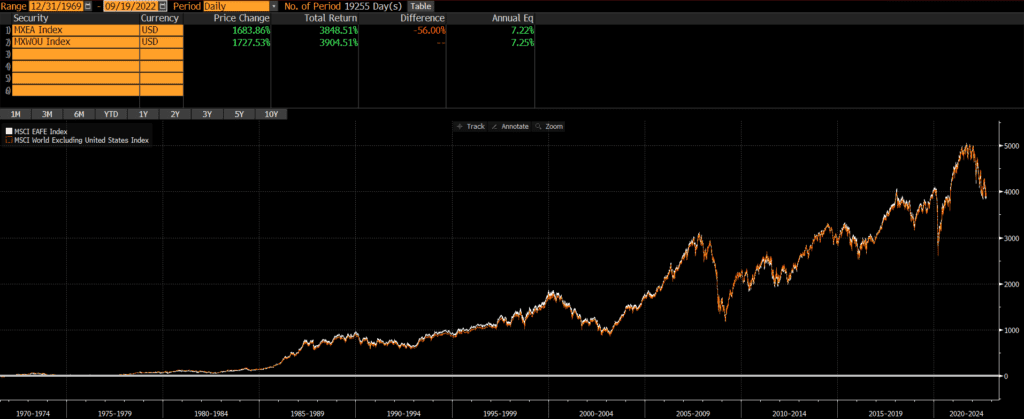
The MSCI EAFE Index and the MSCI World ex-USA Index are two popular (and nearly identical) indices that many index portfolios are benchmarked to. The historical performance of EAFE vs World ex-USA is nearly identical, despite some differences in country exposure.

A quick note that investors cannot invest directly in an index. These unmanaged indexes do not reflect management fees and transaction costs that are associated with an investable vehicle, such as the iShares EAFE ETF (symbol: EFA). A reminder that this is simply an example as this site does NOT provide investment recommendations.

Historical Performance: MSCI World ex-USA Index vs MSCI EAFE Index

Returns since inception of the indices in 1970 have been nearly identical. Over the past 52 years, the annualized performance differs by only .03%!

Source: Bloomberg

The MSCI World ex-USA Index includes exposure to stocks in developed markets around the globe, except for the US. MSCI’s EAFE Index stands for Europe, Australasia, and Far East and it covers developed markets in those regions such as the UK, Australia, and Japan. However, it does not include North America, so stocks from both the US and Canada are absent from the index.

Current Index Composition: MSCI EAFE vs MSCI World ex-USA

These two indices are nearly identical, so I will not include all of the usual comparison tables in this post.

  • The biggest difference is that Canada which makes up roughly 11.5% of the MSCI World ex-USA Index, while EAFE does not include it.
  • Both MSCI World ex-USA and MSCI EAFE only own developed markets and do not own any emerging markets.
  • Even thought both indices are broad-based in terms of market capitalizations, both are market cap weighted and heavily tilted towards large-cap stocks.
  • Additionally, the MSCI EAFE and MSCI World ex-USA have nearly identical sector weights.
  • The number of constituents stocks is similar too. MSCI EAFE has 779 stocks while MSCI World ex-USA has 887 stocks.

Composition Differences

Geography

The two indices are both extremely broad and have good coverage of developed markets, while both exclude emerging markets. The primary difference is the exposure to Canada.

Country Exposures

There are some slight differences in country weights between the two indices, although the largest difference is the exposure to Canada. Below is summary of the top country weights in each index, as of 9/30/2022.

MSCI EAFE IndexMSCI World ex-USA Index
Japan22.63%19.99%
United Kingdom15.54%13.72%
Canada0%11.67%
France11.31%9.99%
Switzerland10.75%9.50%
Totals may not equal 100% due to rounding.
Source: ThoughtfulFinance.com, MSCI

Market Cap

As of 9/30/2022, the market cap exposures of the two indices are nearly identical. The average constituent market cap of each index is approximately $15 billion, while the median of each is about $7 billion.

Sectors

The sector exposures between the indices are nearly identical, as of September 20, 2022.

MSCI EAFE IndexMSCI World ex-USA Index
Financials17.60%19.88%
Industrials15.04%14.65%
Healthcare13.53%11.96%
Consumer Discretionary11.28%10.39%
Consumer Staples11.26%10.50%
Information Technology7.92%7.64%
Materials7.48%7.93%
Energy4.93%6.53%
Communication Services4.82%4.55%
Utilities3.37%3.44%
Real Estate2.27%2.52%
Totals may not equal 100% due to rounding.
Source: ThoughtfulFinance.com, MSCI

Concluding Thoughts

These two indices are nearly identical in terms of performance and sector exposure. There is a difference in geographic exposure (primarily Canada). Investors cannot invest in indices directly and should do their own research before deciding to invest in a strategy or fund that tracks either index. With such a small performance difference though, the costs of investable index strategies may be a larger consideration than which benchmark to select. Sometimes benchmark selection matters quite a bit, although that does not appear to be the case between these two indices.

Further Reading

Investors who would like exposure to Canada, may want to consider reading our comparison of MSCI ACWI vs MSCI World. Both indices include exposure to Canada.

Additionally, investors who wish to only exclude US exposure, but maintain exposure to Canada and emerging markets may want to review our comparison of MSCI ACWI ex-USA vs MSCI EAFE.

Scroll to Top