The MSCI World index and the MSCI ACWI index are two popular global stock indices, which many index portfolios track. Although there are some important differences, the long-term performance has been nearly identical. Let’s take a look at MSCI ACWI vs MSCI World:
A quick note investors cannot invest directly in an index. These unmanaged indexes do not reflect management fees and transaction costs that are associated with an investable vehicle, such as the iShares MSCI ACWI ETF (symbol: ACWI) or the iShares MSCI World ETF (symbol: URTH). Readers who want to compare these ETFs rather than the underlying indices should check out our ETF comparison of URTH vs ACWI. A reminder that these funds are simply examples as this site does NOT provide investment recommendations.
Difference Between MSCI World vs MSCI ACWI
The main difference between the MSCI World Index and the MSCI ACWI index is that MSCI World only includes stocks of developed markets, while the MSCI ACWI Index includes stocks in both developed and emerging markets. Developed markets are markets such as the US, Japan, Western Europe and so on, while emerging markets include places like China and India. Since emerging markets have bounced around between 10-15% of global market cap in the past decade or two (and were much smaller prior to that), the risk and returns of the MSCI World and MSCI ACWI indices have been nearly identical (as shown in the below chart of historical performance).
Historical Performance: MSCI World vs MSCI ACWI
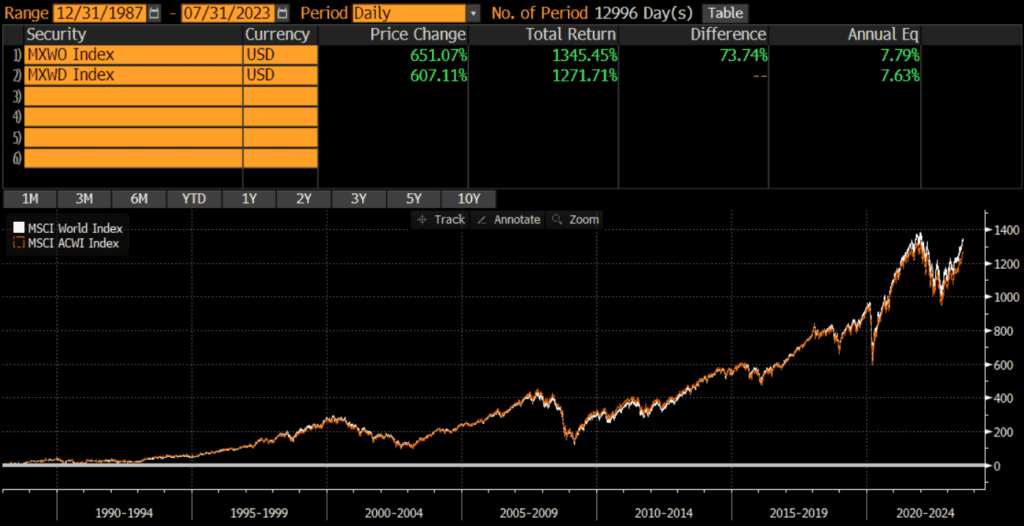
MSCI World was launched in 1986, while MSCI ACWI was launched in 2001. However, MSCI has back-tested performance data going back to (at least) 1987. Since then, the two indices have performed nearly identically. MSCI World has an annualized performance of 7.79%, while MSCI ACWI was an annualized performance of 7.63%. Even though the annualized difference is only .16%, this has compounded to a difference of over 73% since 1987.
Current Index Composition: MSCI ACWI vs MSCI World
As of 9/30/2022, the geographic, market cap, and sector weights are quite similar.
- The major difference is that the MSCI World is 100% developed markets, while MSCI is 88% developed markets and 12% emerging markets.
- Even thought both indices are broad-based in terms of market capitalizations, both are market cap weighted and heavily tilted towards large-cap stocks.
- Additionally, the MSCI ACWI and MSCI World have nearly identical sector weights.
Geographic Exposure
ACWI stands for All Country World Index and so the MSCI ACWI Index includes stocks from a broader set of countries than the MSCI World Index. The primary difference is the inclusion and exclusion of emerging markets.
Below are the top five country weights of the two indices, as of 6/30/2023. Note that China is NOT included in the MSCI World’s top holdings.
| MSCI World | MSCI ACWI | |
| US | 69.42% | 61.95% |
| Japan | 6.12% | 5.46% |
| UK | 4.04% | 3.60% |
| China | 0.00% | 3.30% |
| Canada | 3.20% | 3.00% |
Market Cap Exposure
The MSCI ACWI Index is a much broader index with 2,934 constituents vs MSCI World’s 1,512 constituents (as of 6/30/2023).
Both indices are market cap weighted, so the both indices are essentially large-cap indices. If we use the URTH and ACWI ETFs as proxies for the indices, we find that the market cap exposure is nearly identical (despite differences in the mean and median market caps).
| MSCI World | MSCI ACWI | |
| Large Cap | 83% | 84% |
| Mid Cap | 17% | 16% |
| Small Cap | 0% | 0% |
| MSCI World | MSCI ACWI | |
| Mean Market Cap | $38.79 billion | $22.40 billion |
| Median Market Cap | $14.58 billion | $6.01 billion |
Sector Weights
The MSCI World and MSCI ACWI indices have nearly identical sector exposures. Every sector weight in each index is within 1% of the other.
| MSCI World | MSCI ACWI | |
| Information Technology | 22.09% | 21.90% |
| Financials | 14.89% | 15.61% |
| Healthcare | 12.52% | 11.58% |
| Consumer Discretionary | 11.05% | 11.39% |
| Industrials | 10.96% | 10.47% |
| Consumer Staples | 7.27% | 7.16% |
| Communication Services | 7.19% | 7.48% |
| Energy | 4.69% | 4.73% |
| Materials | 4.19% | 4.63% |
| Utilities | 2.74% | 2.72% |
| Real Estate | 2.41% | 2.34% |
Conclusions
What does this mean for investors? Since the risks and returns of the indices are nearly identical, selecting an investment vehicle and cost structure may matter more than selecting the index. A fund investor might select MSCI ACWI due to the greater geographic diversification (especially with a large index fund that invests in local exchanges), while an SMA investor might opt for MSCI World due to cost considerations. Of course, the next 35 years could be completely different than the past 35 years!
Further Reading
Investors who want to compare a non-MSCI global index that has slightly different exposures from the the above indices, may want to evaluate the FTSE Global All-Cap Index vs MSCI ACWI Index.
Investors who want to see how the above comparison looks if US exposure is excluded should read my comparison of MSCI World ex-USA vs MSCI ACWI ex-USA.