What is the 2s10s?
One of the most-watched economic indicators is the 2s10s curve or 2s10s spread, which is simply the difference between the 10-year US Treasury yield and the 2-year US Treasury yield. It is sometimes referred to as 10s2s, 2s/10s, 10-2s, 10-2 yield spread and so on, but 2s10s is the most common name. There are other yield curve spreads, but the 2s10s may be the most popular.
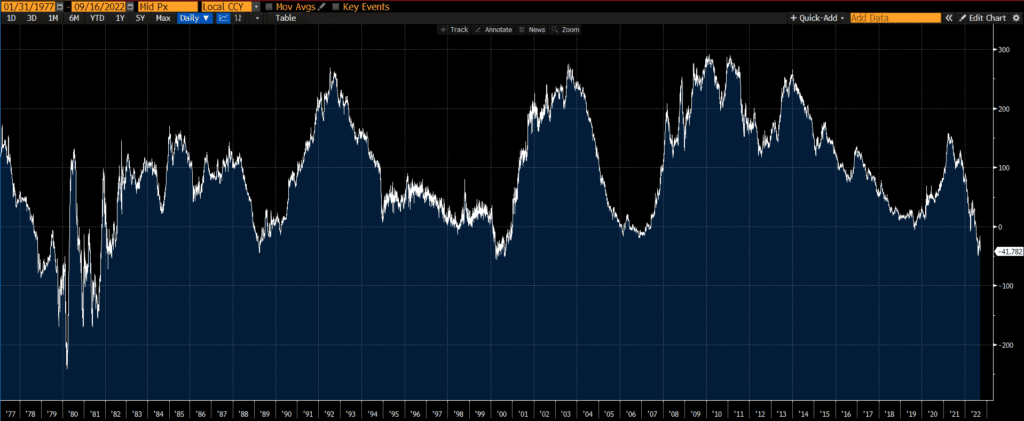
Below is a chart of the 2s10s through time.
How is the 2s10s calculated?
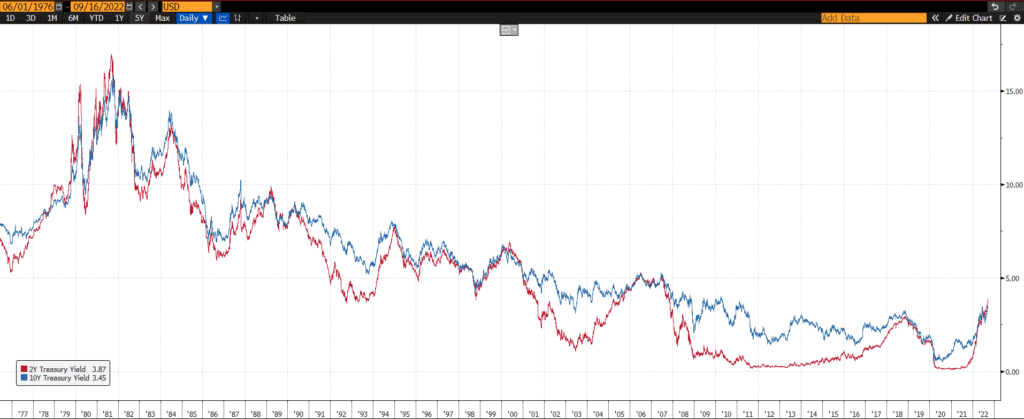
We can see how the 2s10s spread is calculated below, by simply subtracting the 2-year yield (red line) from the 10-year yield (blue line).
The 2s10s spread is often referenced because it provides a quick and simple indication of the slope of the yield curve.
What is the significance of the 2s10s?
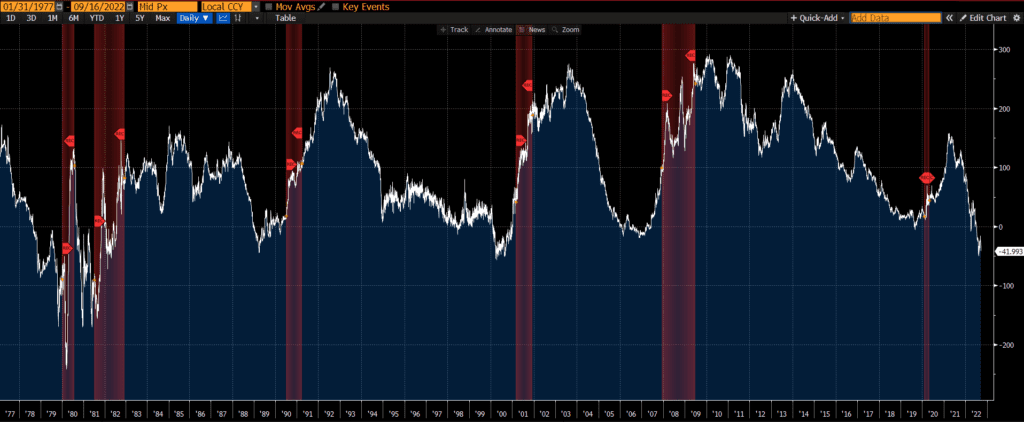
Historically, steep yield curves (indicated by a high 2s10s reading) are often followed by strong economic and financial market performance, while flat yield curves (indicated by low 2s10s readings) are followed by weaker performance. Sometimes the yield curve flattens so much that it “inverts” and shorter-term rates are higher than longer-term rates (and the 2s10s reading goes negative). An “inverted yield curve” is typically seen as a warning sign as inverted yield curves are often followed by recessions. The red bars in the below chart indicate recessions. Interestingly, not all inversions are followed by a recession, but every recession is preceded by an inversion.
How to track the 2s10s
You can find the 2s10s on many websites. My favorite website to track the 2s10s is FRED (Federal Reserve Economic Data), which is published by the Federal Reserve Bank of St. Louis. Below is a chart (updated daily) that can be found here.

Further Reading
There are many other yield curve spreads that market participants and policymakers monitor, such as the 3-month 10-year spread (which has the best track record of predicting recessions, historically speaking), the 2s30s, and many others. For an up-to-date look at other yield curve spreads, see our yield curve spread chart page.
In blog posts and press conferences, the Federal Reserve has begun focusing on the near-term forward yield spread as a predictor of recessions and indicator of economic conditions.