The yield curve is a simple chart of rates on US Treasuries from 1-month to 30-years, yet many observers have noticed that it has an remarkable track record of “forecasting” recessions. Many recessions have begun relatively soon after a yield curve inversion. So headlines are made whenever parts of the yield curve invert and continue as long as there is an inverted yield curve. As is often the case, headlines and articles often skip key details.
What part of the yield curve?
Before asking whether the yield curve forecasts recessions, it is important to define which part of the yield curve is being referenced.
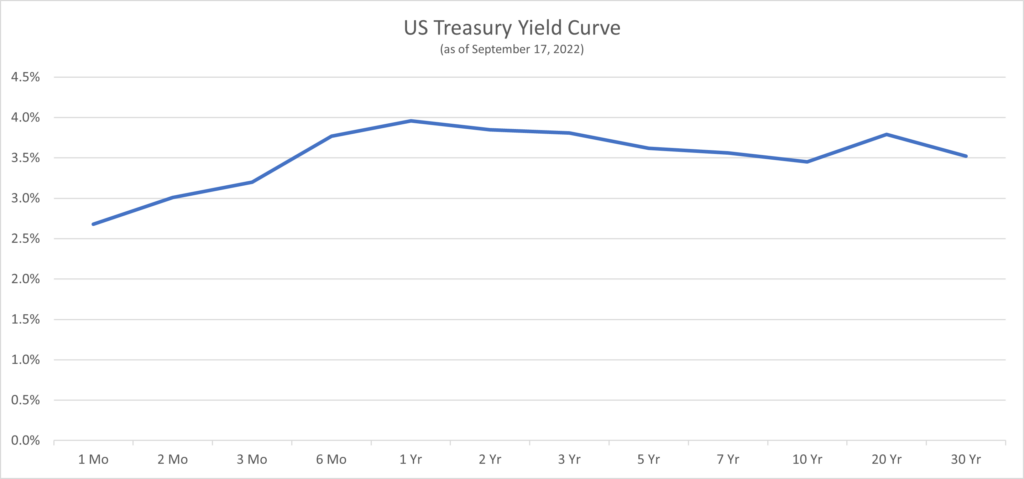
Different parts of the curve may indicate different things. For instance, some parts of the yield curve may be inverted and other parts may be positively sloped. The above chart shows that the 2s10s is negative (inverted) since the 10-year yield is lower than the 2-year yield. However, the 10s30s is positive (not inverted) since the 30-year yield exceeds the 10-year yield. So it is important to define which part of the yield curve is being references, since the relationship between some parts of the curve are much better at forecasting recessions than others.
We will review each yield curve spread listed on our chart page to illustrate which spreads are best at forecasting recessions.
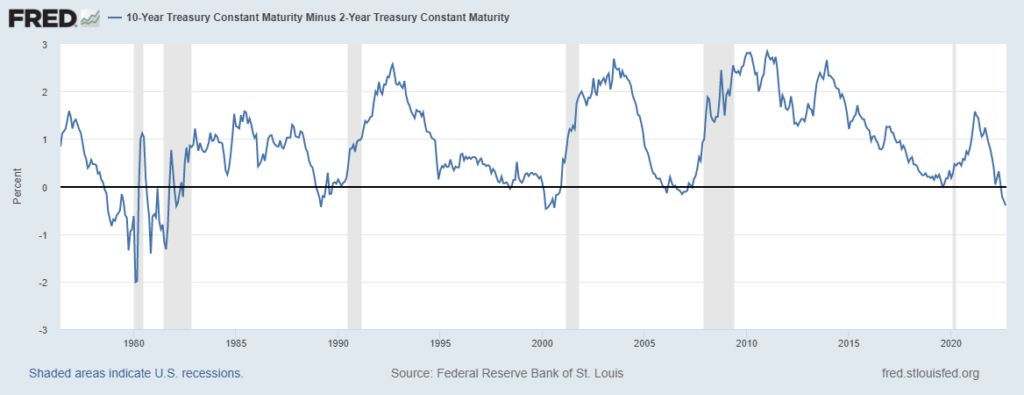
2s10s
When looking at below chart of the 2s10s (the spread between the 10-year yield and the 2-year yield) we find that every single recession in the past 45 years has been preceded by a yield curve inversion. However, the curve did invert and then un-invert more than a year before a recession in several instances, which some observers may consider false positives.
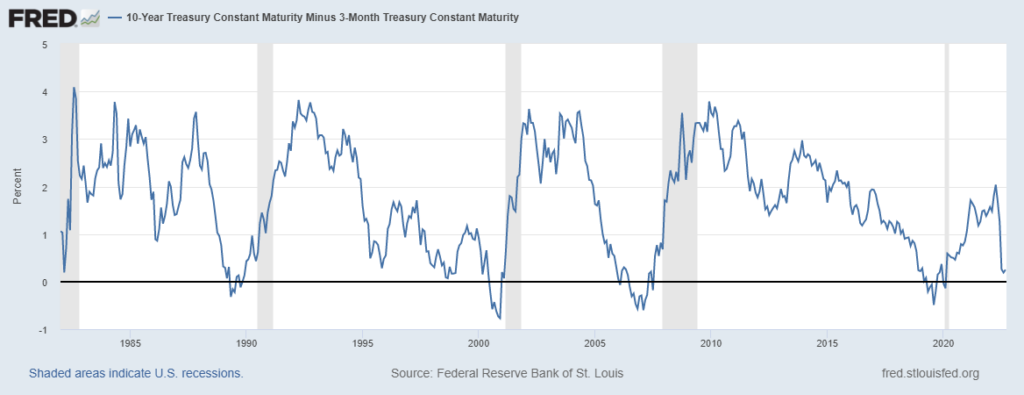
3m10y
Moving on to the 3-month 10-year yield spread, we find a much better indicator. Not only was every single recession preceded by an inversion, but we do not have the same long lags (or false positives) as with the 2s10s.
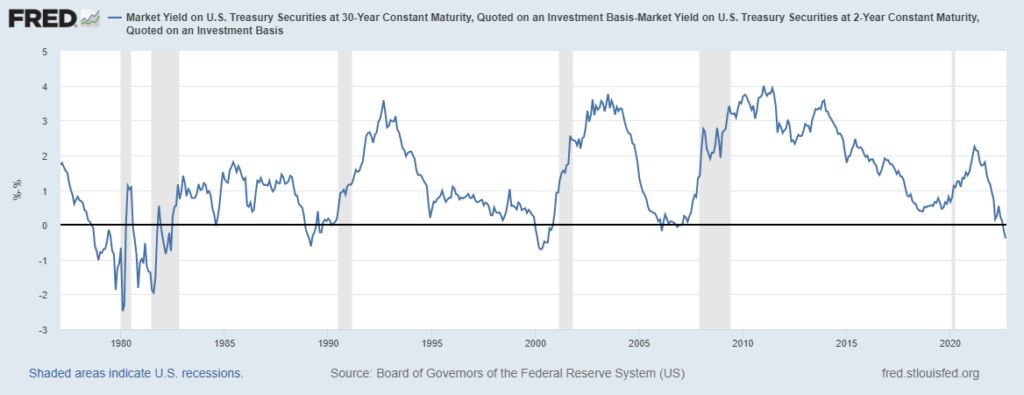
2s30s
The 2s30s yield spread does not look like a good recession indicator. This measure did not invert prior to the 2020 recession (although maybe we can forgive it for not predicting a pandemic!) and it also inverted briefly in the early 1980s many years before another inversion and recession.
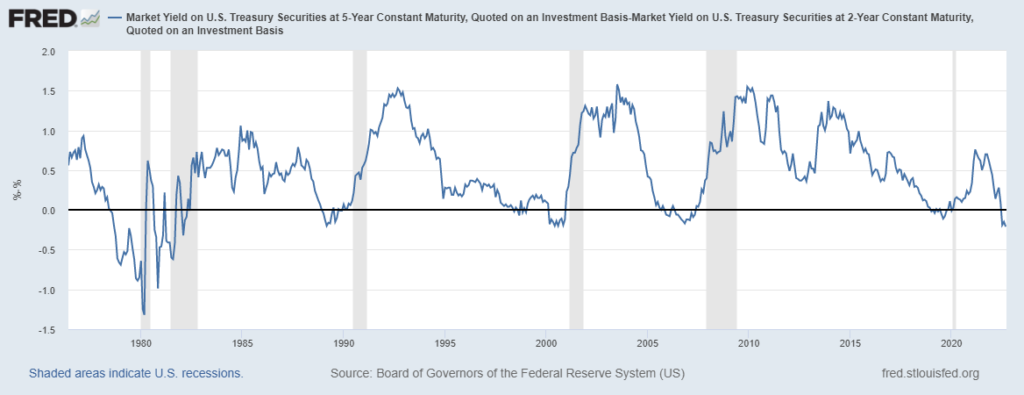
2s5s
The 2s5s looks a bit better and throws off the essentially the same signals as the 2s10s. Every single recession was preceded by an inversion, but some of the recessions were quite a bit later than the inversion.
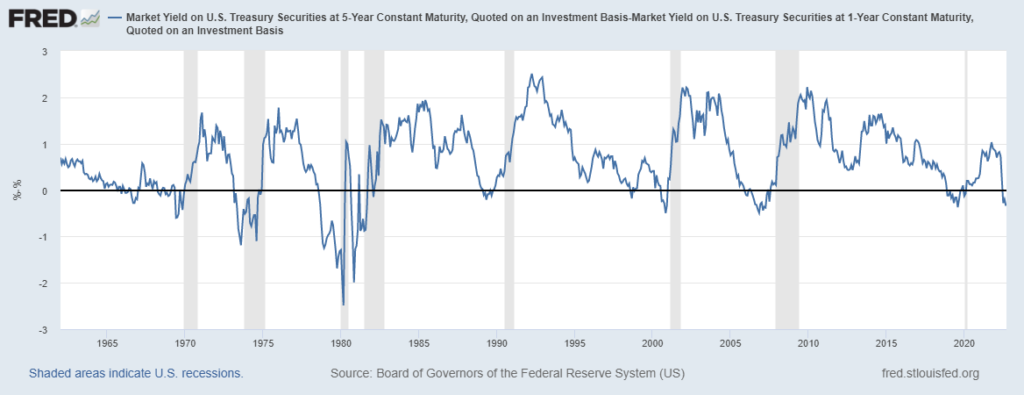
1s5s
The 1s5s data goes back a bit further, but some of the inversions are well before a recession and may be considered false positives. This one doesn’t appear great or terrible.
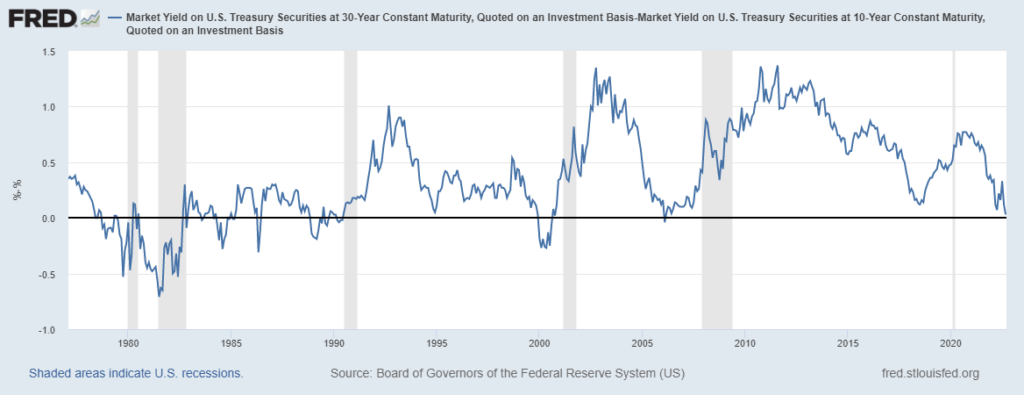
10s30s
We will wrap up by looking at the 10s30s. A quick glance indicates that it has inverted quite a few times with no recession. It also barely inverted before the Global Financial Crisis (GFC) and did not invert prior to the 2020 recession, so this has not been a great indicator overall.
Verdict
As the above charts show, the 3-month 10-year spread has the best record of predicting recessions. It has inverted shortly before each recession in the past 40 years, without any false positives. The 2s10s and 2s5s also have a decent record, but there have been more inversions than recessions so this indicator has generated false positives.
The future may be different than the past and even an inverted 3-month 10-year curve may not be followed by a recession. On the other hand, these indicators have a better track record than most forecasters. Readers can also read more about why an inverted yield curve predicts recessions.