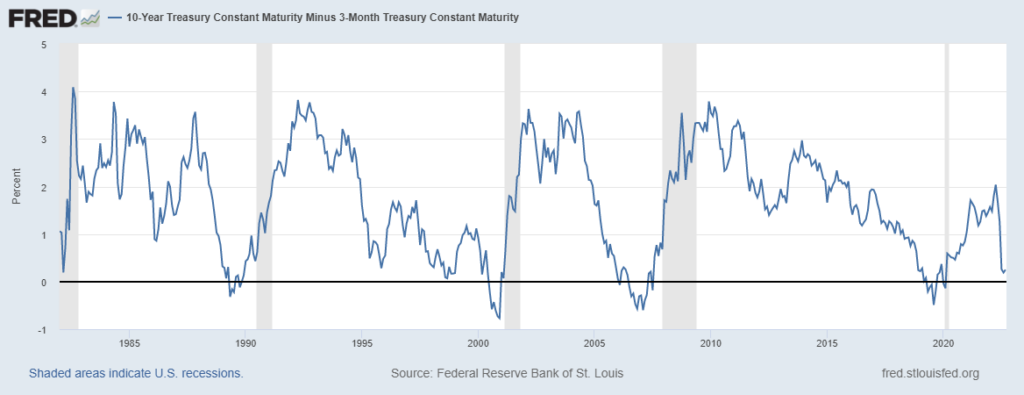
It has been documented that when certain parts of the yield curve invert, a recession often follows. Many follow the 2s10s, although the 3-month 10-year spread has been the best indicator historically. If the yield curve is a overly simplistic piece of data, why and how do yield curve inversions signal recessions so well?
The short answer is: Yield curve inversions signal recessions because they are a byproduct of policymakers’ attempts to slow down the economy. The long answer is below.
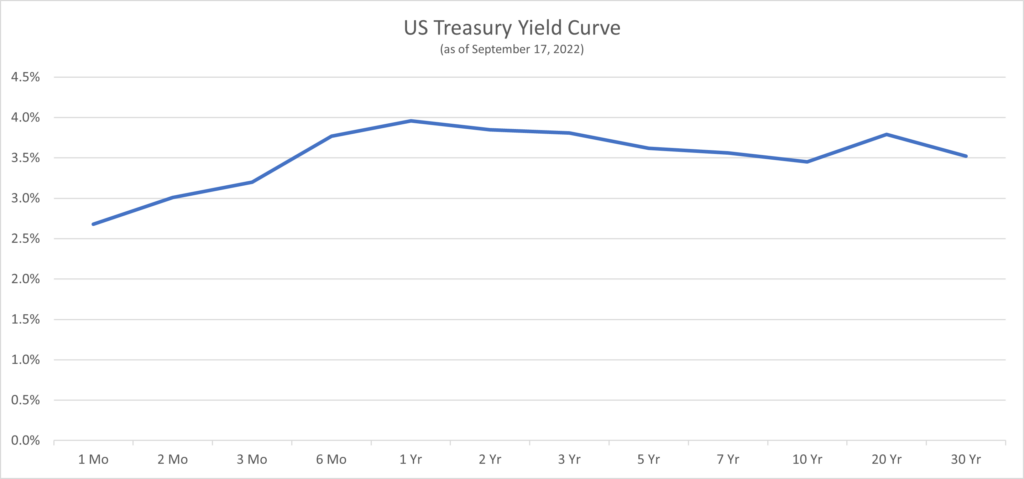
Influences on the yield curve
The yield curve is simply a graph of Treasury rates by maturity. The short-end of the curve is more heavily influenced by the overnight interest rates set by policymakers (such as the Federal Reserve) than the long-end of the curve (which is much further away from maturity). In other words, policy decisions are a bigger factor on the front end of the curve and the long end of the curve is (believed to be) more of a “natural” market-driven rate.
Yield curve inversions driven by short maturities
Looking a chart of the 3-month yield and the 10-year yield, it is clear that the steepening and flattening of the yield curve is primarily due movements in the 3-month yield. The yield curve steepens when the 3-year rate falls and flattens (and even inverts) when the shorter-term rate increases. The major steepening and flattening is not driven by moves in the 10-year yield.
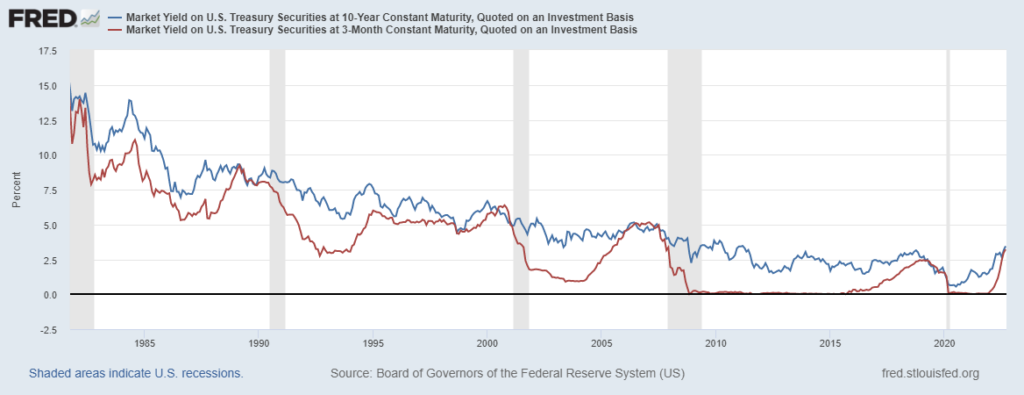
In summary, policymakers are a major influence on shorter-term rates, which are the primary driver of yield curve steepening and flattening trends.
Policymakers are trying to slow down the economy
Policymakers generally increase rates when the economy is doing well as they want to slow things down, in order to contain inflation (and possibly other excesses). Some view yield curve inversions as policy mistakes, where policymakers overtighten financial conditions which induces recessions. Others point out that inversions are consistent with policymakers’ goals of slowing down the economy and that policymakers often continue to tighten after an inversion has occurred.
In both the early 1980’s and early 1990’s, short-term rates were driven up by policymakers but not to the point of inversion. No recession followed either hiking cycle. However, the above charts show that recessions did follow hiking cycles that resulted in inversions.
Recessions often follow inverted yield curve inversions because policymakers are actively trying to slow down the economy and/or they overshoot this goal.