The MSCI EAFE Index and the MSCI ACWI ex-USA Index are two popular international indices that many portfolios and investment vehicles are benchmarked to. Both are representative of international stocks, but there are two major differences when comparing MSCI ACWI ex-USA vs MSCI EAFE. MSCI EAFE does not include Canada or emerging markets.
A quick note that investors cannot invest directly in an index. These unmanaged indexes do not reflect management fees and transaction costs that are associated with an investable vehicle, such as the iShares MSCI ACWI ex-USA ETF (symbol: ACWX) or the iShares MSCI EAFE ETF (symbol: EFA). A reminder that these are simply examples as this site does NOT provide investment recommendations.
Historical Performance: MSCI ACWI ex-USA vs MSCI EAFE
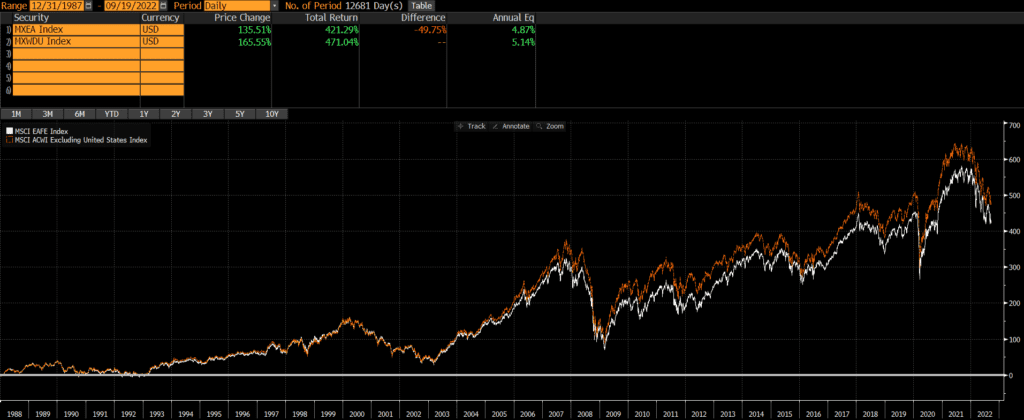
These two indices are overwhelmingly similar, but the small difference in holdings from both Canada and emerging markets has led to some difference in performance as well. The inclusion of these markets has driven ACWI ex-USA to outperform EAFE by roughly .27% annualized, since MSCI ACWI ex-USA’s inception. This is not a huge amount, but it can add up over time. Additionally, the chart shows that the historical volatility and drawdowns have not been appreciably different.
Composition Differences: MSCI ACWI ex-USA vs MSCI EAFE
Geography
The main difference between the two indices is exposure to Canada and emerging markets.
EAFE stands for Europe, Australasia, and Far East and thus it covers markets such as the UK, Australia, and Japan, while excluding both the USA and Canada. However, it also excludes emerging markets.
ACWI ex-USA stands for All Country World Index ex-USA and, as its name suggests, the index includes exposure to markets in all countries except the US. So it includes Canadian stocks, as well as emerging markets stocks in China, India, Brazil, and so on.
As of 10/31/2022, the geographic exposures are roughly:
| MSCI ACWI ex-USA | MSCI EAFE | |
| Developed Markets | 72% | 99% |
| Emerging Markets | 28% | 0% |
Sources: ThoughtfulFinance.com, Bloomberg
Below is table with a more precise breakdown of the top country exposures, as of 10/31/2022. Note the differences in exposures to Canada and emerging markets (China, India, Taiwan).
| MSCI ACWI ex-USA | MSCI EAFE | |
| Japan | 14.06% | 21.96% |
| United Kingdom | 9.65% | 15.56% |
| China | 9.16% | 0% |
| Canada | 8.18% | 0% |
| Switzerland | 6.67% | 10.44% |
| France | 7.00% | 11.68% |
| Australia | 4.94% | 7.93% |
| Germany | 4.69% | 7.90% |
| India | 4.46% | 0% |
| Taiwan | 4.05% | 0% |
Market Cap
| MSCI ACWI ex-USA | MSCI EAFE | |
| Large Cap | 88% | 88% |
| Mid Cap | 12% | 12% |
| Small Cap | 0% | 0% |
Sectors
As of October 2022, the sector exposures of the two indices are very similar.
| MSCI ACWI ex-USA | MSCI EAFE | |
| Basic Materials | 8.27% | 7.53% |
| Consumer Cyclical | 10.39% | 10.55% |
| Financial Services | 21.15% | 17.91% |
| Real Estate | 2.34% | 2.73% |
| Communication Services | 5.87% | 4.96% |
| Energy | 6.70% | 5.29% |
| Industrials | 12.20% | 15.03% |
| Technology | 10.89% | 8.28% |
| Consumer Defensive | 8.96% | 10.76% |
| Healthcare | 10.04% | 13.87% |
| Utilities | 3.18% | 3.10% |
Final Thoughts on MSCI ACWI ex-USA vs MSCI EAFE
Investors cannot invest in indices directly and should do their own research before deciding to invest in a fund that tracks either index. However, understanding the differences in composition and performance between similar indices is fundamental.
Deciding between MSCI EAFE vs MSCI ACWI ex-USA will likely have to do more with what the rest of an investor’s portfolio looks like rather than the composition of these indices.
Further Reading
Investors who are looking for a benchmark that sits between MSCI EAFE and MSCI ACWI ex-USA may want to consider the MSCI World ex-USA. We previously wrote a comparison of MSCI World ex-USA vs MSCI EAFE for readers who are interested in exploring this option.
Investors who want greater small-cap exposure may want to consider the FTSE Global All-Cap Index and read our comparison of FTSE Global All-Cap vs MSCI ACWI.