Some of the largest index funds track the FTSE Global All Cap Index and the MSCI ACWI Index. While many may view these indices as interchangeable, there are some important differences when comparing the MSCI ACWI Index vs the FTSE Global All Cap Index. The primary differences appear to be slightly different exposures in developed vs emerging markets as well as market cap exposures.
A quick note that investors cannot invest directly in an index. These unmanaged indexes do not reflect management fees and transaction costs that are associated with an investable vehicle, such as the Vanguard Total World Stock ETF (symbol: VT) or the iShares MSCI ACWI ETF (symbol: ACWI). A reminder that these are simply examples as this site does NOT provide investment recommendations.
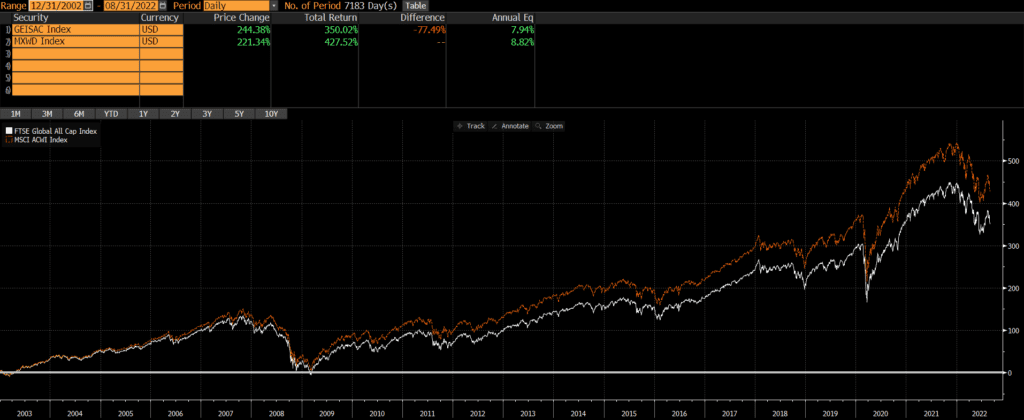
Historical Performance: FTSE Global All Cap Index vs MSCI ACWI Index
Over the past 20 years, we can see that MSCI ACWI has outperformed the FTSE Global All Cap by .88% annualized. However, this performance is a story of two halves.

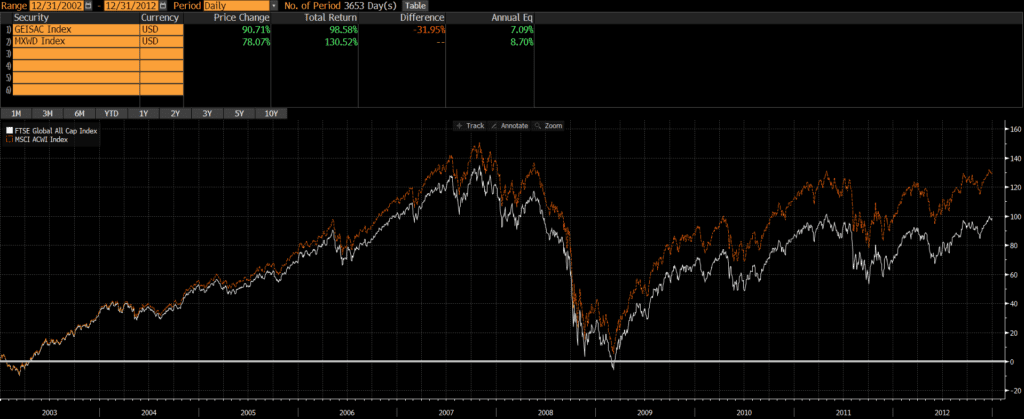
The first 10 years
From 2003 through 2012, the MSCI ACWI Index outperformed the FTSE Global All Cap Index by a wide margin on an annualized basis, 8.70% versus 7.09%. It is not immediately clear what drove the performance differential during this decade, but my suspicion is that the greater exposure to emerging markets drove ACWI’s outperformance during the early years of this century.

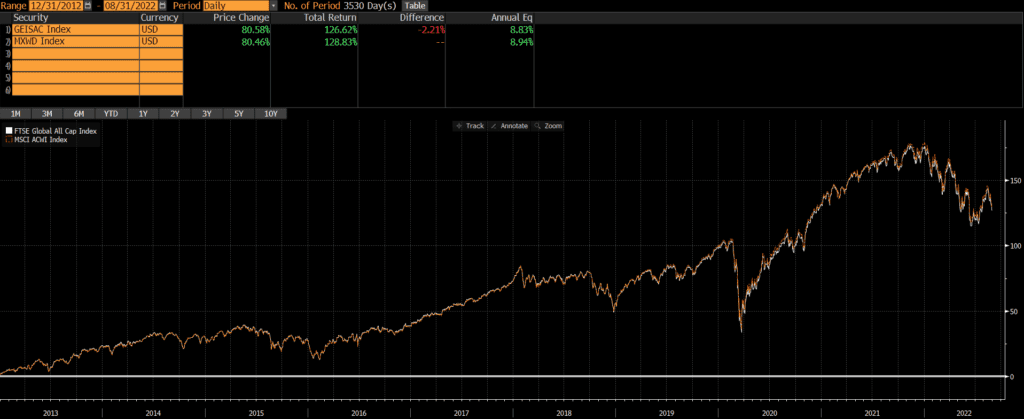
The past 10 years
The past 10 years has been a different ballgame as performance chart between the two indices is nearly identical. The annualized difference between the two has only been .11%!

Composition Differences: FTSE Global All Cap Index vs MSCI ACWI Index
Geography
The two indices are both extremely broad and have good representation from both developed and emerging markets. Although the top 10 countries are identical, the FTSE Global All Cap Index has a bit more exposure to developed markets and less exposure to emerging markets.
Country Exposures
There are some slight differences in country weights between the two indices, but there is 100% overlap in the top 10 countries of each index (as of 9/30/2022).
| FTSE Global All Cap Index | MSCI ACWI Index | |
| United States | 60.19% | 62.84% |
| Japan | 6.12% | 5.21% |
| United Kingdom | 3.84% | 3.68% |
| China | 3.42% | 2.73% |
| Canada | 3.06% | 3.13% |
| Switzerland | 2.65% | 2.47% |
| France | 2.22% | 2.77% |
| Australia | 2.06% | 1.88% |
| India | 1.98% | 1.65% |
| Germany | 1.72% | 1.86% |
Source: ThoughtfulFinance.com, Vanguard, Blackrock
Market Classification
As of October 2022, the FTSE Global All Cap Index has more exposure to developed markets than the MSCI ACWI Index.
| FTSE Global All Cap Index | MSCI ACWI Index | |
| Developed Markets | 88% | 72% |
| Emerging Markets | 11% | 28% |
Source: ThoughtfulFinance.com, Bloomberg
Market Cap
As of October 2022, the MSCI ACWI Index is tilted more heavily towards large-cap stocks. However, both indices are market cap weighted, so both are overwhelming composed on large-caps.
| FTSE Global All Cap Index | MSCI ACWI Index | |
| Large Cap | 75% | 84% |
| Mid Cap | 20% | 16% |
| Small Cap | 6% | 0% |
Source: ThoughtfulFinance.com, Morningstar.com
Sectors
The sector exposures between the indices are nearly identical, as of October 2022.
| FTSE Global All Cap Index | MSCI ACWI Index | |
| Basic Materials | 4.83% | 4.52% |
| Consumer Cyclical | 11.29% | 10.68% |
| Financial Services | 15.66% | 15.90% |
| Real Estate | 3.58% | 2.61% |
| Communication Services | 6.88% | 7.32% |
| Energy | 5.14% | 5.80% |
| Industrials | 10.60% | 9.78% |
| Technology | 18.76% | 19.53% |
| Consumer Defensive | 7.39% | 7.71% |
| Healthcare | 12.73% | 13.18% |
| Utilities | 3.12% | 2.96% |
Source: ThoughtfulFinance.com, Morningstar.com
Concluding Thoughts
Over the past 20 years differences in index construction have led to a performance difference between the FTSE Global All Cap Index and the MSCI ACWI Index, although that has not been the case over the past decade. Will the performance differential re-appear or will these two indices essentially track each other moving forward? Time will tell.
Further Reading
Interestingly, we did not find an even smaller performance difference when comparing the MSCI ACWI Index vs the MSCI World Index, where the main difference was the inclusion of emerging markets. I am not sure what to make of this discrepancy, but is an area for future research.
Investors looking for a global benchmark without US exposure may want to read our comparison of MSCI ACWI ex-USA vs MSCI EAFE.
Of course, some investors do not want exposure to the US or emerging markets (as they may have exposure to those asset classes elsewhere), in which case my comparison of MSCI World ex-USA vs MSCI EAFE may be helpful.