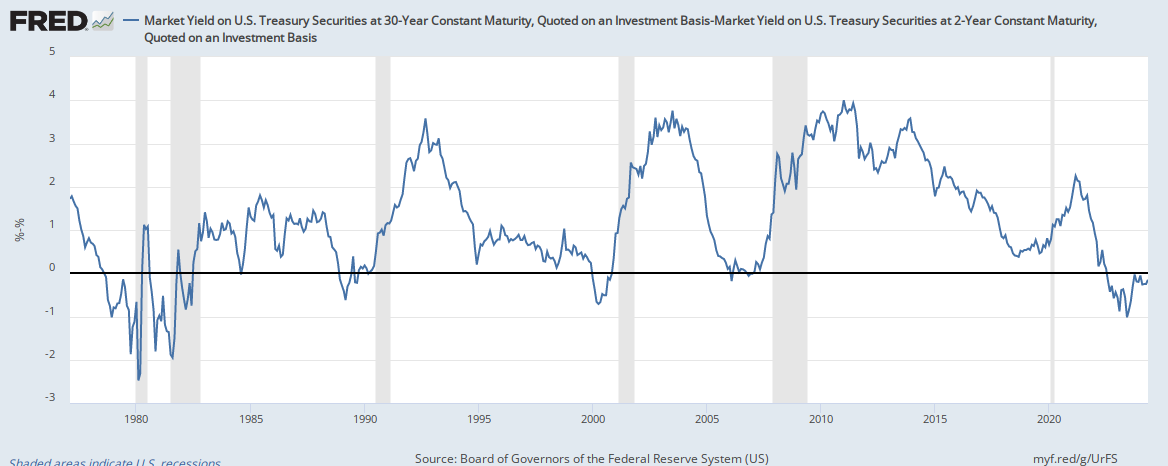
One economic indicator is the 2s30s curve or 2s30s spread, which is simply the difference between the 30-year US Treasury yield and the 2-year US Treasury yield. It is also referred to as 30s2s, 2s/30s, 30-2 yield spread and so on, but 2s30s is the most common name. There are other yield curve spreads as well, including the most popular 2s10s spread.
Below is a chart of the 2s30s through time.
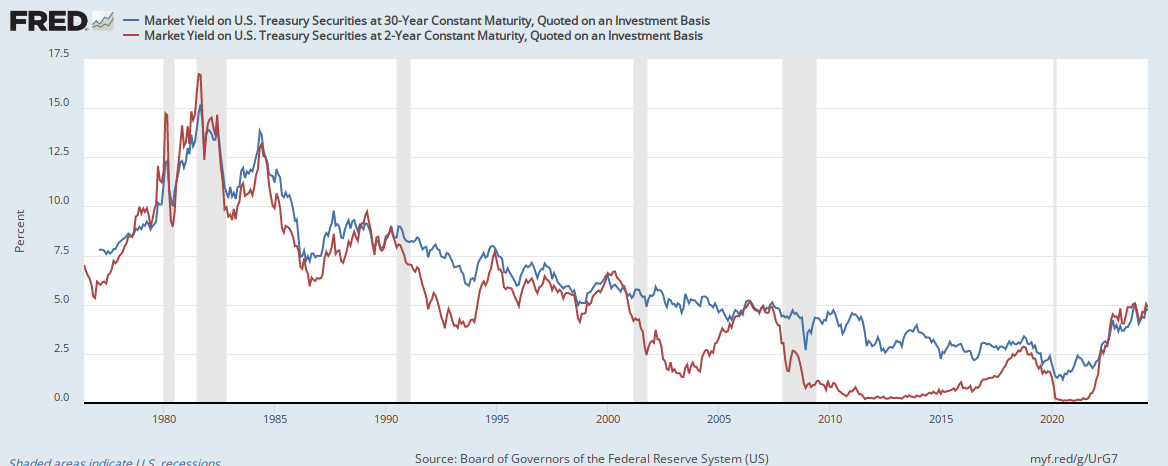
How is the 2s30s calculated?
We can see how the 2s30s spread is calculated below, by simply subtracting the 2-year yield (red line) from the 30-year yield (blue line).
What is the significance of the 2s30s?
Historically, steep yield curves (indicated by a high 2s30s reading) are often followed by strong economic and financial market performance, while flat yield curves (indicated by low 2s30s readings) are followed by weaker performance.
Sometimes the yield curve flattens so much that it “inverts” and shorter-term rates are higher than longer-term rates (and the 2s30s reading goes negative). An “inverted yield curve” is typically seen as a warning sign as inverted yield curves are often followed by recessions. The gray bars in the above charts indicate recessions.
The 2s30s does not have a great record relative to some other yield curve measures. This measure did not invert prior to the 2020 recession (although maybe we can forgive it for not predicting a pandemic!) and it also inverted briefly in the early 1980s many years before another inversion and recession. For a brief summary of which yield curve measures have the best track record of “predicting” recessions, read this post of whether the yield curve predicts recessions.
How to track the 2s30s
You can find the 2s30s on many websites. My favorite website to track the 2s30s is FRED (Federal Reserve Economic Data), which is published by the Federal Reserve Bank of St. Louis. The first chart (above) can also be found here.
Other yield curve spreads
There are many other yield curve spreads that market participants and policymakers monitor, such as the 2s10s, the 3-month 10-year spread, and many others. For an up-to-date look at other yield curve spreads, see our yield curve spread chart page.