The iShares URTH and iShares ACWI are two popular ETFs that track the well-known indices MSCI World and MSCI ACWI, respectively. Although there are some important differences, the long-term performance of URTH vs ACWI has been nearly identical.
A reminder that this site does NOT provide investment recommendations.
Historical Performance: URTH vs ACWI
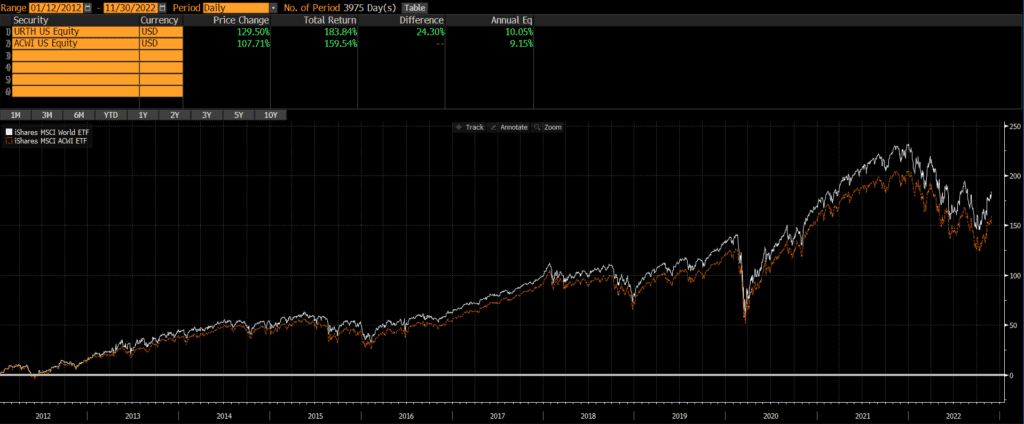
ACWI is the older of the two ETFs as it was launched on March 28, 2008. URTH was launched just a few years later on January 12, 2012. Since them, URTH has outperformed by .90% annually.
URTH only includes stocks of developed markets (think the US, Western Europe, Japan, Canada, Australia, etc), while ACWI includes stocks in both developed and emerging markets (think China, India, Brazil, etc). Emerging markets have bounced around between 10-15% of global market cap in the past decade or two (and were much smaller prior to that).
Current Composition: URTH vs ACWI
Historically, the geographic, market cap, and sector weights of URTH and ACWI have been extremely similar.
- The major difference is that URTH owns 100% developed markets, while ACWI owns 93% developed markets and 7% emerging markets (according to ETF.com, as of 11/30/2022).
- Even thought both ETFs are broad-based in terms of market capitalizations, both are market cap weighted and heavily tilted towards large-cap stocks.
- Additionally, the URTH and ACWI have nearly identical sector weights.
Geographic Exposure
ACWI stands for All Country World Index and so the ACWI ETF includes stocks from a broader set of countries than URTH. The primary difference is the inclusion and exclusion of emerging markets.
Below are the top five country weights of the two ETFs, as of 11/30/2022. Note that China is not included in URTH’s top holdings.
| URTH | ACWI | |
| United States | 68.90% | 61.23% |
| Japan | 5.95% | 5.30% |
| United Kingdom | 4.21% | 3.76% |
| China | 0.00% | 3.27% |
| Canada | 3.47% | 3.11% |
Market Cap Exposure
As of 10/31/2022, the market cap weights of the two ETFs is essentially identical. The small difference in mid-cap weights below is simply a result of rounding. However, both ETFs are market cap weighted, so they up both being large-cap ETFs.
| URTH | ACWI | |
| Large Cap | 84% | 84% |
| Mid Cap | 17% | 16% |
| Small Cap | 0% | 0% |
Sector Weights
As of 11/28/2022, the sector weights on the two ETFs are very similar.
| URTH | ACWI | |
| Basic Materials | 4.23% | 4.76% |
| Consumer Cyclical | 10.12% | 10.34% |
| Financial Services | 15.54% | 16.22% |
| Real Estate | 2.72% | 2.71% |
| Communication Services | 6.60% | 6.97% |
| Energy | 5.66% | 5.64% |
| Industrials | 10.68% | 10.12% |
| Technology | 19.14% | 19.14% |
| Consumer Defensive | 8.03% | 7.87% |
| Healthcare | 14.29% | 13.21% |
| Utilities | 3.00% | 3.03% |
Final Thoughts: URTH vs ACWI
URTH has outperformed ACWI by a healthy margin over the past 10 years. This is likely the result of emerging markets’ underperformance relative to the US and other developed markets, since ACWI owns emerging markets and URTH does now. So investors who want the marginal risk and return of emerging markets should consider ACWI, while those looking for a standalone developed market solution may be better off with URTH.
Of course, the past 10 years is a very short timeframe and what’s done well recently may not do well in the future. If we look under the hood and evaluate these ETF’s benchmark indices, we can look at an additional 25+ years of performance. Investors who read my review of MSCI World Index vs MSCI ACWI Index will see that the long-term performance of the underlying indices has been incredibly close.