VEU and VT are two of the largest ETFs and popular building blocks for many portfolios. My personal opinion is that these two ETFs are like apples and oranges and should not be compared against one another. However, many people request a comparison of these two funds, so I will write a post about VEU vs VT.
VT is benchmarked to the FTSE Global All-Cap Index, while VEU is benchmarked to the namesake FTSE All-World ex-US Index. When comparing VEU vs VT, it is clear that the biggest difference is that VEU excludes the US while VT includes it. A secondary difference is that VT has way more holdings and has more market cap coverage.
A quick reminder that this site does NOT provide investment recommendations.
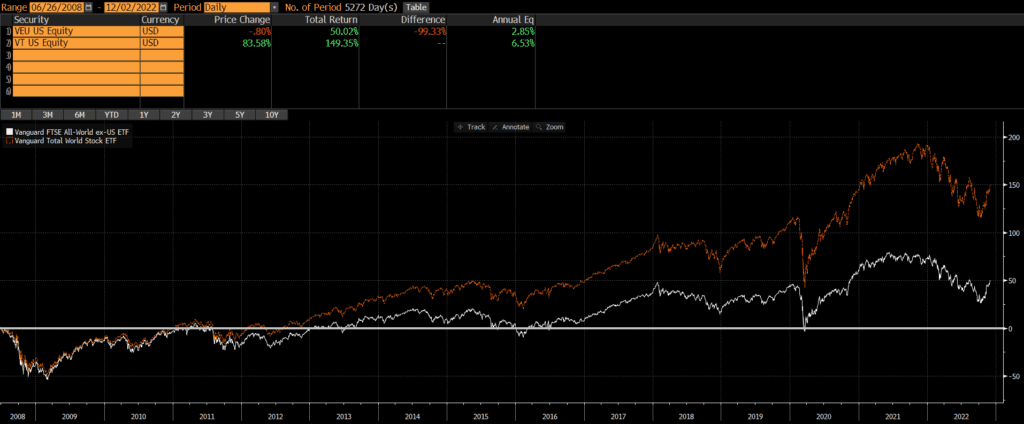
Historical Performance: VEU vs VT
VEU was launched on March 8, 2007, while VT was launched a year later on June 24, 2008. Since then, VT has trounced VEU by over 3.5% annually. The reason for this is simply that VEU excludes US stocks and US stocks have outperformed non-US stocks by a wide margin, during this time period. We don’t have to split hairs or run complex attribution analyses for this comparison.
Differences between VEU and VT
The biggest difference between VEU and VT is that VT includes stocks from the US. As VEU’s name (the Vanguard FTSE All-World ex-US) implies, it excludes stocks from the US.
A second major difference is that VT is more of a total market fund than VEU. VT has 9,548 stocks, while VEU “only” has 3,720 stocks (as of 10/31/2022).
Geographic Exposure
Country Exposure
VEU excludes US stocks, while VT includes US stocks. Consequently, the top five country weights are materially different (data as of 10/31/2022).
| VT | VEU | |
| United States | 61.7% | 0.0% |
| Japan | 5.9% | 15.5% |
| United Kingdom | 3.9% | 10.1% |
| Canada | 3.1% | 7.3% |
| China | 2.7% | 7.2% |
Market Classification
Both ETFs include emerging markets, but VEU’s exclusion of US stocks results in a much higher allocation to emerging markers.
| VT | VEU | |
| Developed Markets | 90.5% | 74.1% |
| Emerging Markets | 9.50% | 24.9% |
Market Cap Exposure
VT covers more mid- and small-cap stocks primarily since it has more than double the number of stocks, as of 10/31/2022.
| VT | VEU | |
| Large-Cap | 75% | 84% |
| Mid-Cap | 20% | 15% |
| Small-Cap | 6% | 0% |
Sector Weights
There are some notable differences in sector exposure when comparing VT vs VEU. As the table below shows, the sector weightings of the two differs a bit as of 10/31/2022.
| VT | VEU | |
| Basic Materials | 4.79% | 8.18% |
| Consumer Cyclical | 10.74% | 10.62% |
| Financial Services | 16.01% | 20.49% |
| Real Estate | 3.43% | 2.79% |
| Communication Services | 6.38% | 5.77% |
| Energy | 5.72% | 6.39% |
| Industrials | 10.94% | 13.14% |
| Technology | 18.76% | 10.84% |
| Consumer Defensive | 7.31% | 8.59% |
| Healthcare | 12.90% | 9.99% |
| Utilities | 3.02% | 3.20% |
Final Thoughts: VEU vs VT
As readers can see, these two ETFs are quite different. I would not even compare them on this site, except that differentiating between them is a common question. VT is a global solution, while VEU specifically fills the need for non-US exposure.
The decision for investors should be an easy one. Those who want a total global market solution should consider VT, while those who want to manage their US and non-US allocations separately should look at VEU. A more appropriate comparison might be comparing VXUS vs VEU or comparing VT to another total global market ETF. Investors looking for a mutual fund version of VEU should read our comparison of VEU vs VFWAX.