The Vanguard Total International Stock ETF (symbol: VXUS) and the Vanguard FTSE All-World ex-US ETF (symbol: VEU) are two popular and relatively large ETFs, covering a majority of the world’s non-US investable stocks. VXUS is benchmarked to the FTSE Global All-Cap Index ex-US, while VEU is benchmarked to the namesake FTSE All-World ex-US Index. When comparing VEU vs VXUS, it is important to be aware of the similarities, differences, and understand whether these differences are material to a portfolio.
The primary difference between VEU and VXUS is that VXUS has broader market coverage than VEU. However, performance is fairly similar, as is sector and geographic exposure.
A quick reminder that this site does NOT provide investment recommendations.
Historical Performance: VEU vs VXUS
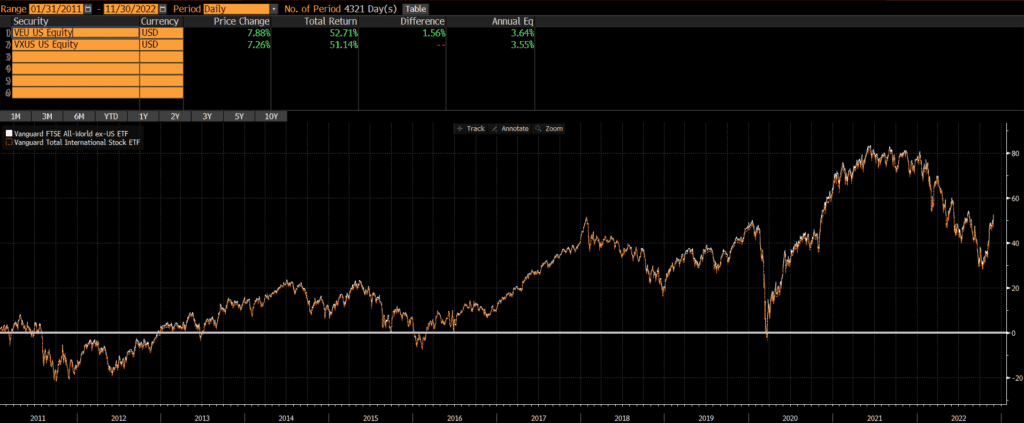
VEU was launched on March 8, 2007, while VXUS was launched on January 28, 2011. So we can compare performance of the two back to VXUS’ inception date. Those interested in looking back further should compare the underlying benchmarks and can read our post about the FTSE Global All-Cap Index ex-US vs FTSE All World ex-US Index.
Since their common inception, the two ETFs have performed nearly identically with a difference of only .09% annually!
Differences between VEU and VXUS
Both ETFs are benchmarked to indices provided by FTSE and they are nearly identical in many respects. The primary difference is that VXUS is more of a total market fund than VEU. VXUS has 7,985 stocks, while VEU “only” has 3,720 stocks (all data as of 10/31/2022)
Geographic Exposure
Country Exposure
Both VEU and VXUS exclude US stocks. The top five country weights are identical and the weightings are very close too. Data as of 10/31/2022.
| VXUS | VEU | |
| Japan | 15.3% | 15.5% |
| United Kingdom | 10.2% | 10.1% |
| Canada | 8.1% | 7.3% |
| China | 7.1% | 7.2% |
| France | 6.5% | 6.8% |
Market Classification
The only difference in developed and emerging market exposure when comparing VXUS vs VEU seems to be a rounding error!
| VXUS | VEU | |
| Developed Markets | 75.0% | 74.1% |
| Emerging Markets | 25.0% | 24.9% |
Market Cap Exposure
VXUS covers more mid- and small-cap stocks primarily since it has more than double the number of stocks, as of 10/31/2022.
| VXUS | VEU | |
| Large-Cap | 76% | 84% |
| Mid-Cap | 19% | 15% |
| Small-Cap | 5% | 0% |
Sector Weights
The market cap differences do not translate into any material differences in sector exposure. As the table below shows, the sector weightings of the two indices are nearly identical as of 10/31/2022.
| VXUS | VEU | |
| Basic Materials | 8.44% | 8.18% |
| Consumer Cyclical | 10.77% | 10.62% |
| Financial Services | 19.66% | 20.49% |
| Real Estate | 3.48% | 2.79% |
| Communication Services | 5.53% | 5.77% |
| Energy | 6.27% | 6.39% |
| Industrials | 13.67% | 13.14% |
| Technology | 11.09% | 10.84% |
| Consumer Defensive | 8.14% | 8.59% |
| Healthcare | 9.68% | 9.99% |
| Utilities | 3.27% | 3.20% |
Final Thoughts: VEU vs VXUS
These two ETFs are quite different in some ways, but not in ways that matter very much. VXUS is a much broader ETF than VEU (with more than double the number of holdings!). However, due to the market cap weighting methodology of both indices, the additional holdings do materially impact the geographic exposure, sector weights, or performance. This is very similar to the dynamic we find with the Russell 1000 and Russell 3000 where one index is essentially a subset of another.
These two ETFs are very similar and performance since inception has been very close. Trading liquidity and tax impact may be more consequential than differentials in ETF performance. Personally, I view these two ETFs as interchangeable in a portfolio and would spend my time on higher-value activities rather than determining which of these two ETFs is better.
Further Reading
Readers curious to learn about Vanguard’s mutual fund version of VEU, may want to read our comparison of VEU vs VFWAX.