The Russell 1000, 2000, and 3000 are three of the most popular indices of US stocks. Many portfolios and investment vehicles are benchmarked to each index. The Russell 1000 is composed of mostly large-cap stocks, while the Russell 2000 is composed of mostly small-cap stocks. The Russell 3000 is more of a total market index, which includes large caps, mid caps, and small caps.
A quick note investors cannot invest directly in an index. These unmanaged indexes do not reflect management fees and transaction costs that are associated with an investable vehicle. Examples include the iShares Russell 1000 ETF (symbol: IWB), the iShares Russell 2000 ETF (symbol: IWM), or the iShares Russell 3000 ETF (symbol: IWV). A reminder that these are simply examples as this site does NOT provide investment recommendations.
Difference Between Russell 1000, Russell 2000, and Russell 3000
Fortunately, FTSE Russell (the provider of the Russell indices) makes it fairly simply to understand the differences between the Russell 3000, 2000, and 1000.
Russell 3000
The Russell 3000 represents the 3,000 US stocks with the largest market caps. So it is a very broad index that covers most stocks in the US, although some microcap stocks do not make the cut. Interestingly, index inclusion is based purely on market capitalization and a webpage for the index notes: “Investors seeking to capture a strategy reflecting broad US equities performance can confidently choose the Russell 3000 knowing there are no subjective inclusions or exclusions of stocks.” This seems to be a not-so-veiled criticism of Standard & Poors, the index provider for the S&P 500 and other major indices that takes a more subjective committee-based approach. That being said, my analysis of the Russell 1000 vs S&P 500 performance did not find any differences over the past 30 years.
Russell 1000 and Russell 2000
Russell segments the Russell 3000 into two additional indices. The 1,000 stocks with the largest market caps constitute the Russell 1000, while the 2,000 stocks with the smallest market caps are the Russell 2000. The full methodology can be found on FTSE Russell’s website here.
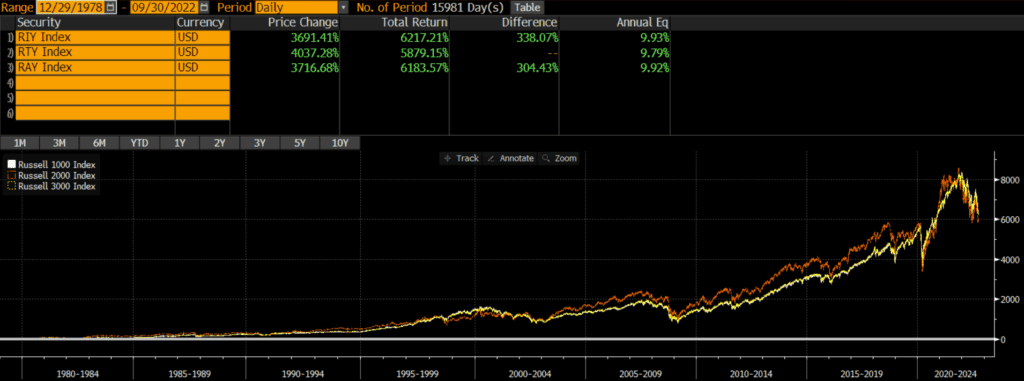
Historical Performance: Russell 1000 vs Russell 2000 vs Russell 3000
Surprisingly, the performance of all three indices is within .15% annually over the past 44 years! Looking at the Russell 1000 vs Russell 2000 vs Russell 3000 chart below, it is clear that the Russell 1000 and Russell 3000 have moved in lockstep. The Russell 2000’s performance has more volatile, both in absolute terms as well as relative to the Russell 1000 and Russell 3000 graphs. However, the Russell 2000 has more or less arrived at the same annualized performance (as of 2022).
Current Index Composition
The near-identical performance over the past two decades is not surprising when looking at the current index compositions. As of 9/30/2022, the geographic, market cap, and sector weights are nearly identical.
Geographic Exposure
The Russell 3000 (and its component Russell 1000 and Russell 2000 indices) only includes stocks of US-based companies.
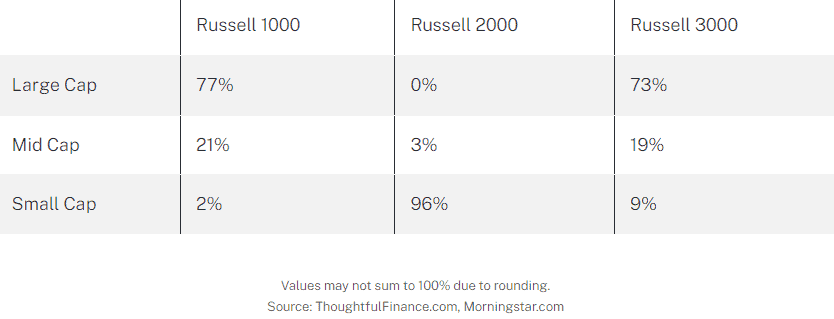
Market Cap Exposure
As mentioned above, the Russell 1000 represents the larger stocks of the Russell 3000 and the Russell 2000 represents the smaller stocks of the Russell 3000. However, since these are cap-weighted indices, the Russell 3000 ends up being closer to a large-cap index even though it contains small caps. This explains the near-identical performance of the Russell 1000 and Russell 3000.
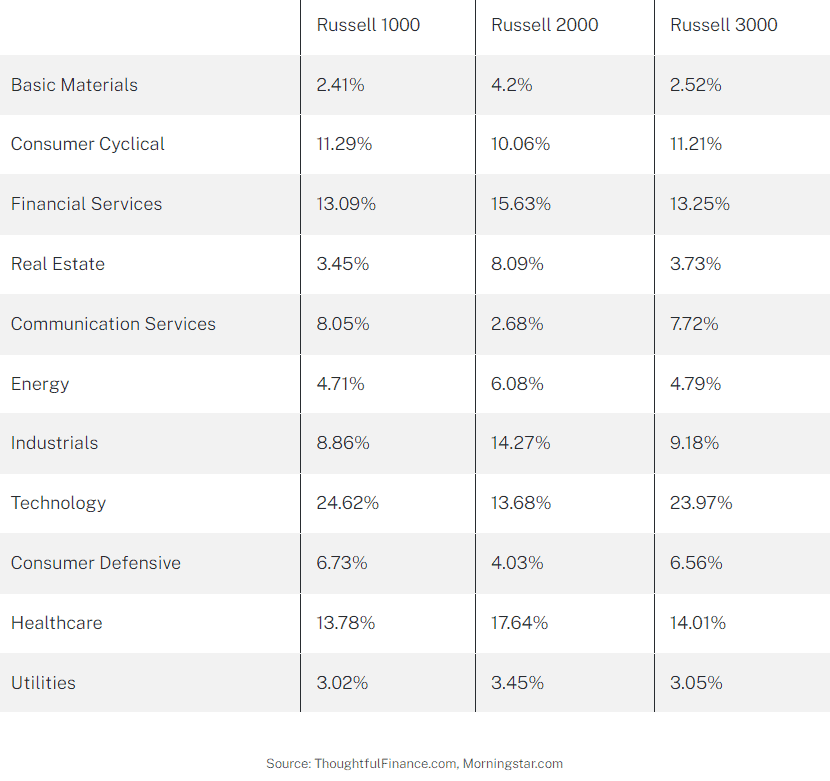
Sector Weights
Looking at the sector weightings of the respective indices, we see a similar theme. The Russell 1000 and Russell 3000 have similar sector weights, while the Russell 2000 has some notable differences.
Final Thoughts
In my view, the Russell 1000 and Russell 3000 are equivalent and interchangeable. Yes, the Russell 3000 is more diversified in that it has more stocks, but the performance has been identical for 44 years. If it walks like a duck and talks like a duck… The Russell 2000 is obviously different which is plain to see for anyone looking at a chart of the Russell 1000 vs Russell 2000 vs Russell 3000.
The question I see many allocators face is whether to simply own the total market (something benchmarked to the Russell 3000) versus splitting equity allocations into large-cap and small-cap components. My thought is that if an investor is going to hold large-caps and small-caps at their market cap weights, then go for a total market benchmark. However, if an investor wants to overweight or underweight large-caps or small-caps, then they should divide the equity allocation.
Investors cannot invest in indices directly and should do their own research before deciding to invest in a strategy that tracks any of these indices. Investors should focus their research on details like expenses, overall costs, tracking error, and so on. These factors are especially important when evaluating something benchmarked to the Russell 2000 or Russell 3000 since small-caps stocks can be notoriously illiquid.
Further Reading
The Russell indices take a similar approach as the NASDAQ indices, where the NASDAQ 100 is a subset of the NASDAQ Composite.
Investors looking for US large-cap exposure may also want to explore the MSCI USA Index or the S&P 500 Index.