The Russell 1000 and the S&P 500 are two of the most widely-followed indices of US large-cap stocks. The below charts of the Russell 1000 vs the S&P 500 illustrate that the S&P 500 has outperformed the Russell 1000 by a wide margin since its inception. However, returns over the past 30 years have been identical.
A quick note investors cannot invest directly in an index. These unmanaged indexes do not reflect management fees and transaction costs that are associated with an investable vehicle, such as the iShares Russell 1000 ETF (symbol: IWB) or the State Street SPDR S&P 500 Index Trust (symbol: SPY). A reminder that these are simply examples as this site does NOT provide investment recommendations.
Performance: Russell 1000 vs S&P 500 Historical Returns
When comparing the historical returns of the Russell 1000 and the S&P 500, it is important to note the timeframe. The performance of Russell 1000 vs S&P 500 graphs (below) look completely different during different timeframes. Since the Russell 1000’s inception in 1978, the S&P 500 has outperformed it by about 1.6% annually (through 9/30/2022).
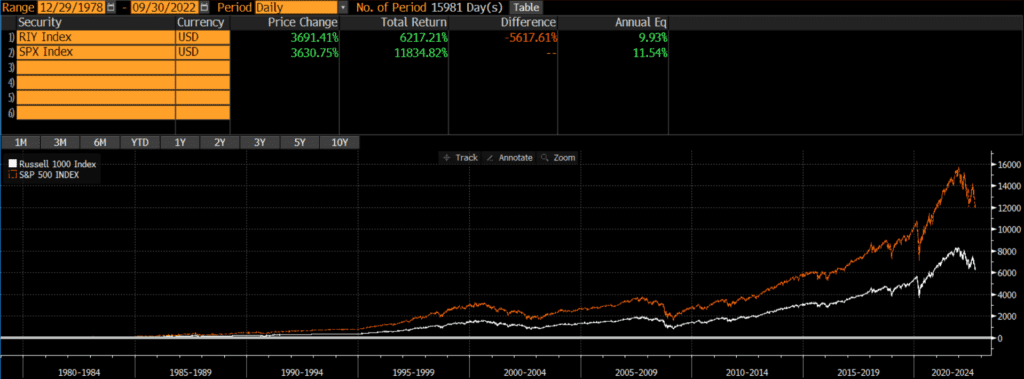
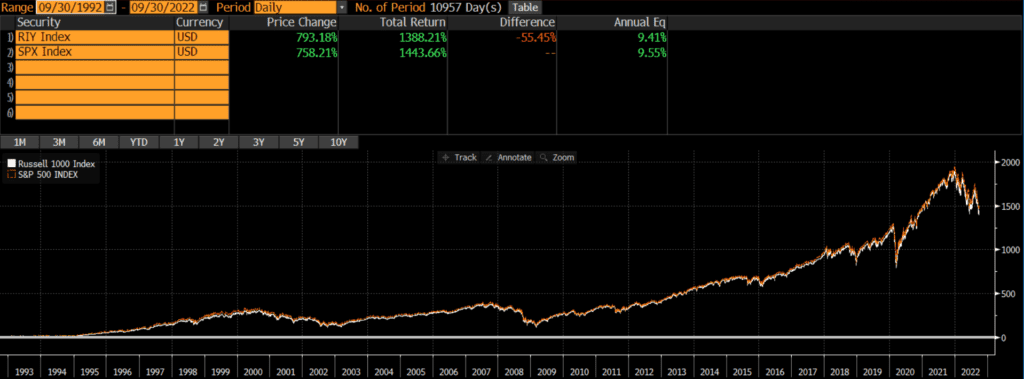
However, charts (and marketing materials) can be deceiving. If we look at the past 30 years, the S&P 500 outperformed the Russell 1000 and the performance difference has been less than .15% annually.
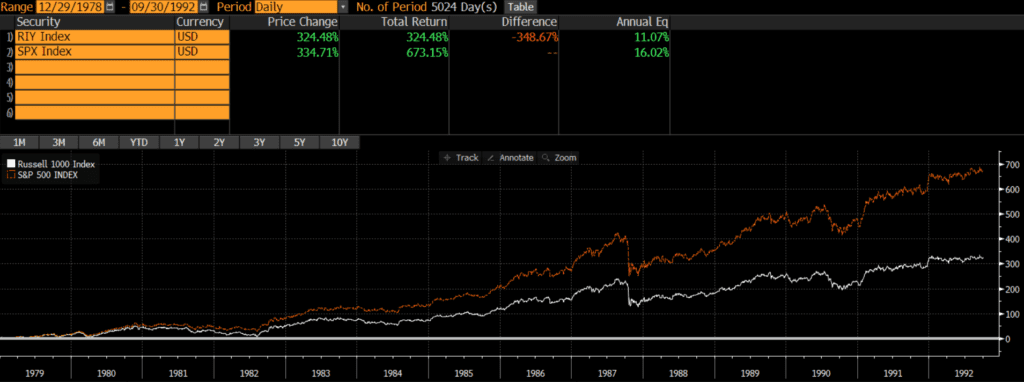
This implies that more than 100% of the S&P 500’s outperformance was generated between 1978 and 1993. Sure enough, the Russell 1000 vs S&P 500 chart (below) indicates that from inception to 9/30/1992, the S&P 500 outperformed the Russell 1000 by nearly 5% per year!
Current Index Composition
The near-identical performance over the past two decades is not surprising when looking at the current index compositions. As of 9/30/2022, the geographic, market cap, and sector weights are nearly identical.
Geographic Exposure
Both the Russell 1000 and the S&P 500 only include stocks of US-based companies.
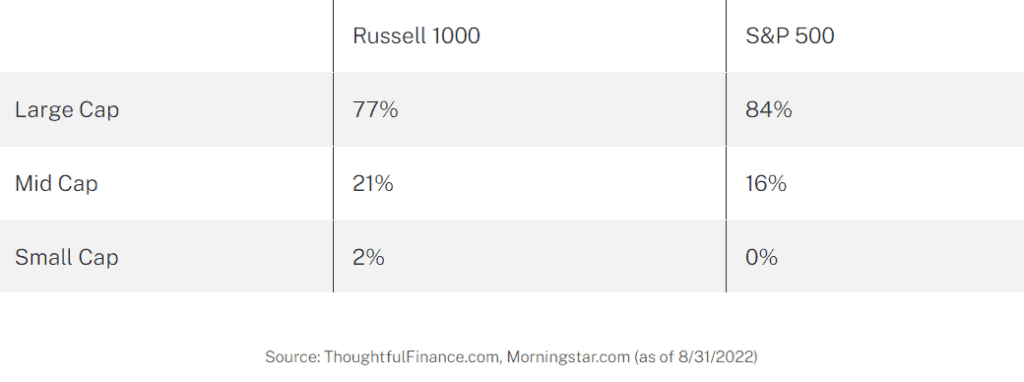
Market Cap Exposure
Both indices are primarily composed of large-cap stocks. However, since the Russell has twice as many stocks, it has slightly more mid cap constituents.
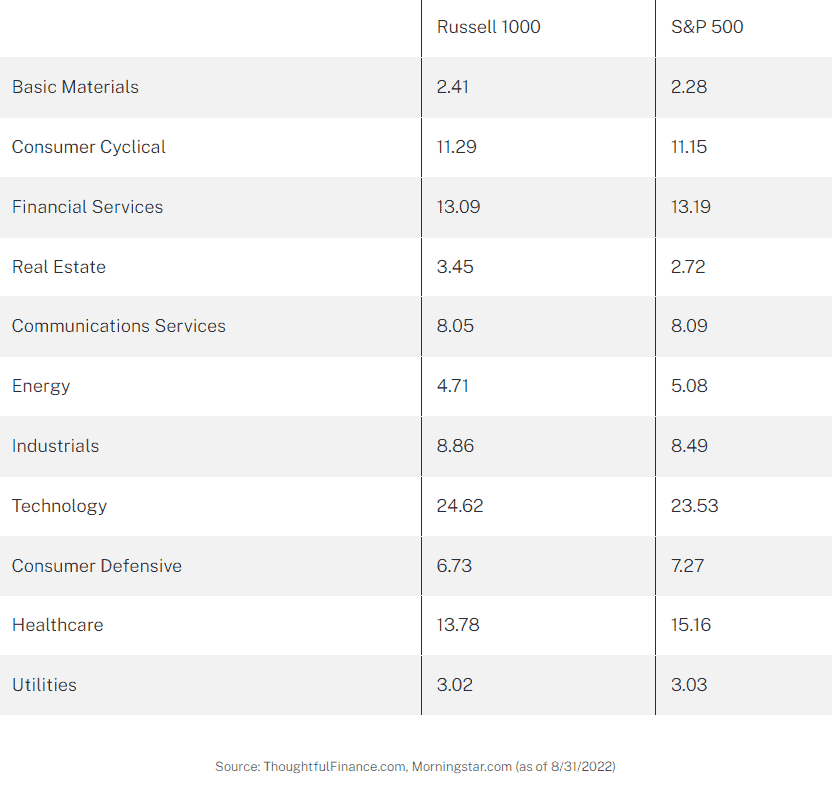
Sector Weights
The Russell 1000 and S&P 500 have nearly identical sector weightings.
Final Thoughts
In my view, these two indices are interchangeable. Yes, the S&P 500 trounced the Russell 1000 in the early years, but we’ve observed 30 years of near-identical performance.
Investors cannot invest in indices directly and should do their own research before deciding to invest in a strategy that tracks either index. Given the negligible performance difference in the indices, investors should focus their research on details like expenses, overall costs, tracking error, and so on.
Russell 1000 & S&P 500 Index Funds
As mentioned, these are two of the most widely followed indices. In fact, the three largest ETFs are S&P 500 index funds (as of 9/30/2022):
- State Street SPDR S&P 500 ETF Trust (symbol: SPY)
- iShares Core S&P 500 ETF (symbol: IVV)
- Vanguard S&P 500 ETF (symbol: VOO)
Two of the largest Russell 1000 index funds include:
- iShares Russell 1000 ETF (symbol: IWB)
- Vanguard Russell 1000 ETF (symbol: VONE)