The Nasdaq Composite Index and the Nasdaq 100 Index are two widely watched indices. Despite their popularity, people often confuse the two. “The NASDAQ” Composite Index is referred to in the news and displayed on websites/TV, while the NASDAQ 100 Index seems to be the benchmark for more investable funds and strategies. Despite their similar names, a comparison of the NASDAQ Composite vs NASDAQ 100 reveals some major differences.
The NASDAQ 100 and Composite have very different compositions, slightly different weights and exposures, and performance differences have reflected that.
A quick note that investors cannot invest directly in an index. These unmanaged indexes do not reflect management fees and transaction costs that are associated with an investable vehicle, such as the Fidelity NASDAQ Composite Index ETF (symbol: ONEQ) or the Invesco NASDAQ 100 ETF (symbol: QQQ). Readers who want to compare these investment vehicles rather than these indices should check out our ETF comparison of ONEQ vs QQQ.
A reminder that these are simply examples as this site does NOT provide investment recommendations.
Historical Performance: NASDAQ 100 vs NASDAQ Composite
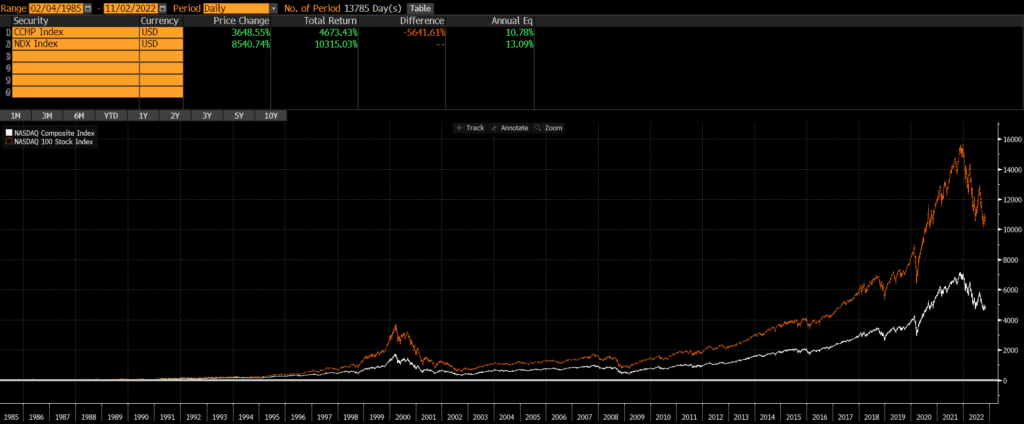
The NASDAQ Composite Index is much older with an inception date of 1970. The NASDAQ 100 Index was launched 15 years later in 1985. Since that time, the NASDAQ 100 has outperformed the NASDAQ Composite by a wide margin.

I reviewed NASDAQ Composite vs NASDAQ 100 charts from different timeframes and found the same results. The Composite has generally performed equal to or better than the 100 over all of the timeframes that I examined.
Differences between NASDAQ Composite and NASDAQ 100
Overall, the two indices are very similar, since they are both based on the same universe of stocks. The Composite includes all securities listed on the NASDAQ exchange (over 3,700 as of Q3 2022!) , while the NASDAQ 100 includes the largest 100 stocks (technically 103 as of Q3 2022) after excluding financial stocks. The NASDAQ site publishes the index methodologies for both the Composite and 100.
Geographic Exposure
Substantially all (95%+) of each index is composed of US-based companies, so I will not include the usual tables of countries, market classification, and so on.
Market Cap Exposure
The NASDAQ 100 in composed of the 100 largest stocks on the NASDAQ exchange (excluding financials), so it has a much larger weighting to large-caps than the Composite. However, both indices use methodologies based on market-cap weighting, so large-caps dominate each index.
Below is an estimate of the market cap exposure as of 9/30/2022.

Sector Weights
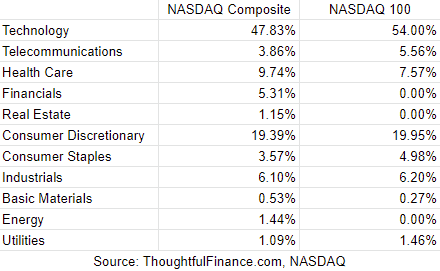
Given that the NASDAQ Composite is a much broader index versus the NASDAQ 100, it is not surprising that the Composite covers more sectors and is less concentrated that the 100. Below are the sector weightings of the two indices, as of 11/2/2022.

Final Thoughts
Despite “The NASDAQ” Composite’s popularity, there are relatively few investment vehicles benchmarked to it, so many investors may just default to the NASDAQ 100 because its easier. This reminds of “The Dow” Jones Industrial Average which seems to be more popular with the general public, but is dwarfed by the S&P 500 in terms of benchmark use. Investors cannot invest in indices directly and should do their own research before deciding to invest in a fund that tracks either index.
Further Reading
Investors looking for large-cap exposure in the US may also want to consider the Russell 1000 or the S&P 500 or even the MSCI USA Index.
An international example of a widely followed index without a ton a vehicles benchmarked to it is the MSCI World ex-USA Index, while pales in comparison to the MSCI ACWI ex-USA Index.