The FTSE Global Cap Index and the FTSE All World Index are two global indices, covering a majority of the world’s investable stocks. Many investment strategies and vehicles benchmark to either one of these indices. FTSE Global All Cap covers many more constituents and market caps than the FTSE All World, but there is little difference in performance.
A quick note that investors cannot invest directly in an index. These unmanaged indexes do not reflect management fees and transaction costs that are associated with an investable vehicle, such as the Vanguard Total World Stock ETF (symbol: VT) or the Vanguard FTSE All-World UCITS ETF (symbol: VWRL) which is available in the UK. Interestingly the former fund (VT) changed benchmarks from the FTSE All-World Index to the FTSE Global All Cap Index in 2011. A reminder that these are simply examples as this site does NOT provide investment recommendations.
Historical Performance: FTSE Global All-Cap vs FTSE All World
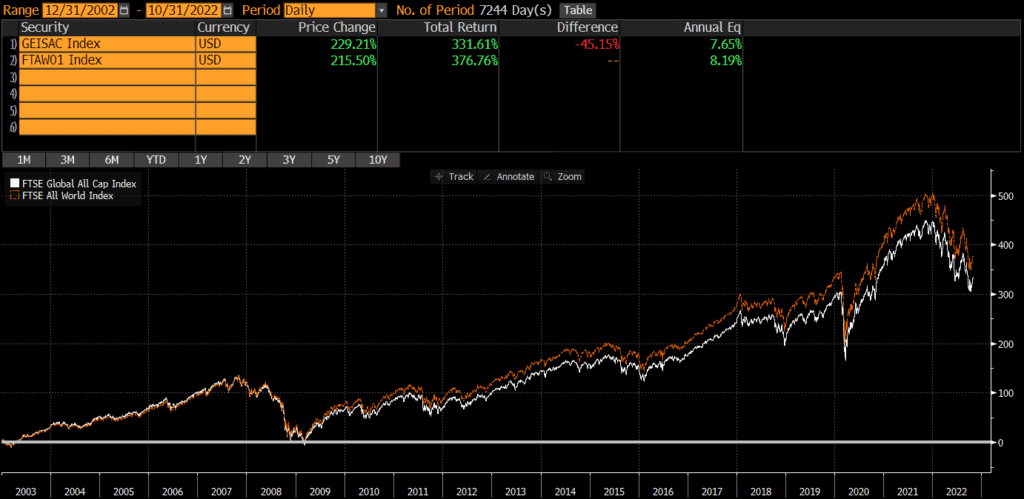
Both indices were launched in the early 2000s. Since the FTSE Global All Cap Index’s launch, it has trailed the FTSE All-World Index by nearly .50% annually. Not a huge amount, but it has added up over time.
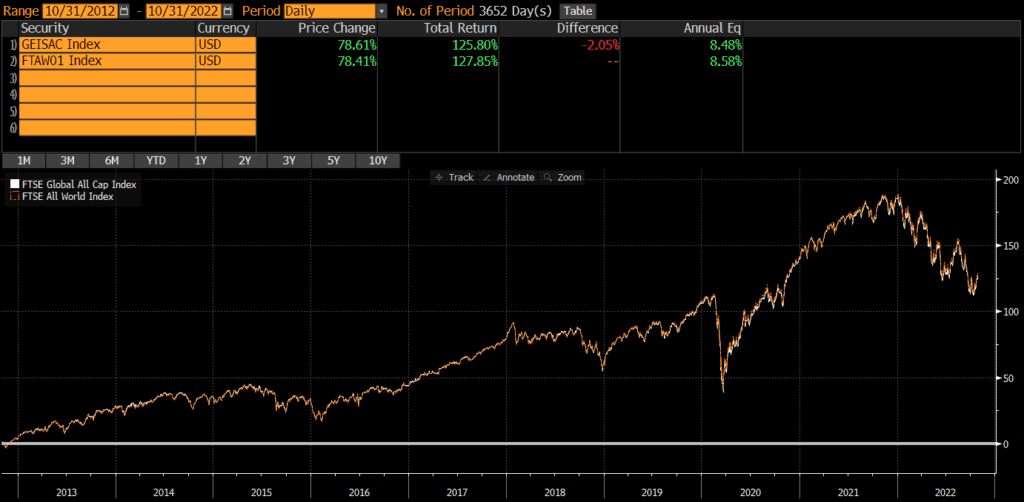
Readers know that I like to examine different time periods as the results often change. Sure enough, the FTSE Global All-Cap vs FTSE All World chart shows performance is nearly identical. Over the past 10 years, the All-World has only outperformed by .10% annually.
Differences between FTSE Global All-Cap vs FTSE All World
These two indices are both provided by FTSE and they are nearly identical in many respects. The primary difference is that the Global All-Cap is more of a total market index. The Global All-Cap has 9,527 constituents, while the All World “only” has 4,172 constituents (all data as of 9/30/2022)
Geographic Exposure
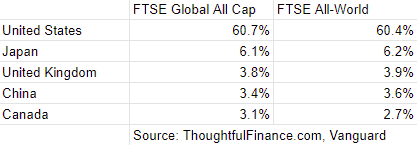
Country Exposure
The top five countries are identical and even the weights are nearly identical, as of 9/30/2022.
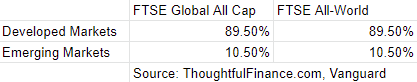
Market Classification
The market classification split between developed and emerging markets is also identical! Data as of 9/30/2022.
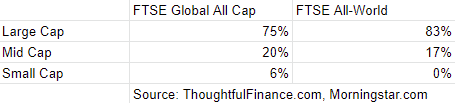
Market Cap Exposure
Interestingly, the market cap data reveals some differences. As its name suggests, the FTSE Global All Cap covers more mid- and small-cap stocks (as of 9/30/2022)
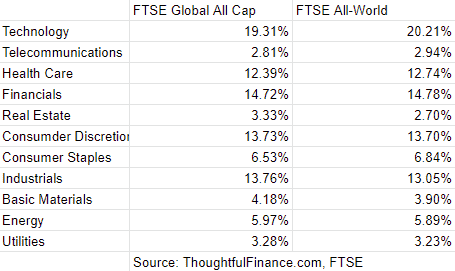
Sector Weights
The sector weights between the two indices are also nearly identical, as of 9/30/2022.
Final Thoughts
These two indices are quite different in some ways, but not in ways that matter very much. The FTSE Global All-Cap is a much broader index than the FTSE All World (with more than double the number of constituents!). However, these indices are market-cap weighted, so the thousands of additional constituents does materially impact the geographic exposure, sector weights, or performance. This is very similar to the dynamic we find with the Russell 1000 and Russell 3000.
If I was deciding between these two indices as a benchmark, I’d be indifferent. That being said, US investors will be hard-pressed to even find a fund benchmarked to the FTSE All World. So the FTSE Global All-Cap may be the default choice in the US. For investors in the UK and other regions with both choices, factors like expenses, fees, taxes, and liquidity in small cap names (which the Global All-Cap owns a lot of!) may be the deciding factors. These factors are likely much more important than performance, since the two indices have very similar performance. Investors cannot invest in indices directly and should do their own research before deciding to invest in a fund that tracks either index.
Further Reading
Investors looking for global exposure from a non-FTSE index may want to look at the MSCI World or MSCI ACWI.
Of course, readers can also compare the differences between the FTSE Global All-Cap and MSCI ACWI.