The FTSE Global All Cap ex US Index and the FTSE All World ex US Index are two international stock indices, covering a majority of the world’s non-US investable stocks. Many investment strategies and vehicles benchmark to either one of these indices. The primary difference between the FTSE Global All-Cap ex US vs FTSE All World ex US is that the Global All Cap ex US Index broader than the All World ex US. However, performance is fairly similar, as is sector and geographic exposure.
A quick note that investors cannot invest directly in an index. These unmanaged indexes do not reflect management fees and transaction costs that are associated with an investable vehicle, such as the Vanguard FTSE All-World ex-US ETF (symbol: VEU) or the Vanguard Total International Stock ETF (symbol: VXUS). A reminder that these are simply examples as this site does NOT provide investment recommendations.
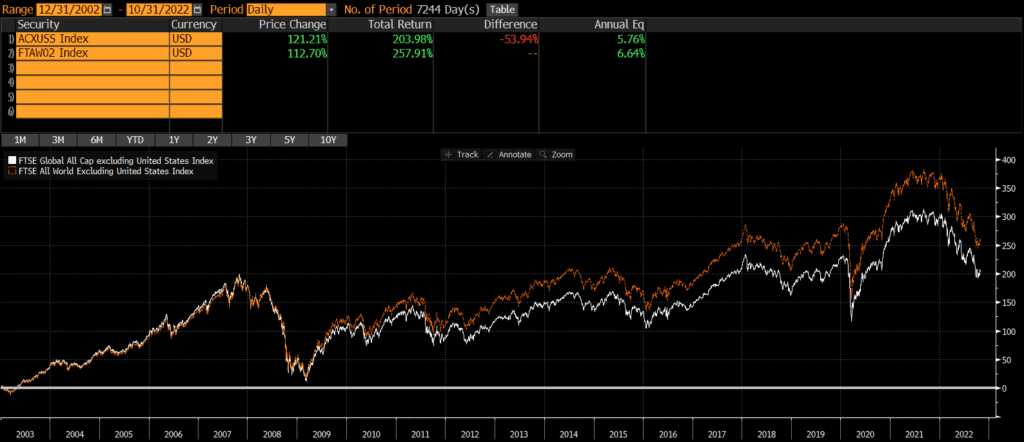
Historical Performance: FTSE Global All-Cap ex US vs FTSE All World ex US
Both indices were launched in the early 2000s. Since the FTSE Global All Cap ex US Index’s launch, it has trailed the FTSE All-World ex US Index by nearly .90% annually.
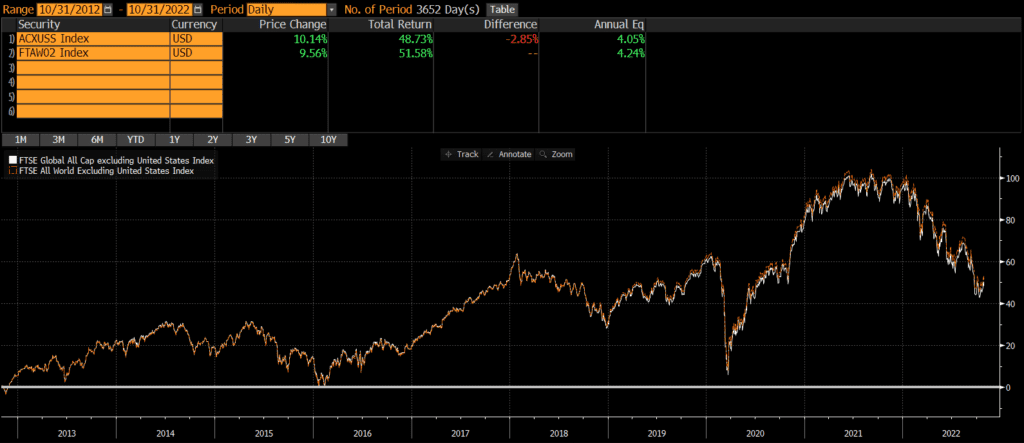
However, when comparing the FTSE Global All-Cap ex US vs FTSE All World ex US over the past 10 years, then the performance differential narrows to less than .20% annually. The FTSE All World ex US still outperforms the FTSE Global All-Cap ex US, but the chart shows performance is pretty close.
Differences between FTSE Global All-Cap ex US and FTSE All World ex US
These two indices are both provided by FTSE and they are nearly identical in many respects. The primary difference is that the Global All Cap ex US is more of a total market index. The Global All-Cap ex US has 7,719 constituents, while the All-World ex US “only” has 3,563 constituents (all data as of 9/30/2022)
Geographic Exposure
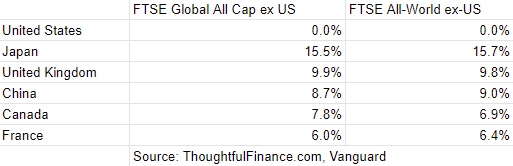
Country Exposure
As their names imply, each index excludes US stocks. The top five countries are identical and the weightings are very close too. Data as of 9/30/2022.
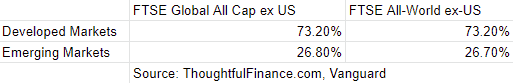
Market Classification
The only difference in developed and emerging market exposure when comparing FTSE Global All-Cap ex US vs FTSE All World ex US seems to be a rounding error!
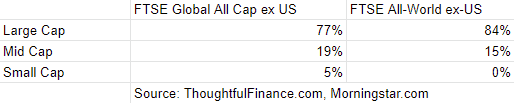
Market Cap Exposure
As its name suggests, the FTSE Global All Cap ex US covers more mid- and small-cap stocks primarily since it has more than double the number of constituents, as of 9/30/2022.
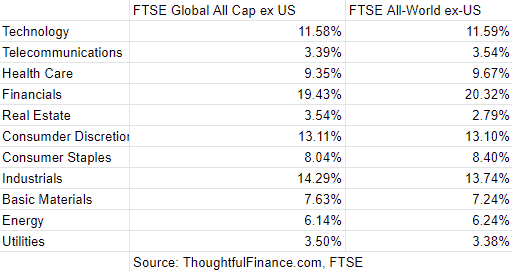
Sector Weights
The market cap differences do not translate into any material differences in sector exposure. As the table below shows, the sector weightings of the two indices are nearly identical as of 9/30/2022.
Final Thoughts
These two indices are quite different in some ways, but not in ways that matter very much. The FTSE Global All-Cap ex-USA Index is a much broader index than the FTSE All World ex-USA Index (with more than double the number of constituents!). However, due to the market cap weighting methodology of both indices, the additional constituents do materially impact the geographic exposure, sector weights, or performance. This is very similar to the dynamic we find with the Russell 1000 and Russell 3000 where one index is essentially a subset of another.
These two indices are very similar and recent performance has very close. Investment vehicle details like expenses, fees, taxes, and liquidity in small cap names (which the Global All-Cap ex US owns a lot of!) may be more consequential than differentials in index performance. Investors cannot invest in indices directly and should do their own research before deciding to invest in a fund that tracks either index.
Further Reading
Investors looking for global exposure that includes the US may want to read our comparison of these indices’ parents, the FTSE Global All Cap Index and FTSE All World Index.
Of course, readers can also compare the differences between the flagship MSCI “ex-USA” indices, the MSCI ACWI ex-USA and MSCI World ex-USA.