The MSCI World ex-USA Index and the MSCI ACWI ex-USA Index may sound very similar, but they are quite different. MSCI ACWI ex-USA is fairly popular index, while the MSCI World ex-USA is relatively unknown. When comparing MSCI ACWI ex-USA vs MSCI World ex-USA, the primary difference is that ACWI ex-USA includes emerging market stocks while World ex-USA does not. This is consistent with the ACWI and World parent indices (which include the USA).
A quick note that investors cannot invest directly in an index. These unmanaged indexes do not reflect management fees and transaction costs that are associated with an investable vehicle, such as the iShares ACWI ex-USA ETF (symbol: ACWX). A reminder that these are simply examples as this site does NOT provide investment recommendations.
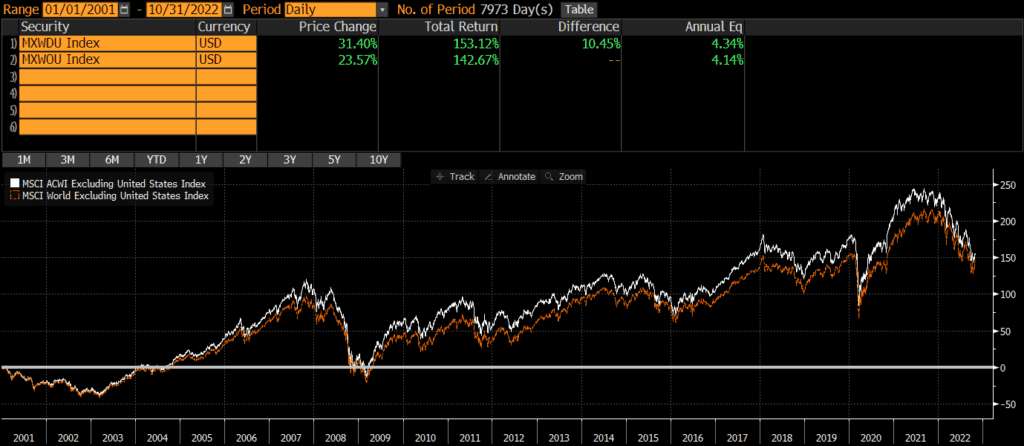
Historical Performance: MSCI World ex-USA vs MSCI ACWI ex-USA
Since the MSCI ACWI ex-USA Index’s inception in 2001, it has outperformed by an ever-so-slight .20% annually. Given that the primary difference between the indices is their exposure to emerging markets, it is no surprise that ACWI ex-USA outperformed during the first decade.
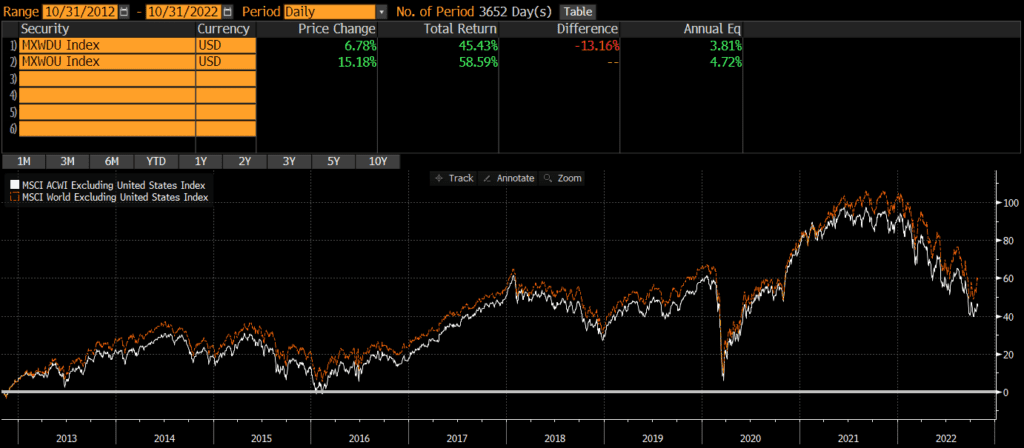
Given that emerging markets have underperformed for the last decade, it is no surprise that the MSCI ACWI ex-USA vs MSCI World ex-USA chart of the last 10 years indicates the reverse. Over this time period, the MSCI World ex-USA has outperformed by nearly 1% per year.
Current Index Composition: MSCI ACWI ex-USA vs MSCI World ex-USA
The main difference between the two indices is their inclusion/exclusion of emerging markets. However, the market cap exposure and sector weights are fairly similar, which partially explains why performance has been so similar.
Geographic Exposure
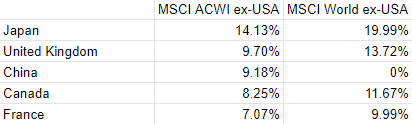
ACWI stands for All Country World Index and so the MSCI ACWI ex-USA includes stocks from a broader set of countries than the World ex-USA Index. The primary difference is the inclusion and exclusion of emerging markets.
Below are the top five country weights of the two indices, as of 9/30/2022. Note that China is not included in the World ex-USA’s top holdings.
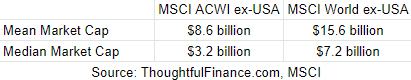
Market Cap Exposure
The ACWI ex-USA is a much broader index with 2,274 constituents vs World ex-USA’s 887 constituents (as of 9/30/2022). Not surprisingly, the mean and median market cap of ACWI ex-USA constituents is roughly half of World ex-USA’s. However, both indices are market cap weighted, so they up both being large-cap indices (which helps explain their very similar performance).
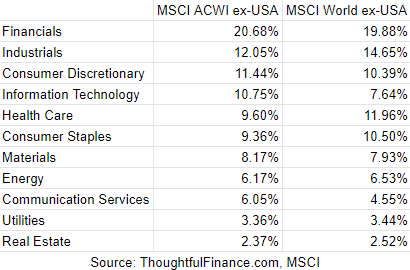
Sector Weights
As of 9/30/2022, the sector weights on the two indices are very similar.
Concluding Thoughts
Investors cannot invest in indices directly and should do their own research before deciding to invest in a strategy that tracks either index. Below are a my personal thoughts on this comparison of MSCI World ex-USA vs MSCI ACWI ex-USA:
- The comparison might not even matter that much, since the MSCI World ex-USA Index is not a common benchmark. This is reminiscent of the NASDAQ Composite Index, which is widely followed but has relatively few vehicles benchmarked to it (versus the NASDAQ 100)
- Selecting the MSCI ACWI ex-USA Index over the MSCI World ex-USA Index is simply a bet on emerging markets. That is main difference between the indices as the other weights and exposures are quite similar.
- The performance differences have not been that wide and the resources used to select the “best” benchmark might be better spent on considering differences in the investment strategy (such as expenses, transaction costs, tax efficiency, and so on.
Further Reading
Investors who want to evaluate non-MSCI global indices may want to read my comparison of the FTSE Global All Cap ex US vs FTSE All World ex US indices.
Investors who want a global benchmark with US exposure should read my comparison of the MSCI ACWI vs MSCI World (the parent indices of the two compared in this post) or my comparison of the FTSE Global All Cap Index vs MSCI ACWI.