The MSCI USA index and the S&P 500 are two of the most popular indices of US stocks. Many portfolios and investment vehicles are benchmarked to each index as both are representative of the US stock market.
These two indices are nearly identical in every respect. The below charts of the MSCI USA vs S&P 500 performance illustrate that the S&P 500 has outperformed the MSCI USA by since its inception. However, returns over the past 25 years have been nearly identical. This is extremely similar to the findings in my analysis of the Russell 1000 vs S&P 500.
A quick note that investors cannot invest directly in an index. These unmanaged indexes do not reflect management fees and transaction costs that are associated with an investable vehicle, such as the Invesco PureBeta MSCI USA ETF (symbol: PBUS) or the iShares Core S&P 500 ETF (symbol: IVV). A reminder that these are simply examples as this site does NOT provide investment recommendations.
Historical Performance: MSCI USA Index vs S&P 500
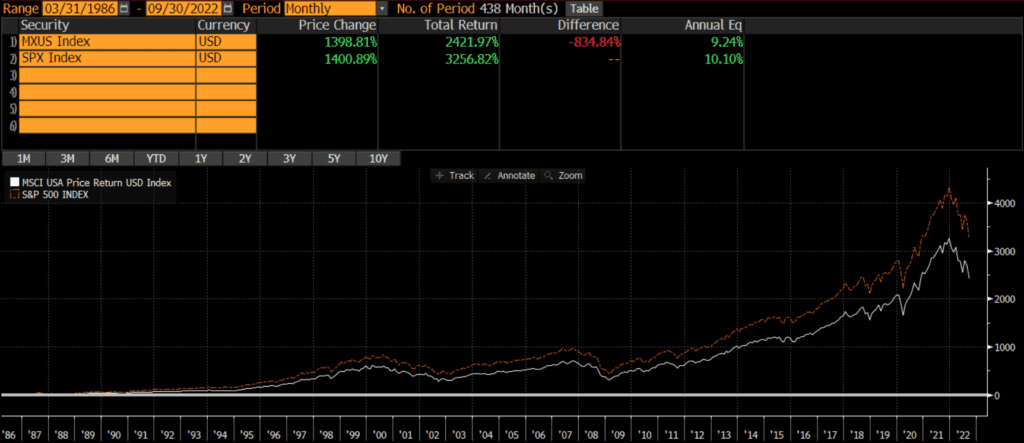
Similar to my analysis of the Russell 3000 vs S&P 500, the time period is very important when evaluating the performance of the MSCI USA Index vs S&P 500. The below chart of the MSCI USA Index vs S&P 500 shows that the S&P 500 outperformed the MSCI USA index by about 85 basis points annually (since inception on 3/31/1986).
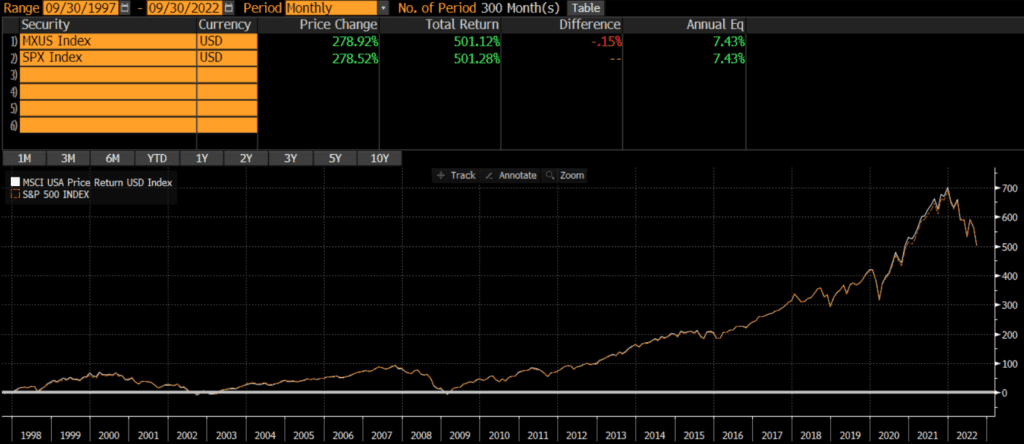
However, it is a completely different story if we graph the MSCI USA Index vs S&P 500 over the past 25 years (as shown in the below chart). The two indices have performed identically (down to the basis point!) at 7.43% annually.
Composition Differences: MSCI USA vs S&P 500
Both the MSCI USA Index and the S&P 500 are broad-based indices that represent the US equity markets. As of Q3 2022, the indices have identical geographic exposures, similar sector weights, and slightly different market cap exposures.
Geography
Both the MSCI USA Index and the S&P 500 only include the stocks of US-domiciled companies.
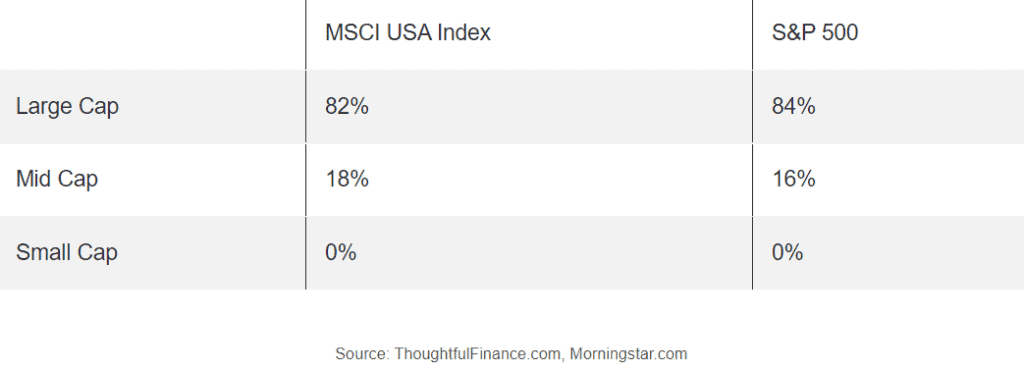
Market Capitalization
The two indices have a similar number of constituent stocks; the MSCI USA has 626 constituents versus the S&P’s 500 companies. Consequently, the MSCI USA has marginally more mid-cap exposure, but it is not a material difference. Both indices are market-cap weighted, so the composition is largely similar.
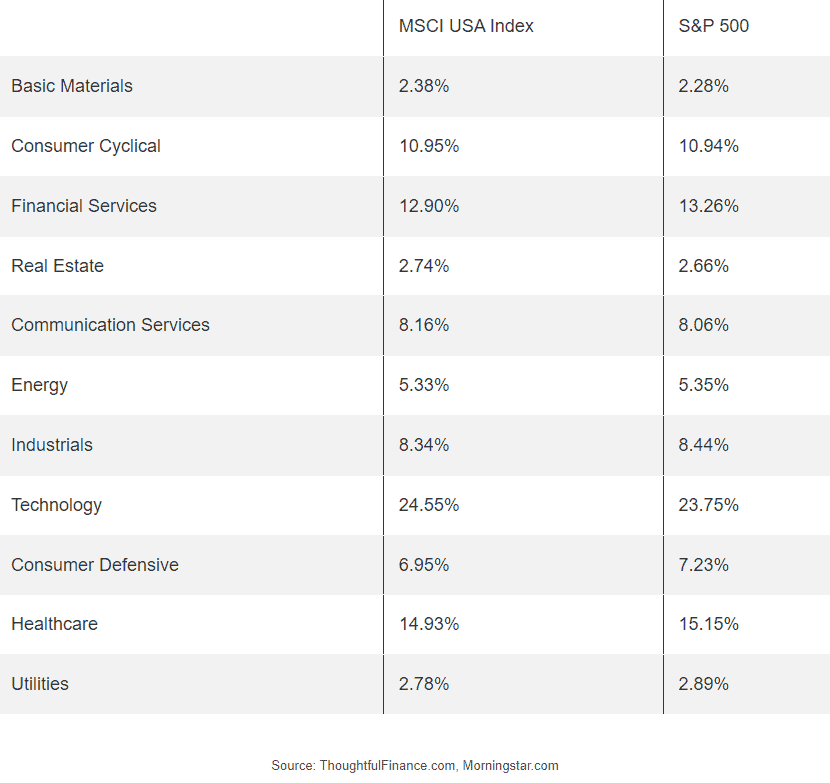
Sectors
The sector exposure of the two indices is also nearly identical.
Final Thoughts on MSCI USA vs S&P 500
Investors cannot invest in indices directly and should do their own research before deciding to invest in a fund that tracks either index. That being said, these two indices appear largely identical in terms of geographic, market cap, and sector exposure. For all intents and purposes, I would argue that these two benchmarks are interchangeable.
With such a small performance difference though, the costs of investable index strategies may be a larger consideration than which benchmark to select. Sometimes benchmark selection matters quite a bit, although that does not appear to be the case between these two indices.