The KLD 400 index is one of oldest socially responsible investing (SRI) indices and it still offers SRI investors an alternative to traditional indices like the S&P 500. However some differences become apparent when examining the KLD 400 vs S&P 500 and we will explore these below.
A quick note that investors cannot invest directly in an index. These unmanaged indexes do not reflect management fees and transaction costs that are associated with an investable vehicle, such as the iShares MSCI KLD 400 Social ETF (symbol: DSI) or the iShares Core S&P 500 ETF (symbol: IVV). A reminder that these are simply examples as this site does NOT provide investment recommendations.
Historical Performance: KLD 400 vs S&P 500
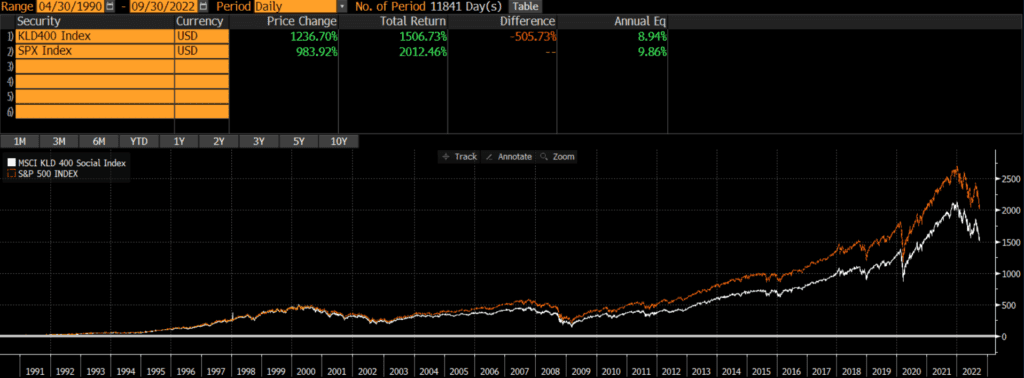
The below KLD 400 vs S&P 500 chart shows that the S&P 500 has outperformed by nearly 1% annually since the KLD 400’s inception in 1990. However, similar to our analysis of the Russell 1000 vs S&P 500, the performance differential is narrower more recently.
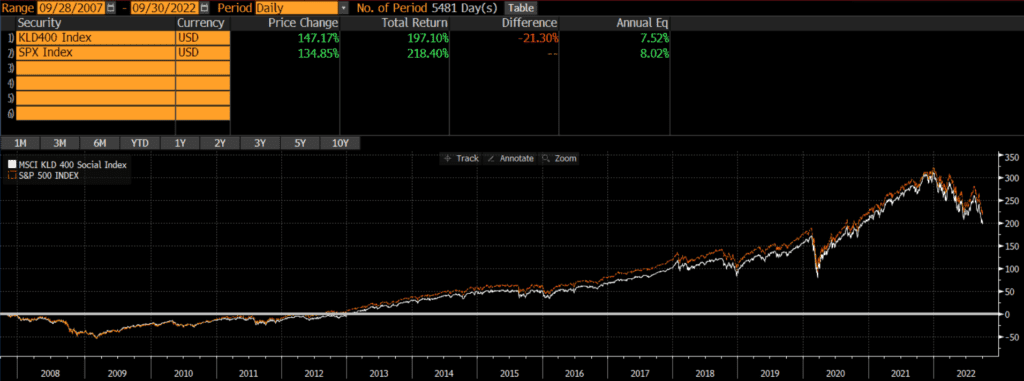
If we shorten the KLD 400 vs S&P 500 graph timeframe to the past 15 years, the performance difference narrows. Over this timeframe the S&P index outperformed the KLD index by 50 basis points annually.
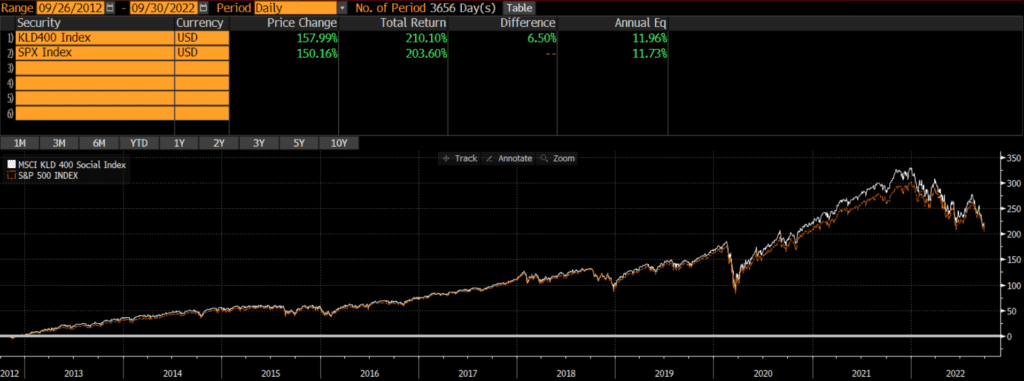
The difference in KLD 400 vs S&P 500 performance flips if we change the chart timeframe to 10 years. Over this timeframe, the KLD has outperformed by nearly a quarter percent annually. Of course, nobody knows what the future holds, but the performance over all timeframes has been relatively close (within 100 bps since inception).
Composition Differences: KLD 400 vs S&P 500
The KLD 400 and the S&P 500 are similar in many respects. The KLD 400 index
It is worth noting that the MSCI KLD 400 index is derived from the MSCI USA index. Our analysis of the MSCI USA Index vs S&P 500 found that the two are nearly identical. However, the KLD 400 contains some ESG screens that set it apart from both the MSCI USA and the S&P 500.
ESG Methodology
According to MSCI, the MSCI USA index is the parent index of the KLD 400. The first step in deriving the KLD index is to exclude any companies involved in Nuclear Power, Tobacco, Alcohol, Gambling, Military Weapons, Civilian Firearms, GMOs, or Adult Entertainment. Then constituents are added based on ESG considerations, as well as to keep sector and market cap exposures inline with the parent index. There is additional steps taken during the semi-annual reconstitution and rebalancing, all of which can be found on MSCI’s website.
Geography
Both the MSCI KLD 400 Index and the S&P 500 only include the stocks of US-domiciled companies.
Market Capitalization: KLD 400 vs S&P 500
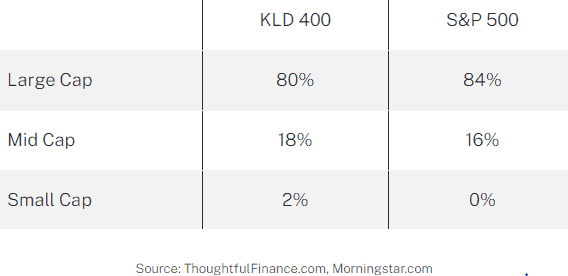
The market cap exposure of the KLD index and the S&P index are similar, although the KLD 400 tilts marginally more towards mid-cap and small-cap stocks.
Sector Comparison
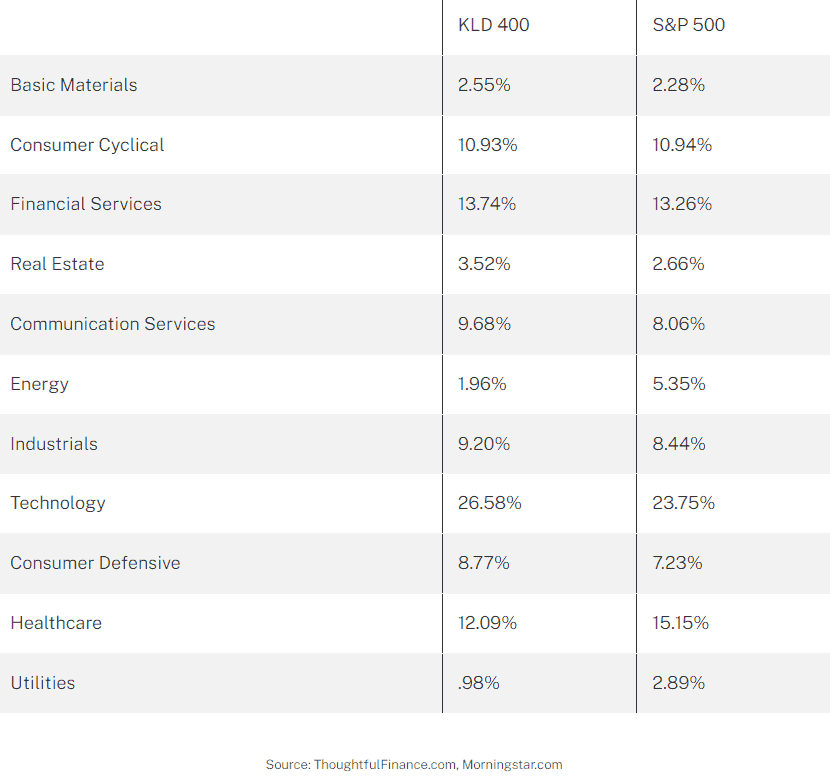
The sector exposure of the two indices is very similar with just a few key differences. Like many ESG-oriented indices, the KLD 400 is underweight energy, utilities, and healthcare.
Final Thoughts on KLD 400 vs S&P 500
Investors cannot invest in indices directly and should do their own research before deciding to invest in a fund that tracks either index. These indices are similar in many ways and performance differentials have depended on the time period being evaluated. Those considering benchmarking to the KLD 400 index (or any SRI/ESG for that matter) should first review the index methodology. The primary reason investors would use something like the KLD 400 index is to align their portfolio with their values, so they better ensure that they agree with the index methodology!
For instance, an investor may care deeply about the environment and social issues and be drawn to the KLD 400 index as a benchmark. However, if the investor is supportive of nuclear power as an alternative to fossil fuels, then the KLD index may not be the one for them.