VMMXX vs VMRXX: Which Fund is Best?
Vanguard offered two “prime” money market mutual funds: the Vanguard Cash Reserves Federal Money Market Fund Admiral Shares (VMRXX) and the Vanguard Cash Reserves Federal Money Market Fund (VMMXX). However, VMMXX shares were converted to VMRXX back in 2021. Many investors still ask about the differences between these two funds since VMMXX was one of the largest prime money market mutual funds and VMRXX is one of the largest in the market today. When comparing VMRXX vs VMMXX, it is clear which was better.
The Short Answer
VMRXX and VMMXX were two share classes of the exact same fund! There is no need to compare VMRXX vs VMMXX because the only difference is the expense ratio and yield. It should be noted that VMMXX has closed and shares have been converted to VMRXX.
VMRXX vs VMMXX Historical Performance
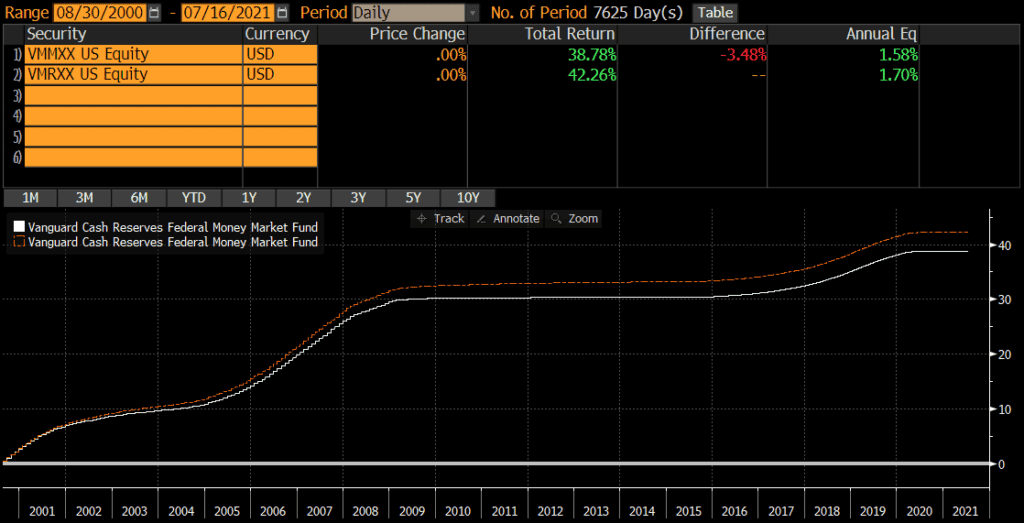
Since its inception, VMRXX outperformed VMMXX by .12% on an annualized basis. That compounded to a 3.48% cumulative difference over the 20 years that they co-existed, which is relatively small.
Current Yields for VMMXX & VMRXX
The current 7 day yield is a standardized yield metric for money market mutual funds and the 7 day yields for VMRXX can be found on the fund’s webpage. See here for VMRXX.
What rate is VMRXX & VMMXX paying?
The current interest rate for VMRXX, VMMXX, and other Vanguard money markets can be found on Vanguard’s money market page.
VMMXX & VMRXX Details
The expense ratio was .16% for the VMMXX investor shares and is .10% for the VMRXX ultra shares. Since the funds were just different share classes of the same portfolio, this difference in expenses is what accounted for the differences in yield and performance. Neither fund charges a load or 12b-1 fees.
VMMXX is closed and cannot be invested in, while VMRXX has a minimum investment of $3,0000.
I have not checked every brokerage, but VMRXX is generally only available to clients of Vanguard.
Like most money market mutual funds, investors can sell VMRXX at any time.
VMMXX & VMRXX Risks
Hypothetically, an investor could lose money with VMRXX (or VMMXX when it existed), but I personally do not think that is a realistic risk as I believe the fund sponsor or the federal government would intervene if that were about to happen. Technically, it is possible to lose money in VMRXX though.
As of July 31, 2023, VMRXX had over $107 billion in net assets.
Is VMMXX or VMRXX FDIC Insured?
No, VMRXX is not FDIC insured (nor was VMMXX)
Holdings
The two funds are share classes of the same portfolio, so the holdings were identical. The largest holding of VMRXX is repurchase agreements (repos) at 46.8%, followed by US government obligations at 28.3%, and T-bills at 24.9%.
Tax Considerations
VMRXX is (and VMMXX was) a “prime” fund which means that it can invest in both government and non-government financial instruments. However, taxable investors may find better after-tax yields in government or municipal (muni) money market funds, both of which offer tax benefits that may improve investors’ after-tax yield.
Government and Treasury Money Market Funds
Most states have an income tax. However, interest from Treasuries is exempt from state tax. Therefore, investors in states with income tax may be better off with a Treasury-only money market fund (such as SNSXX or SUTXX) that only invests in Treasuries.
Muni Money Market Funds
Investors subject to higher tax rates may consider municipal (muni) money market funds due to the fact the interest is typically exempt from federal income tax (and often from state tax too!).
The caveat with muni money market funds though is that the yields can move up and down A LOT. Therefore, the stated yield that an investor looks up on any given day is not necessarily indicative of the future return. To understand why, read my post on muni money market yields.
Rather than expecting a muni money market fund’s stated yield, I encourage investors to expect the trailing average yield (over the past few weeks). Generally speaking, the after tax returns of munis will only be higher than non-muni money markets for those in the highest tax brackets.
Which is Best? VMRXX or VMMXX?
VMMXX is closed, so VMRXX is the only choice between these two!