MOIC is a common metric in performance reporting for private equity, venture capital, real estate, and other private investments. It is a valuable tool, but it is insufficient in and of itself. It is important to understand how the MOIC figure is generated as well as look at other return metrics such as IRR, TVPI, CoC, and so on.
MOIC Definition
MOIC stands for Multiple On Invested Capital. It expressed return as a multiple of invested capital. Invested capital typically refers to the amount of money that is actually invested (by a fund, typically), so MOIC is often used to measure the performance of private investments. MOIC can be quoted on a gross or net of fees basis.
MOIC Formula
MOIC Example
Let’s assume an investor purchases a building for $10 million. Over the next few years, the investor receives $2 million of distributions and the building appreciates in value to $13 million. In this case, the total realized value is $2 million and the total unrealized value is $13 million. The total cost was $10 million. So the MOIC would be 1.5x.
MOIC Calculation
In the above example, we get 1.5x by adding $2 million and $13 million and then dividing by $10 million.
Shortfalls of MOIC
MOIC is an immensely useful metric for evaluating private equity investments. However, MOIC does have some limitations as well.
MOIC Does Not Consider Time
The first major problem with MOIC is that it does not consider time. We do not know whether an investment with a 2x MOIC is good or bad. It the investment was 2 years ago, the 2x MOIC is great performance. If the investment was made 15 years ago, the 2x MOIC looks rather low.
MOIC Does Not Consider Time Value of Money
Even if two private equity funds are identical in terms of total MOIC and time invested, there can be major differences in return. Consider two different five-year funds, Fund A and Fund B. Both funds have generated a 1.6x MOIC on their investments. Yet, this is insufficient to know which fund performed better.
Lets assume Fund A called 100% of capital immediately. After two years, it returned 130% of that amount back to investors and an additional 30% at the end of the five year period. This is a 1.6x net MOIC.
Alternatively, consider Fund B which also called 100% of capital immediately. It made no distributions for five years and then returned 160% of capital back to investors. This is also a 1.6x net MOIC.
Even though the two funds have generated the same MOIC from their investments, Fund A clearly performed better than Fund B. Investors could have taken the initial distribution from Fund A and reinvested it for the remaining years, whereas investors in Fund B had a total return of 1.6x.
While MOIC is important, time matters and the time value of money matters. This is why investors should never only look at MOIC. They should also look at IRR and/or understand the timing of the cashflows that generated the MOIC figure. Read my summary on MOIC vs IRR.
MOIC May Not Represent Investor Returns
The IC in MOIC stands for invested capital, which technically means capital that the fund invested. But MOIC is often calculated at the asset level and reported gross of fees. Investors may want to compare MOIC to TVPI to get a better read on investor returns.
Impact of Recycling on MOIC
A private equity fund will commonly be receiving distributions from the assets that it owns at the same time that it is calling capital from investors. Consider a $100 million fund that receives a $5 million distribution and simultaneously needs to make a $5 million investment. A popular tactic is to use the proceeds to fund the capital call (rather than distributing the $5 million and then issuing a capital call for them to send it back). In this case, the Multiple (numerator) is increasing and the Invested Capital (denominator) is increasing, but the investor has not contributed any more cash. So the Cash-on-Cash (CoC) return is higher than what the MOIC indicates. Many funds market their “Max Out Of Pocket” exposure, which is another way of saying what percent of an investor’s commitment they end up actually contributing (once recycling is accounted for).
Recallable Distributions (and other shenanigans)
Some private equity funds may distribute capital back to investors very early and classify it as a recallable distribution, meaning that it can be called again. The impact on MOIC is that it reduces the denominator, so MOIC numbers increase. Funds may also make distributions early on (even if they are going to recall it again) because it can permanently increase the IRR metrics. I’m not a huge fan of these recallable distributions, but they are out there and it is important to understand how they can impact MOIC and other performance metrics. The main point here is that fund can play (what I consider) games by re-classifying cash flows.
TVPI is a common metric in performance reporting for private equity, venture capital, real estate, and other private investments. It is a valuable tool, but it is insufficient in and of itself. It is important to understand how the TVPI figure is generated as well as look at other return metrics such as IRR, CoC, MOIC, and so on.
TVPI Definition
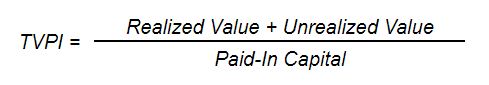
TVPI stands for Total Value to Paid In. It expressed return as a multiple of “paid-in capital.” Paid-in capital is the money that an investor invests (regardless of how much is actually invested), so TVPI is often used to measure the performance of private equity fund investments. TVPI can be quoted on a gross or net of fees basis.
TVPI Formula
TVPI Example
Let’s assume an investor buys into a private equity fund. The investor contributes $11 million. $1 million dollars goes towards fund expenses and fees. The investor receives $1.5 million of distributions and expects to receive a final distribution of $12.5 million at the end of the fund’s life (after all expenses and fees are paid). In this case, the TVPI is 1.27x.
TVPI Calculation
In the above example, we get 1.27x by adding $1.5 million and $12.5 million and then dividing by $11 million.
Shortfalls of TVPI
TVPI is an immensely useful metric for evaluating private equity investments. However, TVPI does have some limitations as well.
TVPI Does Not Consider Time
The first major problem with TVPI is that it does not consider time. We do not know whether an investment with a 2x TVPI is good or bad. It the investment was 2 years ago, the 2x TVPI is great performance. If the investment was made 15 years ago, the 2x TVPI looks rather low.
TVPI Does Not Consider Time Value of Money
Even if two private equity funds are identical in terms of TVPI and time invested, there can be major differences in return. Consider two different five-year funds, Fund A and Fund B. Both funds have generated a 1.6x TVPI. Yet, this is insufficient to know which fund performed better.
Lets assume Fund A called 100% of capital immediately. After two years, it returned 130% of that amount back to investors and an additional 30% at the end of the five year period. This is a 1.6x TVPI.
Alternatively, consider Fund B which also called 100% of capital immediately. It made no distributions for five years and then returned 160% of capital back to investors. This is also a 1.6x TVPI.
Even though the two private equity funds have the same TVPI, Fund A clearly performed better than Fund B. Investors could have taken the initial distribution from Fund A and reinvested it for the remaining years, whereas investors in Fund B had a total return of 1.6x.
While TVPI is important, time matters and the time value of money matters. This is why investors should never only look at TVPI. They should also look at IRR and/or understand the timing of the cashflows that generated the TVPI figure. Read my summary on TVPI vs IRR.
TVPI May Not Represent Cash on Cash Returns
The PI in TVPI stands for Paid-In capital, which technically means capital that meets a capital call. But what if capital is met by distributions that have been made? In these cases, the cash-on-cash may be higher than TVPI and more representative of the investor’s experience.
Impact of Recycling on TVPI
A private equity fund will commonly be receiving distributions from the assets that it owns at the same time that it is calling capital from investors. Consider a $100 million fund that receives a $5 million distribution and simultaneously needs to make a $5 million investment. A popular tactic is to use the proceeds to fund the capital call (rather than distributing the $5 million and then issuing a capital call for them to send it back). In this case, the Total Value (numerator) is increasing and the Paid-In capital (denominator) is increasing, but the investor has not contributed any more cash. So the Cash-on-Cash (CoC) return is higher than what the TVPI indicates. Many funds market their “Max Out Of Pocket” exposure, which is another way of saying what percent of an investor’s commitment they end up actually contributing (once recycling is accounted for).
Recallable Distributions (and other shenanigans)
Some private equity funds may distribute capital back to investors very early and classify it as a recallable distribution, meaning that it can be called again. The impact on TVPI is that it reduces the denominator, so TVPI numbers increase. Funds may also make distributions early on (even if they are going to recall it again) because it can permanently increase the IRR metrics. I’m not a huge fan of these recallable distributions, but they are out there and it is important to understand how they can impact TVPI and other performance metrics. The main point here is that fund can play (what I consider) games by re-classifying cash flows.
IRR and MOIC are two popular performance metrics, especially within “alternative” investment asset classes such as real estate, private equity, and venture capital (where time-weighted returns are essentially meaningless). Both IRR and MOIC are important metrics, but neither should be used in isolation when comparing a fund’s performance; investors should always evaluate both within the context of the other (as well as expenses, since MOIC and IRR are often quoted on a gross basis).
IRR
IRR Definition
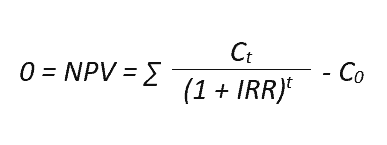
IRR stands for Internal Rate of Return. IRR is the discount rate one would need to use so that the net present value (NPV) of all future cash flows is zero. In other words, one would look at all the contributions into and distributions from an investment and then find the rate that discounts the sum to zero. IRR is not a perfect way to calculate returns, but it is one of the better metrics for many real estate, private equity, and venture capital assets (among others). IRR can be quoted on a gross or net of fees basis.
IRR Formula
Mathematically, IRR is variable than enables the sum of the NPV of cashflows to equal zero. The bad news is that the equation below is the formula used to derive IRR. The good news is that many calculators, Microsoft Excel, and Google Sheets can calculate IRR.
Source: ThoughtfulFinance.com
IRR Example & IRR Calculation
The IRR calculation is complex, but a calculator can do it relatively quickly. If I’m in rush or want to get a ballpark estimate, I’ll simply google “IRR calculator.” Microsoft Excel and Google Sheets also have IRR (if periodic cashflows) and XIRR (if non-periodic cashflows) functions.
Using an online calculator, Excel, or Sheets, we can input the below hypothetical cash flows and determine that the IRR is 42%.
Initial Investment
$100,000
Year 1 Cash Flow
$125,000
Year 2 Cash Flow
$10,000
Year 3 Cash Flow (final distribution)
$20,000
IRR
42%
Source: ThoughtfulFinance.com
IRR: Pros & Cons
Pros of IRR
One the primary reasons that IRR is the default performance reporting metric for alternative investments is that it accounts for varying amounts of capital. Many alternative investments are funded over time and distributions are also made over time.
IRR accounts for the time value of money, unlike MOIC which does not account for time at all.
IRR is very sensitive to several factors that (within a fund context) encourage managers to only call capital when it is needed and to return capital to investors relatively quickly. As we will see later, this can also be a negative.
Cons of IRR
Despite the above pros, IRR is not necessarily sufficient to evaluate investment performance for a few reasons.
As illustrated in our example and mentioned in the “pros” section above, IRR is sensitive to early cash flows and small (often inconsequential) distributions early on can elevate IRR for years.
IRR calculations begin when capital is put to work. However, it does not account for the opportunity cost of uncalled capital. Uncalled capital is often generating low(er) returns since it needs to be relatively liquid.
On the flip side, IRR does not account for the time after capital is returned to investors. In the above example, capital was returned relatively quickly (which could be a pro or con for the investor, depending on their opportunity set available).
Lastly, IRR’s are based on cash flows and cash flows can be changed without impacting performance. In other words, IRR can be influenced (or manipulated) relatively easily.
Subscription lines: Funds have increasingly used “subscription lines” to defer calling investor capital. The leverage allows funds to buy assets and generate returns early on. The funds can then distribute more capital back to investors earlier. Sounds great, except the leverage has a cost and is simply in lieu of called capital (rather than in addition to). This inflates the IRR while often reducing economic returns (due to interest and administrative expenses).
Leverage & Dividend Recaps: Assume an investor buys a building for $10 million and it generates $2 million of cash flow in the first year. The IRR would be 20%. However, if the investor decides to borrow 90% of the buildings value and pocket the proceeds, the investor has now taken $11 million out of the investment ($2 million of cash flow and $9 million of cash out refinance proceeds). The IRR jumps from 20% to 200% without any difference in economic returns (the investor may actually be worse off, since they now have to pay interest on the loan).
Performance fees (carry, promote, incentive, etc.) are often based on IRR, even though it is not necessarily representative of actual dollar returns.
Similar to MOIC, IRR is simply an estimate at any point before all all returns have been realized.
Since MOIC is generally quoted on a gross basis, gross IRRs can vary wildly from net IRRs. Investors should calculate net IRRs if needed.
MOIC
MOIC Definition
MOIC stands for Multiple On Invested Capital. It expresses returns as a multiple of investment. MOIC is typically quoted on a gross basis (so before expenses such as fees are deducted and taken into account).
MOIC Formula
MOIC Example
Let’s use the above numbers (from our IRR example above) to calculate MOIC. The initial investment is $100,000. The asset generates total proceeds of $155,000 through its life. In this case the MOIC is 1.55x.
MOIC Calculation
In the above example, we get 1.55x by adding $125,000 from Year 1, $10,000 from Year 2, and $20,000 from Year 3 and dividing by $100,000.
MOIC: Pros & Cons
Pros of MOIC
MOIC is relatively easy to calculate (even in your head) and easily understood intuitively. Thus, a main benefit of MOIC is that conveys the actual dollar return (gross of fees, generally).
In the above IRR example, the IRR is 42%. So a prospective investor may mistakenly extrapolate that the next (similar) investment will grow to approximately 286,000 over three years (assuming a 42% return compounded annually). However, the investment only grew to $155,000 over three years.
Cons of MOIC
One of the downsides of MOIC is that it does not account for time value of money. MOICs can grow quite large by just holding assets for a long time, so MOIC must be evaluated within the context of time.
As an example, is a 3x MOIC or a 4x MOIC better? Nobody can say unless they know what the time periods are. If the 3x MOIC was generated in two years and the 4x MOIC over 8 years, I’d say that the 3x investment was the better one.
Another weakness of MOIC is that it does not account for varying amounts of capital. It is quite easy to understand if capital is all invested at once. But what if capital is called/invested over time?
For instance, assume 10% of capital is invested in Year 1 and doubles in value. An additional 10% of capital is invested in Year 2 and then the asset value doubles again. Then 80% of capital is invested in Year 3 and there are no distributions or change in value through Year 5. The MOIC after five years is 1.6x. Is this good or bad return? The returns were great the first two years and terrible during the last three years (when the majority of capital was invested).
Similar to IRR, MOIC is simply an estimate at any point before all capital has been returned to investors.
MOIC is generally quoted on a gross basis. Investors should account for fees and expenses in these cases.
MOIC is often a performance metric for individual fund assets, which can differ quite a bit from fund-level performance. For fund-level performance, investors may want to consider using TVPI rather than MOIC.
MOIC vs IRR
Similarities
MOIC and IRR are different but do have some similarities:
Are preferable to time-weighted return (TWR) in many scenarios.
Widely used in the (alternative) investment industry.
Differences
As readers can glean from the above, there are some important differences between MOIC and IRR:
IRR represents the time value of money, but MOIC represents the multiple of money.
IRR is relatively sensitive to inputs (and easier to engineer/manipulate); it is more difficult to do this with MOIC.
IRRs are generally higher early in an investment’s life; MOIC is generally higher later in an investment’s life.
MOIC is generally quoted on a gross basis, while IRR is quoted on a gross or net basis.
Using MOIC and IRR Together
Both MOIC and IRR have strengths and weaknesses, but neither should be used in isolation. Unfortunately, many investment managers and funds often advertise IRR or MOIC but not both. Investors wanting to understand performance should be evaluating both MOIC and IRR within the context of expenses and other factors such as leverage, pacing, etc.
IRR MOIC Table
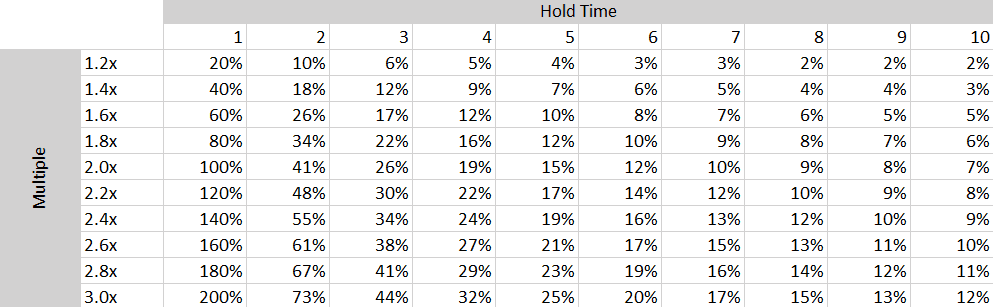
One resource that may be helpful is the below IRR MOIC table, which models the relationship between IRRs, multiples (such as MOIC), and hold time. Of course, each investment is unique with caveats and there is no standard MOIC to IRR formula or calculator (since the inputs can vary quite a bit especially for IRR). In the absence of a IRR to MOIC conversion formula, the below MOIC IRR table is a great resource (although it may or may not hold in each case depending on an investment’s details).
Source: ThoughtfulFinance.com
As an investor, one of the first things I do when evaluating a fund’s pitch or performance is to ensure that I have IRR and MOIC data as well as an understanding of the size/pacing of capital calls and distributions. If this information is not provided initially, I will ask for it and most managers can provide it relatively quickly. But I will not make an investment without looking at and understanding both IRR and MOIC.
IRR and TVPI are two popular performance metrics, especially within “alternative” investment asset classes such as real estate, private equity, and venture capital (where time-weighted returns are essentially meaningless). Both IRR and TVPI are important metrics, but neither should be used in isolation when comparing a fund’s performance; investors should always evaluate both within the context of the other.
IRR
IRR Definition
IRR stands for Internal Rate of Return. IRR is the discount rate one would need to use so that the net present value (NPV) of all future cash flows is zero. In other words, one would look at all the contributions into and distributions from an investment and then find the rate that discounts the sum to zero. IRR is not a perfect way to calculate returns, but it is one of the better metrics for many real estate, private equity, and venture capital funds (among others). IRR can be quoted on a gross or net of fees basis.
IRR Formula
Mathematically, IRR is variable than enables the sum of the NPV of cashflows to equal zero. The bad news is that the equation below is the formula used to derive IRR. The good news is that many calculators, Microsoft Excel, and Google Sheets can calculate IRR.
Source: ThoughtfulFinance.com
IRR Example & IRR Calculation
The IRR calculation is complex, but a calculator can do it relatively quickly. If I’m in rush or want to get a ballpark estimate, I’ll simply google “IRR calculator.” Microsoft Excel and Google Sheets also have IRR (if periodic cashflows) and XIRR (if non-periodic cashflows) functions.
Using an online calculator, Excel, or Sheets, we can input the below hypothetical cash flows and determine that the IRR is 42%.
Initial Investment
$100,000
Year 1 Cash Flow
$125,000
Year 2 Cash Flow
$10,000
Year 3 Cash Flow (final distribution)
$20,000
IRR
42%
Source: ThoughtfulFinance.com
IRR: Pros & Cons
Pros of IRR
One the primary reasons that IRR is the default performance reporting metric for alternative investments is that it accounts for varying amounts of capital. Many alternative investments are funded over time and distributions are also made over time.
IRR accounts for the time value of money, unlike TVPI which does not account for time at all.
IRR is very sensitive to several factors that (within a fund context) encourage managers to only call capital when it is needed and to return capital to investors relatively quickly. As we will see later, this can also be a negative.
Cons of IRR
Despite the above pros, IRR is not necessarily sufficient to evaluate investment performance for a few reasons.
As illustrated in our example and mentioned in the “pros” section above, IRR is sensitive to early cash flows and small (often inconsequential) distributions early on can elevate IRR for years.
IRR calculations begin when capital is put to work. However, it does not account for the opportunity cost of uncalled capital. Uncalled capital is often generating low(er) returns since it needs to be relatively liquid.
On the flip side, IRR does not account for the time after capital is returned to investors. In the above example, capital was returned relatively quickly (which could be a pro or con for the investor, depending on their opportunity set available).
Lastly, IRR’s are based on cash flows and cash flows can be changed without impacting performance. In other words, IRR can be influenced (or manipulated) relatively easily.
Subscription lines: Funds have increasingly used “subscription lines” to defer calling investor capital. The leverage allows funds to buy assets and generate returns early on. The funds can then distribute more capital back to investors earlier. Sounds great, except the leverage has a cost and is simply in lieu of called capital (rather than in addition to). This inflates the IRR while often reducing economic returns (due to interest and administrative expenses).
Leverage & Dividend Recaps: Assume an investor buys a building for $10 million and it generates $2 million of cash flow in the first year. The IRR would be 20%. However, if the investor decides to borrow 90% of the buildings value and pocket the proceeds, the investor has now taken $11 million out of the investment ($2 million of cash flow and $9 million of cash out refinance proceeds). The IRR jumps from 20% to 200% without any difference in economic returns (the investor may actually be worse off, since they now have to pay interest on the loan).
Performance fees (carry, promote, incentive, etc.) are often based on IRR, even though it is not necessarily representative of actual dollar returns.
Similar to TVPI, IRR is simply an estimate at any point before all capital has been returned to investors.
TVPI
TVPI Definition
TVPI stands for Total Value to Paid In. It expressed return as a multiple of “paid-in capital.” Paid-in capital is the money that an investor invests in a fund (regardless of how much is actually invested by the fund), so TVPI is often used to measure the performance of fund investments. TVPI can be quoted on a gross or net of fees basis.
TVPI Formula
TVPI Example
Let’s use the above numbers (from our IRR example above) to calculate TVPI. The initial investment is $100,000. The investor receives a total of $155,000 through the life of the investment. In this case the TVPI is 1.55x.
TVPI Calculation
In the above example, we get 1.55x by adding $125,000 from Year 1, $10,000 from Year 2, and $20,000 from Year 3 and dividing by $100,000.
TVPI: Pros & Cons
Pros of TVPI
TVPI is relatively easy to calculate (even in your head) and easily understood intuitively. Thus, a main benefit of TVPI is that conveys the actual dollar return to investors.
In the above IRR example, the IRR is 42%. So a prospective investor may mistakenly extrapolate that their next investment would grow to approximately 286,000 over three years (assuming a 42% return compounded annually). However, the investment only grew to $155,000 over three years.
Cons of TVPI
One of the downsides of TVPI is that it does not account for time value of money. TVPIs can grow quite large by just holding assets for a long time, so TVPI must be evaluated within the context of time.
As an example, is a 2xTVPI or a 5x TVPI better? Nobody can say unless they know what the time periods are. If the 2x TVPI was generated in one year and the 5x TVPI over 12 years, I’d say that the 2x investment was the better one.
Another weakness of TVPI is that it does not account for varying amounts of capital. It is quite easy to understand if capital is all invested at once. But what if capital is called/invested over time?
For instance, assume 10% of capital is called in Year 1 and doubles. An additional 10% of capital is called in Year 2 and then the fund value doubles again. Then 80% of capital is called in Year 3 and there are no distributions or change in value through Year 5. The TVPI after five years is 1.6x. Is this good or bad return? The returns were great the first two years and terrible during the last three years (when the majority of capital was invested).
Similar to IRR, TVPI is simply an estimate at any point before all capital has been returned to investors.
TVPI vs IRR
Similarities
TVPI and IRR are different but do have some similarities:
Are preferable to time-weighted return (TWR) in many scenarios.
Widely used in the (alternative) investment industry.
Differences
As readers can glean from the above, there are some important differences between TVPI and IRR:
IRR represents the time value of money, but TVPI represents the multiple of money.
IRR is relatively sensitive to inputs (and easier to engineer/manipulate); it is more difficult to do this with TVPI.
IRRs are generally higher early in an investment’s life; TVPI is generally higher later in an investment’s life.
Using TVPI and IRR Together
Both TVPI and IRR have strengths and weaknesses, but neither should be used in isolation. Unfortunately, many investment managers and funds only advertise IRR or TVPI but not both. Investors wanting to understand performance should be evaluating both TVPI, IRR, and other factors such as leverage, pacing, etc.
One resource that may be helpful is the below table, which models the relationship between IRRs, multiples (such as TVPI), and hold time. Of course, each investment is unique with caveats, so this table may or may not hold in each case but I find it is a good general resource.
Source: ThoughtfulFinance.com
As an investor, one of the first things I do when evaluating a fund is to ensure that I have IRR and TVPI data as well as an understanding of the size/pacing of capital calls and distributions. If this information is not provided initially, I will ask for it and most managers can provide it relatively quickly. But I will not make an investment without looking at and understanding both IRR and TVPI.
Internal Rate of Return (IRR) is the default performance reporting metric for many private market assets, from real estate to private equity and venture capital. Unfortunately, IRR is complex to calculate and not an intuitive metric for most investors, so calculators/spreadsheets are a must to determine and compare both gross IRR and net IRR.
Nearly all investments incur expenses and so there is a difference between gross and net performance. Gross IRR does not include expenses and represents performance before expenses, while net IRR includes expenses and thus represents performance after expenses. Investors evaluating any type of performance should compare gross vs net performance, including gross IRR vs net IRR.
Gross IRR
Technically, IRR is the discount rate one would need to use so that the net present value (NPV) of all future cash flows is zero. Gross IRR considers the cash flows before the deduction of expenses, so the cash flow inputs and resulting IRR are higher than with net IRR.
Gross IRR Calculation & Example
The IRR calculation is complex, but a calculator can do it relatively quickly. If I’m in rush or want to get a ballpark estimate, I’ll simply google “IRR calculator.” Microsoft Excel and Google Sheets also have IRR (if periodic cashflows) and XIRR (if non-periodic cashflows) functions.
Using an online calculator, Excel, or Sheets, we can input the below cash flows and determine that the IRR is 17.5%.
Initial Investment
$100,000
Year 1 Cash Flow
$10,000
Year 2 Cash Flow
$20,000
Year 3 Cash Flow (final distribution)
$125,000
IRR
17.5%
Source: ThoughtfulFinance.com
Net IRR
As stated above, IRR is the discount rate one would need to use so that the net present value (NPV) of all future cash flows is zero. Net IRR considers the cash flows after the deduction of expenses, so the cash flow inputs and resulting IRR are lower than with gross IRR.
Net IRR Calculation & Example
As mentioned above, the IRR calculation is complex, but a calculator can do it relatively quickly. If I’m in rush or want to get a ballpark estimate, I’ll simply google “IRR calculator.” Microsoft Excel and Google Sheets also have IRR (if periodic cashflows) and XIRR (if non-periodic cashflows) functions.
The main difference when calculating net IRR vs gross IRR is that we’ll have to adjust the amounts of the cashflows. In the below example, we will add a 10% performance fee (carry/promote/incentive) to the cash flows of the above example. Therefore, the cash flows will only be 90% of the cash flows in the gross IRR example above.
Using an online calculator, Excel, or Sheets, we can input the below cash flows and determine that the IRR is 13%.
Initial Investment
$100,000
Year 1 Cash Flow
$9,000
Year 2 Cash Flow
$18,000
Year 3 Cash Flow (final distribution)
$112,500
IRR
13.0%
Source: ThoughtfulFinance.com
Gross vs Net IRR: Calculation Differences
As the above examples show, the main difference between gross IRR vs net IRR calculations is the impact of expenses on the cash flow inputs used in the calculation. The calculation remains the same, but the inputs need to be adjusted beforehand. Common adjustments include:
There may be others, but these are the ones that I observe most frequently.
Gross vs Net IRR in Private Equity
Although IRR is a common reporting metric, there is variation in how it’s reported. Some default to reporting gross IRR, while others default to net IRR.
The most common practice seems to be reporting net IRR at the fund level. All fund expenses and investor-level fees are deducted, with the caveat that the performance of any single investor will vary.
There are a few reasons that investor-level returns deviate from fund -level returns. Different investors often pay different fees (and reporting a multitude of individualized net IRRs is not feasible). Early investors often receive discounts and larger investors qualify for fee breakpoints.
Reporting an investor -level IRR is further complicated by the fact that investors may have invested at different points in time. Even if there are equalization terms and catch-up interest is paid, there are timing differences that could impact an investors IRR. Additionally, it is not uncommon for equalization to adjust the equity or NAV for investors, but allow early investors to keep the income distributions that they already received.
Some sponsors report gross IRR and some may report IRR that is net of non-fee expenses and gross of fees. Still others might report non-IRR performance metrics like MOIC or TVPI or not report anything at all! Even if IRR is reported though, it is important that investors understand if it is gross IRR, net IRR, or some hybrid IRR, as well as how it is derived.
MOIC and TVPI are two popular performance metrics, especially within “alternative” investment asset classes such as real estate, private equity, and venture capital. Both are relatively easy to calculate and provide the context needed to understand performance beyond internal rates of return (or IRR, which is the default reporting metric for many private investments.
However, TVPI and MOIC are not the same. Continue reading to learn how to differentiate between TVPI vs MOIC.
MOIC
MOIC Definition
MOIC stands for Multiple On Invested Capital. It expresses returns as a multiple of investment. MOIC is typically quoted on a gross basis (so before expenses such as fees are deducted and taken into account).
MOIC Formula
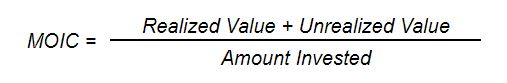
Mathematically, MOIC is expressed as an investment’s value (both realized and unrealized) divided by the amount invested.
MOIC Example
Let’s assume an investor purchases a building for $10 million. Over the next few years, the investor receives $2 million of distributions and the building appreciates in value to $13 million. In this case, the total realized value is $2 million and the total unrealized value is $13 million. The total cost was $10 million. So the MOIC would be 1.5x.
MOIC Calculation
In the above example, we get 1.5x by adding $2 million and $13 million and then dividing by $10 million.
TVPI
TVPI Definition
TVPI stands for Total Value to Paid In. It expressed return as a multiple of “paid-in capital.” Paid-in capital is the money that an investor invests (regardless of how much is actually invested), so TVPI is often used to measure the performance of fund investments. TVPI can be quoted on a gross or net of fees basis.
TVPI Formula
TVPI Example
Let’s assume an investor buys into a fund that buys the above building. The investor contributes $11 million. $1 million dollars goes towards fund expenses and fees. The investor receives $1.5 million of distributions and expects to receive $12.5 million from the sale of the building (after all expenses and fees are paid). In this case, the TVPI is 1.27x.
TVPI Calculation
In the above example, we get 1.27x by adding $1.5 million and $12.5 million and then dividing by $11 million.
TVPI vs MOIC: Differences
Although MOIC and TVPI appear quite similar, the main differences between the two are:
MOIC is generally:
Quoted on a gross basis
Applicable to an investment
TVPI is generally:
Quoted on a gross or net basis
Applicable to an investor
Despite the differences, both metrics are helpful to use when evaluating IRR. Read our posts on MOIC vs IRR or TVPI vs IRR to learn more.
The Importance of MOIC and TVPI
MOIC and TVPI occupy an important place in investing in that they are widely-used multiple-based metrics. The other common metric in private market investing is internal rate of return (IRR). Both multiple-based and IRR-based returns have strengths and weaknesses, but neither should be used in isolation. Investors wanting to understand performance should be evaluating both multiples and IRRs.
Unfortunately, many investment managers and funds only advertise IRRs (and sometimes only gross IRRs!). At best, its an non-intuitive metric that does not paint a full picture by itself. At worst, it is used to obscure low investment returns on a multiple basis. Both MOIC and TVPI are valuable tools for investors evaluating investments.
An important consideration when investing in private equity is the preferred return, which is not a standardized term and has many variations. At the highest level, private equity investors should understand what the preferred return is as well as how its calculated, what the catch-up is (if any) and whether there are claw back provisions. Additionally, investors should evaluate whether the preferred return is simple, compounded, cumulative, and so on.
Performance fees are also known as carry, carried interest, performance allocations, incentive allocations, or incentive fees (among other terms) and I’ll be using them interchangeably. Private equity funds are typically long-term closed-end vehicles, so the below information and examples are more conceptual than anything else. They are examples of private equity preferred returns and investors are encouraged to carefully read the legal documents of any prospective investment.
Preferred Returns: Pure vs Catch-Ups
Pure Preferred Return
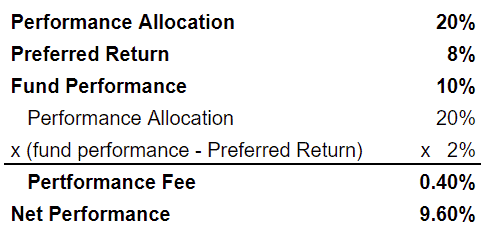
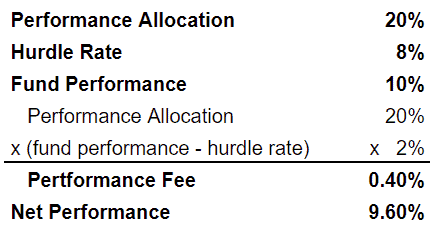
Pure preferred return is also known as a “true preferred return” or a “hard preferred return” (similar to a “hard hurdle” in hedge fund lingo, although use the term in a private equity context too). A pure preferred return means that the manager only collects a fee on the performance above the preferred return. This arrangement is more investor-friendly than the alternative of a “preferred return with catch-up.” Below is a detailed example of a private equity pure preferred return:
In the above example, the manager charges a 20% performance fee above an 8% preferred return. Since the fund returned 10%, the performance fee is .4% (20% multiplied by 2%).
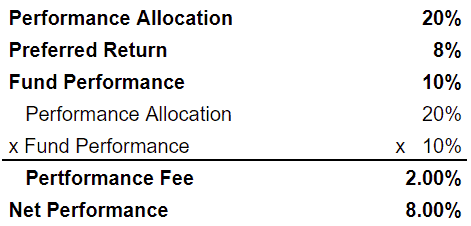
Preferred Return with Catch-Up
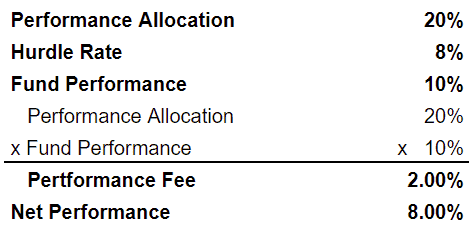
A preferred return with catch-up means that the manager collects fees back to the first dollar of performance (the manager “catches up”), assuming that gross performance exceeds the preferred return. This arrangement is more manager-friendly than a pure preferred return. Below is a detailed example of a private equity preferred return with catch up:
In the above example with catch-up, the manager also charges a 20% performance fee above an 8% preferred return. However, the fee is applied on all returns (assuming fund performance exceeds the preferred return). So the performance fee is 2% (20% multiplied by 10%).
100% Catch-up
Once performance hits 7%, all additional returns accrue to the manager until gross performance surpasses 8.24% (because 7% is 85% of 8.24%). In other words, investors receive the returns from 0% to 7% and the manager receives returns from 7% to 8.24%. Returns of 8.25% and beyond are split 85%/15% between the investors and manager.
50/50 Catch-up
A 50/50 catch-up is a common catch-up structure, although it could be 60/40, 75/25, or any other combination.
Let’s look at an example of a private equity preferred return with a 50/50 catch-up. A private equity fund fund has 20% performance fee above a 10% preferred return with a 50/50 catch-up provision. In this case, the investors would receive all of the returns up to 10%. Additional returns would be split 50/50 until gross returns hit 12.5%. At 12.5%, the manager would be fully caught-up since they would receive 50% of the returns from 10% to 12.5% or 1.25% (which is 10% of 12.5%). Returns above 12.5% would be split 90/10 between the investors and manager.
Catch-Up Modifications and Limitations
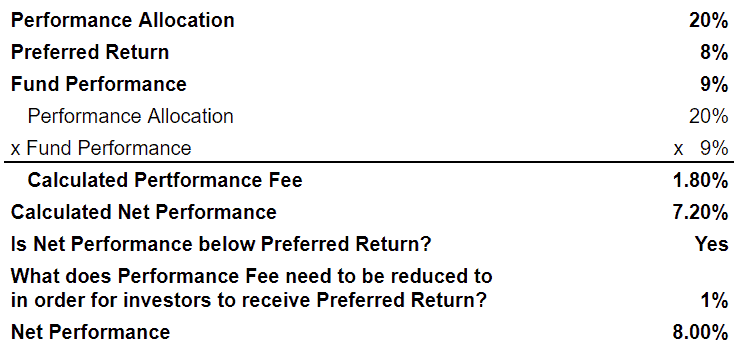
Some funds have a structure where the manager earns carried interest back to the first dollar of performance (assuming that gross performance exceeds the preferred return), but the performance fee is reduced if it would cause net returns to be lower than the preferred return. Below is a detailed example of this modified structure private equity waterfall structure.
This structure allows managers to retain the upside, while somewhat protecting investors.
Tiered Preferred Returns
Similar to how a catch-up allows managers to have more upside than a pure performance return, a tiered preferred return allows managers to capture even more upside as performance increases.
Here’s an example of a private equity fund with tiered performance fees. The performance fee may be 20% over an 8% preferred return, 30% over a 12% preferred return, and so on. The performance fee can be structured to only apply to returns above the preferred return or to go back to the first dollar of returns. So an investor may pay a 20% performance fee up to 12% and a 30% performance fee on returns above 12%. Or they might pay 30% on all returns if the performance is above 12%. The fees at different tiers can also be limited so as to not push returns below the tier that they are being charged fees for.
Some investors believe that tiered preferred returns in private equity improve the alignment of interests between managers and investors, while others believe that it incentivizes risky behavior.
Simple, Compounding, and Resetting
Regardless of whether a private equity fund has a pure preferred return or a catch-up, it is important to note how the preferred return rate is quoted and how it works.
Simple Preferred Returns
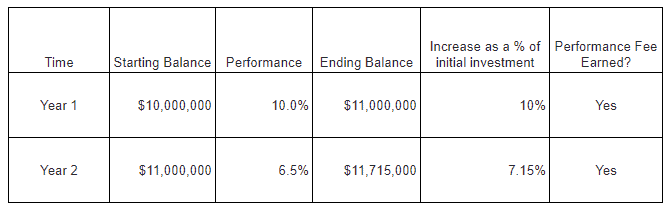
Some private equity preferred returns are quoted as a simple rate, which is generally not a great arrangement for investors. Consider the example in the below table where a fund may have a preferred return of a 7%. In this case, the fund will be entitled to its performance fee as long as it returns at least 7% on invested capital. So if the fund starts with $10 million and returns are 10% in Year 1, the manager gets the performance fee. However, if the fund returns 6.5% in Year 2, the manager still gets the performance fee. This is because the $715,000 (calculated as 6.5% x $11 million) that it earned in Year 2 is more than 7% of invested capital (of $10 million).
This model is obviously favorable to managers, although it may make sense for certain open-ended vehicles (and may not matter for some closed-end vehicles).
Compounded Preferred Returns
Some private equity preferred returns are quoted as an annually compounded rate. If the preferred return is 6%, then the fund must return at least 12.36% over a 2-year period (since a 6% return compounded for 2 years is 12.36%), 19.1% over a 3-year period (since a 6% return compounded for 3 years is 19.1%), and so on.
Non-cumulative Preferred Returns
The advent of evergreen and open-ended private equity has resulted in some preferred returns that are “non-cumulative” and reset periodically. In other words, the preferred return will reset regardless of the prior periods performance.
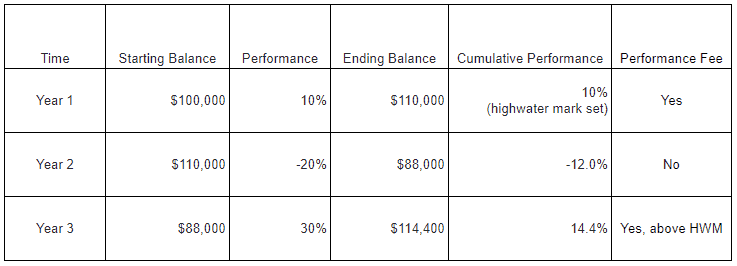
This is obviously manager-friendly (and unfavorable to investors). Consider a fund with an 8% preferred return that that loses 20% in Year 1 and gains 10% in Year 2. No performance fee would have been charged in Year 1, but it would have been charged in Year 2 (since the Year 2 performance exceeded the preferred the return). Investors would be down 12% and yet still have to pay a performance fee! This example is detailed in the table below.
High Water Marks
A high water mark (or high-water mark or high watermark) has primarily been used by hedge funds historically, but it is becoming more common in private equity due to the wave of evergreen offerings with non-cumulative performance fees.
A high water mark is a mechanism to address the downsides of a non-cumulative preferred return. Furthermore, it ensures that a performance fee will not be charged until cumulative performance is positive. Returning to the previous example, a high water mark would prevent the manager from collecting performance fee in Year 2 (even though the preferred return resets in the new year) because the cumulative performance is still negative. However, once the cumulative performance exceeds the 0%, then the manager would be entitled to the performance fee.
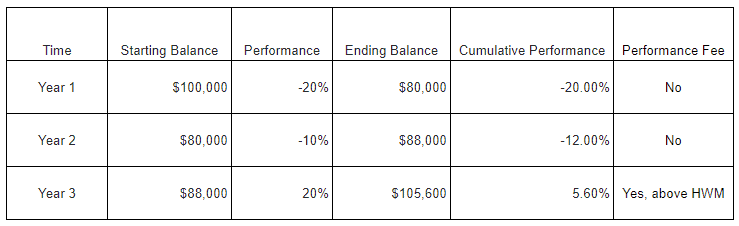
It is easy to think of other examples where a high water mark would protect investors. A common risk would be paying the performance fee twice on the same performance. In the chart below, we assume a fund returns 10% in Year 1 and -20% in Year 2 and then 30% in Year 3. The investment would have gone from 100,000 to 110,000 in Year 1 and again in Year 3 and investors would not want to pay for that twice. A high water mark ensures that they only pay a performance fee on the gains from 110,000 to 114,400 in Year 3.
Private Equity Waterfall Structures
I’ll probably write another post on this, but there are two main types of “waterfalls” or ordering of distributions.
European Waterfall
Under a European waterfall structure, investors typically receive their return of capital and preferred return before the manager begins receiving its fee carried interest catch-up. Given that many private equity funds are 10 year funds (plus extensions), managers may be waiting a very long time before receiving any carry from the waterfall.
American Waterfall
Under an American waterfall, the manager is allowed to receive advances of its carried interest catch-up on a “deal-by-deal” basis. Essentially, this allows the manager to receive some compensation earlier. Proponents of this structure argue that it allows managers to think longer-term and not sell assets prematurely in order to generate income for themselves.
Clawback Provisions
Clawback provisions are important for investors to have under an American waterfall structure. It provides a mechanism for investors to receive some compensation from the manager if the deal-by-deal carried interest fees that are advanced are ultimately more than what the manager is entitled to (once the fund is fully wound down and the actual fees known). Unfortunately for investors, clawbacks are generally net of taxes since managers argue that they cannot refund what they paid to the IRS. So investors may receive a fraction of what was overpaid to the manager.
Conclusion
Ultimately, performance fees, preferred returns, and high water marks are designed to align the interests of private equity managers and investors. The structure of these terms varies from fund to fund, depending on factors like manager size, asset class, and so on. There is no “best” set of terms, but investors should ask whether the terms create alignment in a variety of good and bad scenarios. This is also true when investing in real estate, hedge funds, and many other alternative investments beyond private equity.
A hedge fund’s hurdle rate is an important consideration when investing in hedge funds, especially since it has many variations. At the highest level, investors should understand what a hedge fund hurdle is, whether it is a hard hurdle, soft hurdle, or blended. Additionally, investors should evaluate whether the hedge fund hurdle rate is compounding or non-compounding as well as the existence and structuring of a high water mark mechanism.
Performance fees are also known as carry, carried interest, performance allocation, incentive allocations, or incentive fees (among other terms) and I’ll be using these term interchangeably. It is important to note that fees and hurdles can be assessed monthly, quarterly, annually, or longer. The below information and examples are just examples and investors are encouraged to carefully read the legal documents of any prospective investment.
Hedge Fund Hurdles
Hard Hurdle
A hard hurdle means that the manager only collects a fee on the performance above the hurdle rate. This arrangement is more investor-friendly than a soft hurdle. Below is a detailed exampled of a hedge fund with a hard hurdle:
In the above example, the manager charges a 20% performance fee above an 8% hurdle. Since the fund returned 10%, the performance fee is .4% (20% multiplied by 2%).
Soft Hurdle
A soft hurdle means that the manager collects fees back to the first dollar of performance, assuming that gross performance exceeds the hurdle rate. This arrangement is more manager-friendly than a hard hurdle. Below is a detailed example of a hedge fund with a soft hurdle:
In the above example of a soft hurdle, the manager also charges a 20% performance fee above an 8% hurdle. However, the fee is applied on all returns (assuming fund performance exceeds the hurdle rate). So the performance fee is 2% (20% multiplied by 10%).
Blended Hurdle
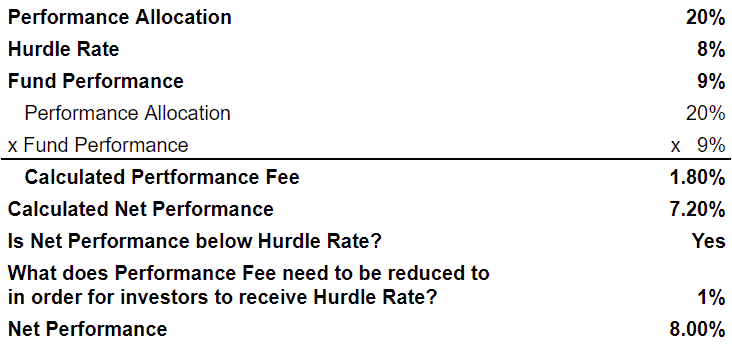
A blended hurdle is similar to a soft hurdle in that a manager can collect fees back to the first dollar of performance (assuming that gross performance exceeds the hurdle rate). However, the performance fee is reduced if it would cause net returns to be lower than the hurdle rate. Below is a detailed example of a hedge fund with a blended hurdle.
Blended hurdles allow the manager to capture upside, while somewhat protecting investors.
Graduated Hurdle Rates
Similar to how a hedge fund with a blended hurdle allows a manager to have more upside than a hard hurdle, a graduated hurdle allows a manager to capture even more upside as performance increases.
Consider the following example of a hedge fund with a graduated hurdle. The performance fee may be 20% over an 8% hurdle, 30% over a 12% hurdle, and so on. Again, the hurdle can be structured to only apply to returns above the hurdle or to go back to the first dollar of returns. So an investor may pay a 20% performance fee up to 12% and a 30% performance fee on returns above 12%. Or they might pay 30% on all returns if the performance is above 12%.
Some investors believe graduated here fund hurdle rates improve the alignment of interests between managers and investors, while others believe that it incentivizes reckless risk taking.
Hedge Fund Hurdle Rate: Compounding vs Non-Compounding
Regardless of whether a fund has a hard hurdle or a soft hurdle, it is important to note whether the hedge fund hurdle rate is compounding or non-compounding. If it is non-compounding, investors should determine whether the performance fee is subject to a high water mark (see below).
Compounding
A compounding hurdle rate means that the hurdle rate compounds over time. Here is an example of a hedge fund with a compounding hurdle rate. If the hurdle rate is 6%, then the fund must return at least 12.36% over a 2 year period (since a 6% return compounded for 2 years is 12.36%). A hurdle rate could also be a benchmark index like the S&P 500 or a benchmark plus a spread (such as 3-month T-bills plus 200 basis points). Using these types of benchmarks could result in a negative hurdle rate, so the hurdle rate often has a floor of 0%.
Non-Compounding
If the hurdle rate is non-compounding, then it resets periodically. In other words, the hurdle rate will reset regardless of the prior periods performance. This is obviously manager-friendly (and unfavorable to investors).
Consider this example of a hedge fund with a non-compounding 8% hurdle rate that loses 20% in Year 1 and gains 10% in Year 2. No performance fee would have been charged in Year 1, but it would have been charged in Year 2 (since the Year 2 performance exceeded the hurdle rate). Investors would be down 12% and yet still have to pay a performance fee! This example is detailed in the table below.
High Water Marks
A high water mark (or high-water mark or high watermark) is a tool frequently used to address the problems with non-compounding hurdle rates. A high water mark simply ensures that a performance fee cannot be charged until cumulative performance is positive.
Continuing from the previous example, below is an example of how a high water mark would prevent the manager from collecting performance fee in Year 2 (even though the hurdle rate is non-cumulative) because the cumulative performance is still negative. However, if the cumulative performance exceeded 0%, then the manager would be entitled to the performance fee.
It is easy to think of other examples where a high water mark would protect investors. A common risk would be paying the performance fee twice on the same performance.
In the table below, we see an example of how a high water mark protects investors from paying fees on the same performance twice. Assume a fund returns 10% in Year 1 and -20% in Year 2 and then 30% in Year 3. The investment would have gone from 100,000 to 110,000 in Year 1 and again in Year 3 and investors would not want to pay for that twice. A high water mark ensures that they only pay a performance fee on the gains from 110,000 to 114,400 in Year 3.
Problems with High Water Marks
High water marks are a mechanism to protect investors. However, it can backfire in cases where managers severely underperform. If a fund is loses 50% from its high water mark, then the fund must return 100% to get back to even and qualify for performance fees again. Some managers may be de-motivated by this and decide to shut the fund down rather than continue without the near-term prospect of performance fees. Of course, if the manager launches a new fund, they can begin collecting performance fees immediately on any positive performance. There was a high profile example of this recently when the “meme stock” craze crushed Melvin Capital. First the hedge fund manager floated the idea of modifying the hurdle rate and high water mark, before ultimately deciding to shut down and reopen. This example highlights why hedge funds are infamous for playing a game where “heads I win, tails you lose.”
Conclusion
Ultimately, hedge fund hurdle rates, performance fees, and high water marks are designed to align the interests of managers and investors. The structure of these terms varies from fund to fund, depending on factors like manager size, asset class, and so on. There is no “best” set of terms, but investors should ask whether the terms create alignment in a variety of good and bad scenarios. This is also true when investing in real estate, private equity, and many other alternative investments beyond hedge funds.
There is a growing number of open-ended evergreen private equity funds. The overwhelming majority of private equity funds are closed-end vehicles with finite lives. Private equity evergreen funds are a new development that offer investors a different set of tradeoffs than traditional private equity funds. I view this development as part of the larger democratization of alternative investments and we can find new evergreen vehicles in private equity, credit, venture, real estate and so on. A reminder that these are simply examples as this site does NOT provide investment recommendations.
Challenges of Drawdown Funds
Perhaps the biggest difference between evergreen private equity funds and traditional private equity funds is the structure. Traditionally, private equity funds have been “drawdown funds.” Funds with this “private equity structure” have a “drawdown” where they call capital over time (rather than calling 100% of committed capital immediately). So an investor who commits $1 million may only invest $100,000 in year one, $300,000 in year two, and so on. A similar dynamic occurs when these types of funds wind down, distributing say 6% of the fund in year seven, 18% in year eight, 34% in year nine, and so on. So investors slowly invest capital and slowly receive it back.
The above dynamics present several challenges to the investor:
The pace of capital calls is unknown and investors must be ready to fund capital calls with only a week’s or two’s notice (generally). Therefore, investors with uncalled commitments need to maintain sufficient liquidity. Whether that liquidity comes in the form of lower-returning liquid assets or a credit line, there is often either an opportunity or explicit cost for this liquidity.
Oftentimes, investor commitments are not fully called. A fund may only call 60% of commitments or 95% of commitments or some other number.
Given the closed-end structure of private equity funds and the capital call and distribution activity, PE investors usually develop a “recommitment strategy” where expected distributions from older funds are earmarked for expected capital calls from newer funds.
Given the above three challenges, investors cannot easily project how much they will have invested at any point in time. Consequently, many investors practice an “overcommitment strategy” in which they commit more capital than they have. This mitigates the risk of cash drag from uncalled commitments and inefficient cash flow management. However, overcommitting requires careful planning to ensure the investor does not default on a capital call.
The above challenges are routinely addressed by institutional investors, but can be problematic for individual investors.
Performance Reporting
Traditional PE: Fund performance is typically quoted as an internal rate of return (IRR). There is a famous saying that “you can’t eat IRR,” which is a way of saying that IRR is an academic metric that may not accurately measure the economic return to investors. Investors should always evaluate both IRR and “multiple of invested capital” (MOIC also called “total value to paid-in capital” or TVPI). I cannot count the number of times I’ve seen pitchdecks with eye-popping IRRs before learning that the multiples are disappointing. Understanding, negotiating, calculating, and verifying private equity waterfalls can be a job unto itself.
Evergreen PE: Rather than IRRs, performance is reported in time-weighted returns (like publicly-traded funds). Low returns are more difficult to obscure through financial engineering.
Opportunity Costs
Traditional PE: Fund performance calculations are based on the capital that is called, which may or may not be a material amount. The opportunity cost of uncalled capital is not included in a fund’s returns. As an example, consider an investor who wants to keep sufficient liquidity for expected capital calls. The investor decides to hold $100,000 of uncalled capital in bonds earning 4% rather than an illiquid investment yielding 10%. At the portfolio level, there is an opportunity cost of 6%, which is not reflected in a fund’s performance reporting. This is why many investors practice the aforementioned overcommitment strategy.
Evergreen PE: Capital is invested immediately and return-generation begins immediately. Investors know how much they are investing and when.
Liquidity
Traditional PE: Many private equity funds have a 10-year life, plus optional extensions. So many private equity investors don’t get their last dollar out until 10-15 years have passed.
Evergreen PE: Evergreen funds are often open-ended, which means that the funds accept capital on an ongoing basis. Additionally, many have liquidity features that provide investors the option to tender or redeem their investment on a periodic basis.
Investment Minimums & Investor Qualifications
Traditional PE: Many private equity funds require investors to be a qualified client or a qualified purchaser. Minimum ticket sizes generally start at $250,000, but can be $20M+. Thus, it is difficult for many individual investors to diversify within private equity unless they have a few million dollars (on the low end).
Evergreen PE: Since many evergreen vehicles are designed to alleviate the challenges of traditional PE for individual investors, the minimums and qualifications are generally lower.
Portfolio Management
Traditional PE: Many private equity sponsors launch a new fund (also called a vintage) every 1-3 years. So an investor may commit to Fund I and have their capital called over a number of years. Once the majority of capital is called, the sponsor launched Fund II. Again, capital is called over a number of years for Fund II. The investor then commits to Fund III just as Fund I begins to distribute capital back to the investor. This is perfect because the investor can use the Fund I distributions to cover the Fund III capital calls. This example is overly simplistic, but it illustrates that allocations to a manager often remain relatively constant even if there is a lot of committing, contributing, and distributing going on.
Evergreen PE: Rather than distribute all proceeds to investors, an evergreen private equity fund can reinvest a portion of the proceeds that it receives. So investors can make a single investment and upsize or redeem as needed, rather than embarking on a recommitment strategy of continually recycling capital into subsequent vintages.
‘40 Act Funds
There are an increasing number of evergreen private equity vehicles that are registered with the SEC under the 1940 Investment Company Act. The funds are often referred to as ’40 Act funds or registered funds. The ’40 Act structure often provides additional investor protections and efficiencies.
Tax Reporting: ’40 Act vehicles tax reporting is typically via a 1099, which is much simpler than a K-1. While this may marginally increase fund expenses (and possibly limit tax benefits), it often reduces individuals’ tax prep complexity and costs.
Diversification: While some ’40 Act fund sponsors view registered funds as a distribution channel and/or stuff their evergreen vehicles with their own assets, an increasing number of funds contain assets of other managers.
Traditional Private Equity vs Evergreen Private Equity
I believe there is room for both types of vehicles. Traditional private equity has many benefits for institutional investors (and even some individual investors). However, permanent capital vehicles in the form of evergreen fund structures alleviate many of the challenges that private equity investors face. Based on the rapid growth of evergreen vehicles, it seems that individual investors (without teams of investment professionals) find these funds attractive.
Private market investing typically requires investors to qualify as an Accredited Investor, a Qualified Client, or a Qualified Purchaser. These terms and related criteria are designed to protect investors, although some argue that they also limit investor opportunity.
Publicly-traded assets and investment vehicles register with the Securities and Exchange Commission (SEC), while private investment vehicles are exempt from registration if they follow certain rules. The idea being that the SEC will allow funds to not register if they limit their offerings to those who have the financial ability to tolerate risk and/or the sophistication to understand the risks. Different exemptions are available, but each exemption has rules about what types of investors a fund can accept. Some funds can only accept accredited investors, some can accept qualified clients, and some can accept qualified purchasers.
Accredited Investor
One of the prerequisites to private market investing is to be an “accredited investor,” as many private investment vehicles require investors to be accredited (even if there are additional requirements to be a qualified client or qualified purchaser). Both people and entities can be accredited investors.
Benefits of being an accredited investor
The primary benefit to being an accredited investor is that the investment universe is the opportunity to invest in private investments. Non-accredited investors are generally limited to publicly-traded assets and funds that have been registered with the SEC. Below are some examples of why it is beneficial to be accredited:
Nearly all private investment vehicles are “Reg D” offerings, which require investors to be accredited.
Many real estate funds rely on the 3(c)(5)(C) exemption, which requires investors to be accredited.
The accredited investor standard is viewed as a default investor qualification in many contexts and may be used to restrict access to additional products and services.
How do people qualify as accredited investors?
Individuals can qualify as an accredited investor with their income OR with their net worth.
Based on income
To qualify as an accredited investors based on income, an investor must have:
earned at least $200,000 in each of the prior two years and have a reasonable expectation of the same for the current year, OR
earned at least $300,000 jointly with their spouse (or a “spousal equivalent”) in each of the prior two years and have a reasonable expectation of the same for the current year.
Based on net worth
To qualify as an accredited investor based on net worth, an investor must have a net worth of at least $1 million. The equity and debt in a primary residence must be excluded from the net worth calculation (unless the debt exceeds value of the home, in which case ).
Other ways
There are some less common ways for individuals to qualify as an accredited investor as well:
Hold, in good standing, any of the following securities licensing designations: Series 7, Series 65, or Series 82.
Be a “knowledgeable employee” of the fund (or affiliate) in which the investor is investing.
Be a client of a family office.
How do entities qualify as an accredited investor?
Investors who want to invest through an entity (such as a trust or business) are subject to a different set of criteria:
The entity must own at least $5 million of investments, OR
All owners of the entity must be accredited investors.
Certain types of financial firms are also accredited investors.
It is important to note that there is no way for entities to qualify based on revenue or income. It is also important to note that the accredited investor rules may apply to different types of entities differently, although those differences are outside the scope of this particular post.
The accredited investor definition can be found here and a summary from the SEC can be found here.
Qualified Client
Qualified clients are a step up from accredited investors in terms of net worth.
Benefits of being a Qualified Client
The main benefit to being a qualified client is that the investment universe is even larger than for accredited investors. Many private equity, private debt, venture capital, and hedge funds cannot rely on the same registration exemptions that real estate funds do, so they often rely on the 3(c)1 exemption. However, these 3(c)1 funds can only accept qualified clients, so investors who wish to allocate beyond real estate generally need to be qualified clients. Yet, even many real estate funds rely on the 3(c)1 exemption, so being a qualified client really opens up the opportunity set.
3(c)1 funds are allowed to charge a performance allocation (also known as a performance fee or incentive fee). Since many private equity funds and hedge funds charge performance fees (above a hurdle rate), many are organized as 3(c)1 funds (or 3(c)7 funds if they are larger, generally).
Definition of Qualified Client
A Qualified Client is:
A person or entity that owns at least $2.2 million of investments (the definition of investments excludes residences). Assets owned jointly with a spouse can be counted.
A person or entity who invest at least $1.1 million with the adviser. In other words, if someone has a net worth of $1.5 million, they are not a qualified client. But if they invest $1 million in a single fund, then they are a qualified client.
A Qualified Purchaser.
Certain “knowledgeable employees” of the fund and/or it’s affiliates.
Funds that require investors to be qualified clients usually require the investor to be accredited too. The definition of a qualified client can be found here and (similar to the treatment of accredited investors) the application of qualified client criteria to certain types of entities often varies from fund to fund.
Qualified Purchaser
Qualified purchaser is the highest qualification of these three common investor qualifications.
Benefits of being a Qualified Purchaser
There are several benefits to being a Qualified Purchaser, most of which relate to being allowed to invest in 3(c)7 funds.
While many funds rely on the 3(c)1 exemption, the downside is that they are only allowed to have 99 investors. So many funds decide to rely on the 3(c)7 exemption instead, which allows the fund to have 499 investors. However, only qualified purchasers are allowed to invest in 3(c)7 funds. Thus, the investment universe for qualified purchasers is larger than for qualified clients or accredited investors
Some sponsors launch parallel funds, meaning that they manage one 3(c)1 fund and one 3(c)7 fund that both invest in the same strategy. If the 3(c)1 has used up its 99 investor slots, qualified purchasers can still invest in the 3(c)7 fund (which has 499 investors slots).
Many funds have a cap of 25% on ERISA-protected accounts, meaning that less than 25% of the fund can be from accounts such as 401k’s, SEP IRAs, etc. If there are parallel funds and one fund has reached its ERISA cap, a qualified investor may be able to invest in the second parallel fund.
A person or family-owned entity that owns at least $5 million of investments (the definition of investments excludes residences). Assets owned jointly with a spouse can be counted.
An entity where all of the “equity owners” are Qualified Purchasers.
An individual or entity that invests at least $25 million on a discretionary basis (either for themselves or on behalf of other Qualified Purchasers).
Certain “knowledgeable employees” of the fund and/or it’s affiliates.
Funds that require investors to be qualified purchasers usually require the investor to be accredited too. The definition of a qualified client can be found here and (similar to the treatment of accredited investors and qualified clients) the application of qualified purchaser criteria to certain types of entities often varies from fund to fund.
Concluding Thoughts
In my experience, the accredited investor qualification is the best known among individual investors, while qualified client and qualified purchaser terms are not as widely known. Investors should understand which criteria they meet in order to better understand the investments that they are allowed to invest in.