Is China an Emerging Market?

Is China an Emerging Market?

China has been viewed as an emerging market over the past several decades, although its current status is not as straightforward as you might expect. Many index providers classify China as an emerging market, although the economic and investment reality is more complex. China has displays many characteristics of emerging markets, yet is is the second largest economy in the world (which adds complexity to the debate).

In recent years, China has experienced remarkable economic growth and its economy is larger than any other country except the US. Yet, this remarkable development has not entirely erased some attributes typical of emerging markets, such as weaker regulatory systems and disparate income levels. Observers should be mindful of the nuances and intricacies that come with its unique position in the global landscape. Exploring this topic is vital in comprehending China’s role in today’s world economy and how it might evolve in the future.

Is China an Emerging Market?

Anyone exploring the question of whether China is an emerging market must consider the characteristics of both emerging and developed markets. Factors including economic growth, per capita GDP, and market accessibility play crucial roles in determining a country’s status as an emerging or developed market.

On the one hand, China’s rapid economic growth and influence on the global market have captured attention. According to a Pew Research Center survey, public opinion in emerging markets largely has a positive view of China’s economic stature, with many believing that China’s growing economy benefits their countries. Additionally, China’s stock market has become more open to the global financial system, attracting international investors.

Despite these impressive strides, China’s GDP per capita remains relatively low compared to developed markets at $12,556 (according to the World Bank). This level of GDP per capita supports China’s status as an emerging market in classifications like the Morgan Stanley Capital International (MSCI) indices.

However, as the line between emerging and developed markets blurs, it’s important to recognize that China’s economic situation defies conventional labels. The sheer size of China’s markets and influence on the global economy challenges traditional analysis frameworks.

Many commenters overgeneralize or exaggerate claims rather than speak to the complexity and evolving nature of China’s economy.

Economic Growth and Development

Size of Economy

One of the key indicators to consider is the size of China’s economy. China has experienced remarkable growth in recent decades and is now the second-largest economy in the world, following the United States. That does not square with the “emerging” label.

Industrialization

Another factor that influences the classification of China as an emerging market is industrialization. Over the years, China has transitioned from a predominantly agricultural economy to a major global manufacturing hub. The country has seen rapid expansion in various industries, including automobile production, electronics, and renewable energy. Consequently, this has led to increased exports and a strong industrial base, which is more typical of an emerging market than a developed market which typically has a lot of domestic consumption and more a more services-based economy.

Urbanization

Finally, urbanization plays a crucial role in determining China’s position in the global economic landscape. As more people move from rural areas to cities, there is a rise in demand for infrastructure, housing, and other amenities. This urban migration has facilitated the rapid development of urban centers, boosting economic growth along with it. This shift is consistent with countries moving from an emerging to a developed classification.

By examining these aspects, it becomes clear that China exhibits both characteristics of emerging and developed markets, making it difficult to definitively label it as either.

Market Structure

Market Capitalization

As you explore the market structure of China, it’s important to consider market capitalization. According to the World Bank, China has one of the largest stock markets in the world with a market capitalization of around $12.2 trillion (again, second only to the US with $40.7T). Again, I am not sure a country with the second largest market cap in the world can be considered emerging.

Fixed vs Floating Currency

Another aspect to take into account when examining China’s market structure is its currency system. China has a managed exchange rate, which means the value of its currency, the renminbi (RMB), is not determined solely by market forces. The People’s Bank of China (PBOC) intervenes in the foreign exchange market to manage the value of the RMB, which contrasts with the purely floating exchange rates used by most developed countries.

State-Owned Enterprises

Lastly, an important characteristic of China’s market structure is the presence and influence of state-owned enterprises (SOEs). SOEs continue to play a significant role in the Chinese economy, dominating strategic industries like energy, finance, and telecommunications. While the government has initiated various reforms to open up the markets and encourage private sector growth, SOEs still account for a substantial portion of China’s GDP and employment. In comparison, state-owned enterprises have a lesser presence in developed markets, where the private sector primarily drives the economy.

China exhibits a mix of characteristics from both emerging and developed markets. Its market capitalization has grown tremendously but remains smaller than major developed markets, it uses a managed exchange rate system unlike the purely floating rates of most advanced economies, and state-owned enterprises hold a significant presence in the economy, differing from the private sector-centric structure in developed markets.

Challenges Facing China’s Economy

Rule of Law

In addressing the challenges facing China’s economy, it’s important to consider the role of the rule of law. Weaknesses in legal infrastructure and unequal enforcement of existing laws can hinder growth and foster corruption. The existing situation in China appears to much more consistent with an emerging market rather than a developed one.

Inequality

Rapid industrialization and urbanization have lifted millions out of poverty, but gaps in income distribution persist. Rural and urban areas can show stark differences in wealth and development, with disparities in access to education, healthcare, and other social services.

Environmental Issues

Rapid industrialization and urbanization have also led to widespread air, water, and soil pollution. To promote long-term, sustainable development, the Chinese government has started implementing environmental protection policies, such as stricter regulations on emissions and waste disposal and increased investment in renewable energy and clean technologies

Implications for the Global Economy

Trade Relations

As China continues to grow, its influence on global economic trends and trade relations will likely expand. China’s rise as a key player in the world economy has led to stronger trade ties with various countries. This has boosted economic growth in many emerging markets, while also creating new opportunities for trade and investment.

However, it is essential to keep in mind that there may be challenges associated with China’s growing influence on trade relations. These challenges could arise from trade disputes, intellectual property concerns, and local industries’ competitive pressures.

Economic Growth and International Development

China’s massive economic growth has had a rippling effect on other emerging economies. In particular, its investment in infrastructure and resources in developing countries has helped stimulate growth and reduce poverty in various regions. As China’s economy continues to thrive, you can expect an increase in its investments in several high-growth sectors, such as technology, clean energy, and manufacturing. Very few emerging markets (or even developed ones!) provide the level of foreign aid and investment that China does.

Global Governance and Security

China’s rise in the global economy has also brought about changes in international governance and security. China is increasingly taking an influential role in global institutions which may lead to shifts in international policies and norms. Moreover, China is gradually building up its military capabilities to assert its regional and global security interests.

Given China’s mix of emerging and developed market characteristics, its growing role in the global economy has numerous implications for trade relations, economic growth, and international governance.

China’s Role in the Emerging Market Index

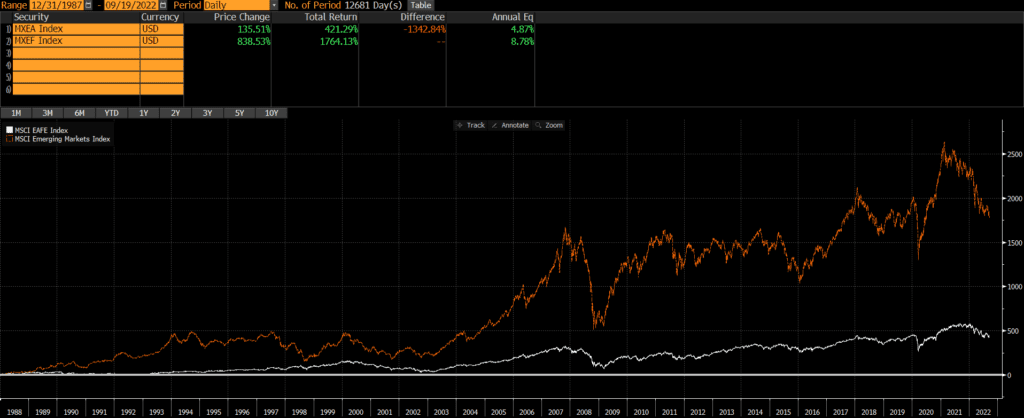
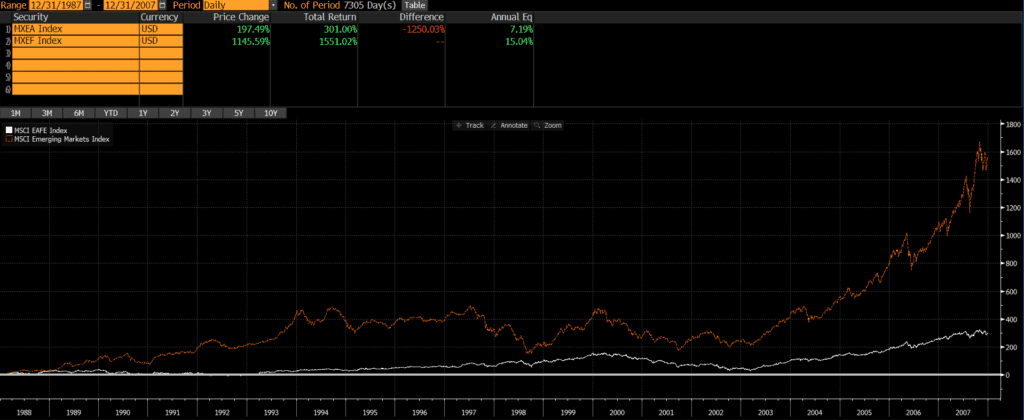
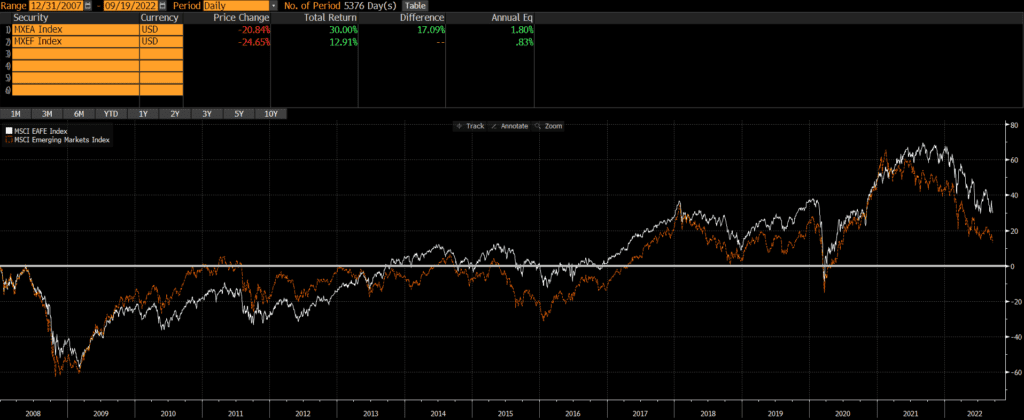
China is by far the largest constituent in the major emerging market indices, although its weight fluctuates with global stock markets. Even Chinese debt is becoming more prominent in investor portfolios.

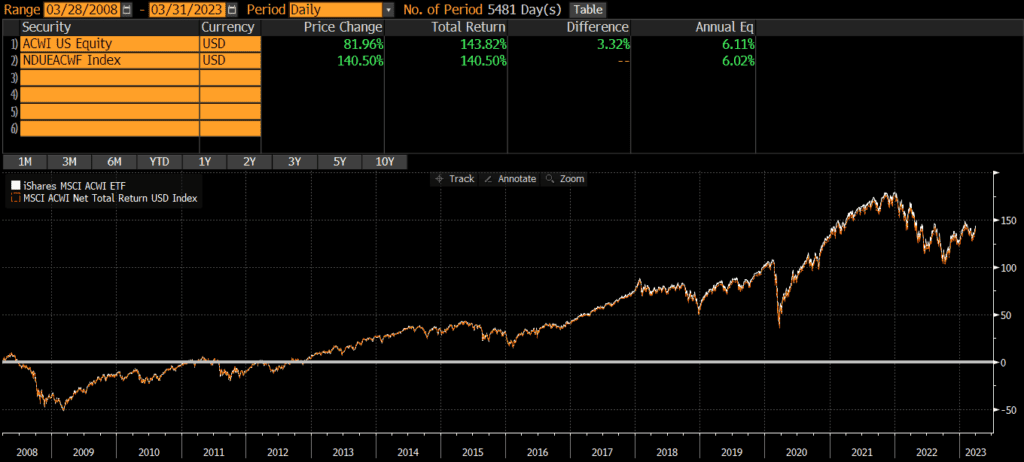
It’s also worth noting the changes in index methodology. In 2019, MSCI increased the inclusion ratio of China A shares in its Emerging Markets Index. This development has led global investors to re-evaluate their equity portfolio allocation frameworks, considering China’s growing economic strength and improving market accessibility.

Conclusion

In determining whether China is an emerging market, we must consider its unique characteristics which straddle the line between developed and developing economies. As the world’s second-largest economy and a key player in global trade, China has established itself as an influential participant in both advanced and emerging markets. On the other hand, it’s important to recognize that the country continues to face certain challenges typically associated with emerging markets.

Rather than relying on the index provider’s classification of China as an emerging market, I believe it is best to embrace the idea that China exhibits characteristics of both emerging and developed nations. By appreciating its multi-faceted nature and evolving economic relationships, we can gain a more nuanced understanding of China’s position in the global market landscape.

Developed Markets vs Emerging Markets

Many US investors allocate to international stocks, but there is no clear consensus on whether it is better to allocate to developed markets vs emerging markets or in what proportions. Below is some data and some thoughts on this question.

The term “international” often refers to the developed market stocks, while “emerging” refers to stocks from emerging markets. Our analysis will focus on the MSCI EAFE Index (since it is the most popular, even though there are other indices with arguably better coverage) for developed markets and the MSCI Emerging Markets Index for emerging markets.

Performance: Developed Markets vs Emerging Markets

Since inception, emerging markets have outperformed developed markets by a wide margin. The annualized performance of 8.78% is nearly double developed markets’ annualized performance of 4.87%. However, the past 35 years is a story in two acts.

The first 20 years of performance

For the first 20 years, returns for both developed and emerging stocks were elevated with emerging markets returning 15.04% annually versus developed markets 7.19% annually.

Recent historical performance

Both developed and emerging markets were hammered from 2007 to 2009 and both have exhibited low annualized returns since. Developed markets have returned an annualized 1.8% since the end of 2007, while the emerging markets have only returned an annualized .83% since. So developed has actually outperformed emerging markets in the second act.

Risks

In my (and many others’) analysis, most of the volatility (for US investors) in international stocks comes from the currency risk. As the above chart shows, the volatility and drawdowns in emerging markets are not that much more than in developed markets.

Composition

When looking at the global market cap, developed markets typically account for 25-30% and emerging markets often range from 10-15%. The percentages fluctuate due to the relative performance of the regions. Each of these indices also is primarily composed or large-caps, so we are comparing apples to apples.

Verdict

It is clear that investing in emerging markets stocks would have been more beneficial over the long-term. Recent performance complicates that decision a bit. Just as stock market returns are “lumpy” and factor returns are lumpy, the outperformance and underperformance of international stocks is lumpy and time dependent. Of course, it is anyone’s guess about what the future holds. My personal opinion is that since emerging markets has had periods of massive outperformance without much additional volatility, I personally overweight emerging market exposure and underweight developed market exposure.

FAQs

Do emerging markets outperform developed markets?

As the charts show, emerging markets have outperformed by a wide margin since inception. This was primarily driven by emerging market outperformance in the first 20 years, even though developed markets have slightly outperformed recently.

Do emerging markets have higher returns?

Emerging markets have had higher returns historically, relative to developed markets outside the US. However, this dynamic may or may not continue in the future. Emerging markets had higher returns than developed international markets from 1987 through 2007, but they have had lower returns since then.

Why are emerging markets riskier than developed markets?

Emerging market stocks tends to be more volatile due to less liquidity and more extreme currency fluctuations, among other factors. There is an additional factors that emerging markets are more vulnerable to various geopolitical and economic shocks and a lower degree of rule of law. This is why diversification is very important when investing in emerging markets.

What are the 5 biggest emerging markets?

The five largest emerging markets by market cap are:

  1. China
  2. Taiwan
  3. India
  4. South Korea
  5. Brazil

Do emerging markets benefit from inflation?

Some emerging markets benefit from inflation, while others do not. It depends on what is inflating and whether that market is a producer or consumer of that good or service. For instance, if oil prices rise, it may be good for Saudi Arabia (an oil producer) and bad for India (an oil importer).

ACWI ETF Review: Is ACWI A Good ETF To Invest In?

The iShares MSCI ACWI ETF (symbol: ACWI) is one of the largest exchange-traded funds (ETFs) in the market and widely used by investors for exposure to global stocks. ACWI is a low-cost index fund, which tracks the MSCI ACWI (All Country World Index) Index. As its name implies, it seeks to provide exposure to the global stock market in a single vehicle. The fund is the core of many portfolios and the below review of ACWI will evaluate why that is.

A quick reminder that this site does NOT provide investment recommendations. Fund reviews (such as this one) are for educational purposes only and are not advice or recommendations.

ACWI Performance

The first thing most investors want to know about is performance, so we will start there. According to Bloomberg, since the fund’s inception 15 years ago, ACWI has returned over 6% per year. Of course, this figure can go up or down and the returns in any single year are unlikely to be 6%. From 2009 through 2022 (14 years), ACWI was up in 10 years and down in 4 years. The average return in the up years was 18.2%, while the average return in the down years was -9.4%.

ACWI ETF performance since inception, as of March 31, 2023
Source: ThoughtfulFinance.com, Bloomberg

ACWI Risks

ACWI owns stocks which are more volatile than cash or bonds. While the returns are higher than cash or bonds, investors need to be prepared to stomach volatility and be able to hold for the longer-term. ACWI was down over 55% during the global financial crisis in 2007-2009 and dropped by a third during the covid pandemic. This is not necessarily worse than other similar funds, but it is a characteristic of stocks that investors need to be aware of.

ACWI Portfolio

Fund performance is ultimately driven by a fund’s holdings and exposures, so our ACWI review will examine these items.

ACWI Holdings

ACWI (and its underlying index) is incredibly diversified, holding over 2,000 stocks. This represents quite a bit of the global investable market.

ACWICRSP US Total Market Index
Number of Stocks2,3752,884
Sources: ThoughtfulFinance.com, iShares, MSCI (as of 3/31/2023)

ACWI Country Exposures

ACWI only stocks in dozens of countries, including both developed and emerging markets. Below are the top 10 country exposures, which is consistent with global market capitalizations.

United States60.25%
Japan5.45%
UK3.74%
China3.57%
France3.19%
Canada2.95%
Switzerland2.53%
Germany2.17%
Australia1.90%
Taiwan1.67%
Source: ThoughtfulFinance.com, iShares.com (as of 3/31/2023)

ACWI Market Cap Exposure

ACWI is a global fund which seeks to represent the global stock market, which is predominantly composed of large-caps. Even though the fund holds mid-caps, performance is primarily driven by the large-cap exposure.

ACWI
Large-Cap84%
Mid-Cap16%
Small-Cap0%
Source: ThoughtfulFinance.com, Morningstar; data as of 3/31/2023

ACWI Sector Exposures

ACWI is extremely diversified across sectors and mirrors the approximate weights of the broad US stock market.

ACWI
Basic Materials4.67%
Consumer Cyclical10.63%
Financial Services15.23%
Real Estate2.53%
Communication Services7.33%
Energy4.93%
Industrials10.29%
Technology20.95%
Consumer Defensive7.79%
Healthcare12.70%
Utilities2.94%
Source: ThoughtfulFinance.com, Morningstar; data as of 5/9/2023

Expenses

No review of ACWI would be complete without an in-depth look at the explicit and implicit costs of trading and holding ACWI.

ACWI Expense Ratio

ACWI’s expense ratio of .32% is not especially low for an index ETF, but it is a global fund (and ETFs with international holdings generally cost more) and has very few competitors. Of course, it may be difficult to get global exposure in a single ETF for much cheaper.

ACWI Transaction Costs

ETFs are free to trade at many brokers and custodians, so ACWI should be free to trade in most cases. Additionally, it is among the largest ETFs and is very liquid. The bid-ask spread of ACWI is about .01%, so individual investor trades will not generally be large enough to impact or move the market.

ACWI Tax Efficiency

Like most index funds, ACWI is very tax-efficient. Unlike actively-managed funds, passively-managed index funds typically have less trading and lower turnover. This results in fewer taxable events and higher tax efficiency.

ETFs are typically more tax-efficient than mutual funds, due to their ability to avoid realizing capital gains through like-kind redemptions (a process that is beyond the scope of this post). ACWI has never made a capital gains distribution, so ACWI is about as tax-efficient as any fund can be.

Investors in a high tax bracket with at least $250,000 may consider direct indexing rather than ACWI, as direct indexing can potentially generate even more tax savings.

ACWI Review: A Recap

The above review of ACWI illustrates that ACWI is a well-constructed, low-cost and tax-efficient index fund that provides diversified exposure to the global stock market. Investors looking to own the global stock market in a single ETF should consider ACWI.

FAQ’s

Is ACWI a good investment?

Whether ACWI is a good investment or not depends on the definition of “good investment.” If the definition is something that goes up in value, then nobody knows if it is a good investment. If the definition is a well-constructed portfolio that is low-cost and will likely do what it is supposed to do (mirror the global stock market), then yes it is a good investment.

Is ACWI safe long-term?

There is no way to say whether ACWI or any other investment is safe long-term. ACWI owns stocks, which are more volatile than cash or bonds. However, stocks have generated stronger long-term returns than cash or bonds. However, the future may unfold differently than the past, so it is impossible to say whether ACWI is safe in the long-term.

Is ACWI a risky investment?

ACWI owns stocks, which are more volatile than cash or bonds. Some of this risk is diversified away since ACWI owns thousands of stocks, so there is not too much risk or concentration in any single stock. ACWI is a well-diversified, low-cost index fund, so it is not any more risky than most stock funds.

Is ACWI a buy or sell right now?

Nobody knows the future nor whether ACWI is a buy or sell. ACWI is an index fund and many investors use index funds because they do not believe that investors can consistently time the market or predict the ideal times to buy and sell.

Is ACWI a good ETF to invest in?

The answer to this question depends on each investors’ goals. Investors looking for well-diversified, low-cost, tax-efficient exposure to the global stock market will find a lot to like in ACWI. However, ACWI is not a good ETF to invest in for those looking for something totally different.

Is ACWI good for beginners?

For investors looking for exposure to the broad global stock market, ACWI is not a bad choice. It can be the core position of a portfolio and provides instant diversification to investors who are building a portfolio.

Does ACWI pay dividends?

Yes, ACWI pays dividends. It is not necessarily a dividend-oriented fund and I would advise investors to focus on total return since dividends reduce a fund’s net asset value. In my view, receiving a dividend is equivalent to selling a small amount of the position. Investors should not focus on ACWI’s dividends or dividend yield.

FXAIX Review: Is FXAIX A Good Investment?

The Fidelity 500 Index Fund (symbol: FXAIX) is one of the largest mutual funds in the market. FXAIX is a low-cost index fund, which tracks the S&P 500 and seeks to provide exposure to the US stock market at a very low price. The fund is the core of many portfolios and the below review of FXAIX will evaluate why that is.

A quick reminder that this site does NOT provide investment recommendations. Fund reviews (such as this one) are for educational purposes only and are not advice or recommendations.

FXAIX Performance

The first thing most investors want to know about is performance, so we will start there. According to Bloomberg, since the fund’s inception 35 years ago, FXAIX has returned over 10% per year. Of course, this figure can go up or down and the returns in any single year are unlikely to be 8%. From 1990 through 2022 (32 years), FXAIX was up in 26 years and down in 6 years. The average return in the up years was 18.3%, while the average return in the down years was -17.2%.

FXAIX performance since inception, as of May 1, 2023.
Source: ThoughtfulFinance.com, Bloomberg

FXAIX Risks

FXAIX owns stocks which are more volatile than cash or bonds. While the returns are higher than cash or bonds, investors need to be prepared to stomach volatility and be able to hold for the longer-term. FXAIX was down nearly 50% during the tech crash and down over 55% during the global financial crisis from 2007-2009! This is not necessarily worse than other similar funds, but it is a characteristic of stocks that investors need to be aware of.

FXAIX Portfolio

Fund performance is ultimately driven by a fund’s holdings and exposures, so our FXAIX review will examine these items.

FXAIX Holdings

FXAIX (and its underlying index) is well diversified, holding over 500 stocks that are representative of the US stock market.

FXAIXS&P 500
Number of Stocks506506
Sources: ThoughtfulFinance.com, Fidelity (as of 3/31/2023)

FXAIX Country Exposures

FXAIX only owns US-based companies. Investors looking for international exposure may pair FXAIX with international funds or simply hold a global fund.

FXAIX Market Cap Exposure

FXAIX is a large-cap fund that seeks to represent the largest names in the US stock market, which are predominantly composed of large-caps. Even though the fund holds mid-caps, performance is primarily driven by the large-cap exposure.

FXAIX
Large-Cap84%
Mid-Cap16%
Small-Cap0%
Source: ThoughtfulFinance.com, Morningstar; data as of 3/31/2023

FXAIX Sector Exposures

FXAIX is extremely diversified across sectors and mirrors the approximate weights of the broad US stock market.

FXAIX
Basic Materials2.38%
Consumer Cyclical10.41%
Financial Services12.45%
Real Estate2.64%
Communication Services8.11%
Energy4.61%
Industrials8.42%
Technology26.66%
Consumer Defensive7.18%
Healthcare14.27%
Utilities2.86%
Source: ThoughtfulFinance.com, Morningstar; data as of 3/31/2023

Expenses

No review of FXAIX would be complete without an in-depth look at the explicit and implicit costs of trading and holding FXAIX.

FXAIX Expense Ratio

FXAIX’s expense ratio of .015% is among the lowest of any mutual funds. Even if another fund is free, one and a half basis points is not a material difference in my opinion.

FXAIX Transaction Costs

While ETFs are free to trade at many brokers and custodians, mutual funds often incur trading fees still. FXAIX should be free to trade in Fidelity accounts, but will likely cost money to buy or sell anywhere else. Investors planning to make small or frequent trades may want to consider using an ETF instead of a mutual fund. Readers may consider VOO or IVV.

FXAIX Tax Efficiency

Like most index funds, FXAIX is very tax-efficient. Unlike actively-managed funds, passively-managed index funds typically have less trading and lower turnover. This results in fewer taxable events and higher tax efficiency.

Investor looking for even more tax-efficiency may want to consider using an ETF, since they are typically more tax-efficient than mutual funds due to their ability to avoid realizing capital gains through like-kind redemptions (a process that is beyond the scope of this post).

Investors in a high tax bracket with at least $250,000 may consider direct indexing rather than FXAIX, as direct indexing can potentially generate even more tax savings.

FXAIX Review: A Recap

The above review of FXAIX illustrates that FXAIX is a well-constructed, low-cost and tax-efficient index fund that provides diversified exposure to the US stock market. FXAIX is a great choice in many situations if your account is at Fidelity. Personally, I would probably not consider this fund unless my account was at Fidelity.

FAQ’s

VTI Review: Is VTI a Good Investment?

The Vanguard Total Stock Market ETF (symbol: VTI) is one of the largest exchange-traded funds (ETFs) in the market and widely used by both individual and institutional investors. VTI is a low-cost index fund, which tracks the CRSP US Total Market. As its name implies, it seeks to provide exposure to the broad US stock market at a very low price. The fund is the core of many portfolios and the below review of VTI will evaluate why that is.

A quick reminder that this site does NOT provide investment recommendations. Fund reviews (such as this one) are for educational purposes only and are not advice or recommendations.

VTI Performance

The first thing most investors want to know about is performance, so we will start there. According to Bloomberg, since the fund’s inception 22 years ago, VTI has returned nearly 8% per year. Of course, this figure can go up or down and the returns in any single year are unlikely to be 8%. From 2002 through 2022 (21 years), VTI was up in 17 years and down in 4 years. The average return in the up years was 17.2%, while the average return in the down years was -20.5%.

VTI performance since inception, as of April 30, 2023.
Source: ThoughtfulFinance.com, Bloomberg

VTI Risks

VTI owns stocks which are more volatile than cash or bonds. While the returns are higher than cash or bonds, investors need to be prepared to stomach volatility and be able to hold for the longer-term. VTI was down over 35% during both the tech crash and during the covid pandemic. Between 2007 and 2009, the fund declined by over 55%! This is not necessarily worse than other similar funds, but it is a characteristic of stocks that investors need to be aware of.

VTI Portfolio

Fund performance is ultimately driven by a fund’s holdings and exposures, so our VTI review will examine these items.

VTI Holdings

VTI (and its underlying index) is incredibly diversified, holding nearly 4,000 stocks. This represents the vast majority of the US stock market.

VTICRSP US Total Market Index
Number of Stocks3,9073,890
Sources: ThoughtfulFinance.com, Vanguard (as of 3/31/2023)

VTI Country Exposures

VTI only owns US-based companies. Investors looking for international exposure may pair VTI with international ETFs or simply hold a global ETF.

VTI Market Cap Exposure

VTI is a “total market” fund which seeks to represent the entire US stock market, which is predominantly composed of large-caps. Even though the fund holds mid-caps and small-caps, performance is primarily driven by the large-cap exposure. This dynamic can be found by comparing VTI to SPY (a large-cap fund).

VTI
Large-Cap73%
Mid-Cap19%
Small-Cap8%
Source: ThoughtfulFinance.com, Morningstar; data as of 12/31/2022

VTI Sector Exposures

VTI is extremely diversified across sectors and mirrors the approximate weights of the broad US stock market.

VTI
Basic Materials2.65%
Consumer Cyclical9.77%
Financial Services13.93%
Real Estate3.51%
Communication Services6.71%
Energy5.15%
Industrials10.07%
Technology22.48%
Consumer Defensive6.98%
Healthcare15.69%
Utilities3.07%
Source: ThoughtfulFinance.com, Morningstar; data as of 12/31/2022

Expenses

No review of VTI would be complete without an in-depth look at the explicit and implicit costs of trading and holding VTI.

VTI Expense Ratio

VTI’s expense ratio of .03% is among the lowest of any total market funds. Even if another fund is free, three basis points is not a material difference in my opinion.

VTI Transaction Costs

ETFs are free to trade at many brokers and custodians, so VTI should be free to trade in most cases. Additionally, it is among the largest ETFs and is very liquid. The bid-ask spread of VTI is about .01%, so individual investor trades will not generally be large enough to impact or move the market.

VTI Tax Efficiency

Like most index funds, VTI is very tax-efficient. Unlike actively-managed funds, passively-managed index funds typically have less trading and lower turnover. This results in fewer taxable events and higher tax efficiency.

ETFs are typically more tax-efficient than mutual funds, due to their ability to avoid realizing capital gains through like-kind redemptions (a process that is beyond the scope of this post). VTI has never made a capital gains distribution, so VTI is about as tax-efficient as any fund can be.

Investors in a high tax bracket with at least $250,000 may consider direct indexing rather than VTI, as direct indexing can potentially generate even more tax savings.

VTI Review: A Recap

The above review of VTI illustrates that VTI is a well-constructed, low-cost and tax-efficient index fund that provides diversified exposure to the broad US stock market. VTI is a great choice in many situations and a tool that I often use personally and professionally.

FAQ’s

FNCMX vs QQQM

FNCMX vs QQQM

QQQM is a large and popular ETF. The NASDAQ Composite Index is one of the most popular and most-watched indices. Interestingly, QQQM does not track the NASDAQ Composite Index; QQQM tracks the Nasdaq 100 Index. In other words, “The NASDAQ” Composite Index is referred to in the news and displayed on websites/TV, while the NASDAQ 100 Index seems to be the benchmark for more investable funds and strategies. Despite their similar names, a comparison of the FNCMX vs QQQM reveals some major differences.

The FNCMX and QQQM have very different compositions, slightly different weights and exposures, and performance differences have reflected that.

A reminder that these are simply examples as this site does NOT provide investment recommendations.

Historical Performance: FNCMX vs QQQM

FNCMX was launched back in September 2003, while QQQM was launched many years later in October 2020. Since that time, QQQM has outperformed FNCMX by a wide margin of over 2% annually. In other words, investing in “the Qs” would have beaten investing in “the Nasdaq” by quite a bit (nearly 5.5% over just the past 2.5 years)!

Those looking to evaluate performance history before the 2000s should compare the index performance of these ETFs’ benchmarks and may want to read our post on the Nasdaq 100 vs Nasdaq Composite.

Investors looking for a larger, more liquid version of QQQM may want to check out my comparison of QQQ vs FNCMX. Investors looking for an ETF version of FNCMX should read my comparison of ONEQ vs FNCMX.

Differences between FNCMX and QQQM

Overall, the two funds are very similar, since they are both based on the same universe of stocks. FNCMX holds approximately 1,000 stocks, while QQQM owns roughly 100 stocks. The NASDAQ site publishes the index methodologies for both the Composite and 100.

Geographic Exposure

Substantially all (95%+) of each ETF is composed of US-based companies, so I will not include the usual tables of countries, market classification, and so on.

Market Cap Exposure

QQQM holds the 100 largest stocks on the NASDAQ exchange (excluding financials), so it has a much larger weighting to large-caps than FNCMX which tracks the Composite Index. However, both funds use weighting methodologies based on market-cap, so large-caps dominate each fund.

Below is an estimate of the market cap exposure as of 11/28/2022.

FNCMXQQQM
Large Cap73%93%
Mid Cap16%7%
Small Cap10%0%
Source: ThoughtfulFinance.com, Morningstar

Sector Weights

Given that FNCMX tracks a much broader index than QQQM, it is not surprising that the FNCMX owns more sectors and is less concentrated than QQQM. Below are the sector weightings of the two funds, as of 11/29/2022.

FNCMXQQQM
Basic Materials0.39%0.00%
Consumer Cyclical14.17%14.25%
Financial Services5.53%0.85%
Real Estate1.23%0.00%
Communication Services13.18%15.25%
Energy0.82%0.00%
Industrials5.28%5.07%
Technology43.31%47.92%
Consumer Defensive5.08%7.22%
Healthcare9.89%7.96%
Utilities1.14%1.48%
Source: ThoughtfulFinance.com, Morningstar

Factors to Consider

Transaction Costs

ETFs are free to trade at many brokers and custodians, including Fidelity. However, many brokers and custodians still charge commissions and/or transaction fees to buy/sell mutual funds. To my knowledge, Fidelity does not participate in the pay-to-play arrangements (with their competitor custodians) that would allow their mutual funds to trade for free on many platforms. So if an investor account is at Fidelity, it is generally free to trade FNCMX or QQQM. However, only QQQM is free to trade in many non-Fidelity accounts.

There is a bid-ask spread when trading ETFs, but this spread is typically less than .07% for QQQM and individual investor trades will not generally be large enough to “move” the market. In the case of QQQM, individual investors should not have a problem trading.

Tax Efficiency & Capital Gain Distributions

ETFs are typically more tax-efficient than mutual funds, due to their ability to avoid realizing capital gains through like-kind redemptions (a process that is beyond the scope of this post). This is true of QQQM and FNCMX, as QQQM does not make capital gains distributions and FNCMX frequently does.

Tax Loss Harvesting

My personal preference is to keep a portfolio entirely mutual funds or entirely ETFs, due to the mechanics of settlement during tax loss harvesting. If an ETF has declined in value and an investor sells it, the trade and cash proceeds will not settle for two business days (T+2). That investor may want to “replace” the sold ETF immediately and attempt to buy another ETF or mutual fund simultaneously.

However, mutual funds settle on T+1 basis, so cash for the mutual purchase would be due in one business day (which is one day earlier than the cash from the ETF sale is received). This can obviously cause problems and (even though this issue can be addressed with careful planning) I find it easier to keep accounts invested in similar vehicles. In this case, if a portfolio is all mutual funds, I might lean more towards FNCMX. If all ETFs, I might lean more towards QQQM.

Tradability

FNCMX does not have a stated minimum for purchases, although some brokerages (especially competitors of Fidelity) impose minimums. The minimum purchase size for QQQM is typically one share, although fractional shares are becoming more common. Investors can trade ETFs intraday, as well as in the pre-market and after-hours trading sessions. Investors can only buy/sell mutual funds once per day. This is not necessarily a major factor for long-term investors however.

Final Thoughts: FNCMX vs QQQM

The decision of whether to invest in FNCMX vs QQQM comes down to whether an investor wants a more fund that is more concentrated in large-cap and tech or a more diversified portfolio. As the chart of FNCMX vs QQQM shows, QQQM has done better historically although this may not hold true moving forward (especially if tech and/or large-caps fall out of favor).

FNCMX vs QQQ

FNCMX vs QQQ

QQQ is one of the largest, most popular, and most liquid ETFs. The NASDAQ Composite Index is one of the most popular and most-watched indices. Interestingly, “the Q’s” does not track the NASDAQ Composite Index; QQQ tracks the Nasdaq 100 Index. In other words, “The NASDAQ” Composite Index is referred to in the news and displayed on websites/TV, while the NASDAQ 100 Index seems to be the benchmark for more investable funds and strategies. Despite their similar names, a comparison of the FNCMX vs QQQ reveals some major differences.

The FNCMX and QQQ have very different compositions, slightly different weights and exposures, and performance differences have reflected that.

A reminder that these are simply examples as this site does NOT provide investment recommendations.

Historical Performance: FNCMX vs QQQ

QQQ is the older fund with an inception date of March 10, 1999. FNCMX was launched just a few years later in September 2003. Since that time, QQQ has outperformed FNCMX by a wide margin of over 2% annually. In other words, investing in “the Qs” would have beaten investing in “the Nasdaq” by quite a bit (nearly 335% over the past 20 years)!

Those looking to evaluate performance history before the 2000s should compare the index performance of these ETFs’ benchmarks and may want to read our post on the Nasdaq 100 vs Nasdaq Composite.

Investors looking for a lower cost version of QQQ may want to research QQQM and/or read my post comparing QQQM vs QQQ or FNCMX vs QQQM. Investors looking for an ETF version of FNCMX should read my comparison of ONEQ vs FNCMX or ONEQ vs QQQ.

Differences between FNCMX and QQQ

Overall, the two funds are very similar, since they are both based on the same universe of stocks. FNCMX holds approximately 1,000 stocks, while QQQ owns roughly 100 stocks. The NASDAQ site publishes the index methodologies for both the Composite and 100.

Geographic Exposure

Substantially all (95%+) of each ETF is composed of US-based companies, so I will not include the usual tables of countries, market classification, and so on.

Market Cap Exposure

QQQ holds the 100 largest stocks on the NASDAQ exchange (excluding financials), so it has a much larger weighting to large-caps than FNCMX which tracks the Composite Index. However, both funds use weighting methodologies based on market-cap, so large-caps dominate each fund.

Below is an estimate of the market cap exposure as of 11/28/2022.

FNCMXQQQ
Large Cap73%93%
Mid Cap16%7%
Small Cap10%0%
Source: ThoughtfulFinance.com, Morningstar

Sector Weights

Given that FNCMX tracks a much broader index than QQQ, it is not surprising that the FNCMX owns more sectors and is less concentrated than QQQ. Below are the sector weightings of the two funds, as of 11/29/2022.

FNCMXQQQ
Basic Materials0.39%0.00%
Consumer Cyclical14.17%14.25%
Financial Services5.53%0.85%
Real Estate1.23%0.00%
Communication Services13.18%15.25%
Energy0.82%0.00%
Industrials5.28%5.07%
Technology43.31%47.92%
Consumer Defensive5.08%7.22%
Healthcare9.89%7.96%
Utilities1.14%1.48%
Source: ThoughtfulFinance.com, Morningstar

Factors to Consider

Transaction Costs

ETFs are free to trade at many brokers and custodians, including Fidelity. However, many brokers and custodians still charge commissions and/or transaction fees to buy/sell mutual funds. To my knowledge, Fidelity does not participate in the pay-to-play arrangements (with their competitor custodians) that would allow their mutual funds to trade for free on many platforms. So if an investor account is at Fidelity, it is generally free to trade FNCMX or QQQ. However, only QQQ is free to trade in many non-Fidelity accounts.

There is a bid-ask spread when trading ETFs, but this spread is typically less than .01% for QQQ and individual investor trades will not generally be large enough to “move” the market. In the case of QQQ, individual investors should not have a problem trading.

Tax Efficiency & Capital Gain Distributions

ETFs are typically more tax-efficient than mutual funds, due to their ability to avoid realizing capital gains through like-kind redemptions (a process that is beyond the scope of this post). This is true of QQQ and FNCMX, as QQQ does not make capital gains distributions and FNCMX frequently does.

Tax Loss Harvesting

My personal preference is to keep a portfolio entirely mutual funds or entirely ETFs, due to the mechanics of settlement during tax loss harvesting. If an ETF has declined in value and an investor sells it, the trade and cash proceeds will not settle for two business days (T+2). That investor may want to “replace” the sold ETF immediately and attempt to buy another ETF or mutual fund simultaneously.

However, mutual funds settle on T+1 basis, so cash for the mutual purchase would be due in one business day (which is one day earlier than the cash from the ETF sale is received). This can obviously cause problems and (even though this issue can be addressed with careful planning) I find it easier to keep accounts invested in similar vehicles. In this case, if a portfolio is all mutual funds, I might lean more towards FNCMX. If all ETFs, I might lean more towards QQQ.

Tradability

FNCMX does not have a stated minimum for purchases, although some brokerages (especially competitors of Fidelity) impose minimums. The minimum purchase size for QQQ is typically one share, although fractional shares are becoming more common. Investors can trade ETFs intraday, as well as in the pre-market and after-hours trading sessions. Investors can only buy/sell mutual funds once per day. This is not necessarily a major factor for long-term investors however.

Final Thoughts: FNCMX vs QQQ

The decision of whether to invest in FNCMX vs QQQ comes down to whether an investor wants a more fund that is more concentrated in large-cap and tech or a more diversified portfolio. As the chart of FNCMX vs QQQ shows, QQQ has done better historically although this may not hold true moving forward (especially if tech and/or large-caps fall out of favor).

FNCMX vs ONEQ

FNCMX vs ONEQ

The Fidelity Nasdaq Composite Index Fund (FNCMX) and the Fidelity Nasdaq Composite ETF (ONEQ) are two of the largest index funds that track the Nasdaq Composite. Both FNCMX and ONEQ track the well-known Nasdaq Composite index. The funds look very similar and many investors ask what is the difference between FNCMX and ONEQ? The below post will compare FNCMX vs ONEQ.

The Short Answer

The main difference is that FNCMX is a mutual fund and ONEQ is an ETF; however investors should consider several other factors when deciding which is best.

A quick reminder that this site does NOT provide investment recommendations. Fund comparisons (such as this one) are not conducted to identify the “best” fund (since that will vary from investor to investor based on investor-specific factors). Rather, these fund comparison posts are designed to identify and distinguish between the fund details that matter versus the ones that don’t.

The Long Answer

Historical Performance: FNCMX vs ONEQ

Both ONEQ and FNCMX were launched back in September 2003. Since their common inception date, the two funds have performed nearly identically, with a difference of just .09% annually! The cumulative performance difference between these two funds has only been about 12% (over a 20+ year timeframe)! Thus, from a performance perspective, I would consider these two funds interchangeable.

Differences between FNCMX vs ONEQ

Both FNCMX and ONEQ track the Nasdaq Composite, so I will not delve into differences in geographic exposures, sector weights, or market cap coverage. For all intents and purposes, the portfolios are identical.

Factors to Consider

Transaction Costs

ETFs are free to trade at many brokers and custodians, including Fidelity. However, many brokers and custodians still charge commissions and/or transaction fees to buy/sell mutual funds. To my knowledge, Fidelity does not participate in the pay-to-play arrangements (with their competitor custodians) that would allow their mutual funds to trade for free on many platforms. So if an investor account is at Fidelity, it is generally free to trade FNCMX or ONEQ. However, only ONEQ is free to trade in many non-Fidelity accounts.

There is a bid-ask spread when trading ETFs, but this spread is typically less than .07% for ONEQ and individual investor trades will not generally be large enough to “move” the market. In the case of ONEQ, individual investors should not have a problem trading.

Tax Efficiency & Capital Gain Distributions

ETFs are typically more tax-efficient than mutual funds, due to their ability to avoid realizing capital gains through like-kind redemptions (a process that is beyond the scope of this post). This is true of ONEQ and FNCMX, as ONEQ does not make capital gains distributions and FNCMX frequently does.

Tax Loss Harvesting

My personal preference is to keep a portfolio entirely mutual funds or entirely ETFs, due to the mechanics of settlement during tax loss harvesting. If an ETF has declined in value and an investor sells it, the trade and cash proceeds will not settle for two business days (T+2). That investor may want to “replace” the sold ETF immediately and attempt to buy another ETF or mutual fund simultaneously.

However, mutual funds settle on T+1 basis, so cash for the mutual purchase would be due in one business day (which is one day earlier than the cash from the ETF sale is received). This can obviously cause problems and (even though this issue can be addressed with careful planning) I find it easier to keep accounts invested in similar vehicles. In this case, if a portfolio is all mutual funds, I might lean more towards FNCMX. If all ETFs, I might lean more towards ONEQ.

On this topic, investors may want to avoid using these two funds as tax loss harvesting substitutes for one another since they could be considered “substantially identical.”

Tradability

FNCMX does not have a stated minimum for purchases, although some brokerages (especially competitors of Fidelity) impose minimums. The minimum purchase size for ONEQ is typically one share, although fractional shares are becoming more common. Investors can trade ETFs intraday, as well as in the pre-market and after-hours trading sessions. Investors can only buy/sell mutual funds once per day. This is not necessarily a major factor for long-term investors however.

Final Thoughts: FNCMX vs ONEQ

Both FNCMX and ONEQ are large, Nasdaq Composite index funds sponsored and managed by Fidelity. Performance has been nearly identical. I view FNCMX and ONEQ as essentially interchangeable and would not spend too much energy trying to decide which one is “better.” If I was investing in a taxable account, I would probably opt for ONEQ due to the tax efficiency edge.

However, there are some situations that may call for one fund versus another. For instance, many custodians offer free ETF trades, but charge trading fees or redemption fees for mutual funds. So I might select FNCMX or ONEQ solely based on where my account is held or whether I’m investing taxable vs retirement dollars. Despite these considerations, these two funds are very similar for all intents and purposes.

ONEQ vs QQQM

ONEQ vs QQQM

QQQM is a large, liquid Nasdaq 100 index ETF that many investors use (often in lieu of the larger and more expensive ETF QQQ). The NASDAQ Composite Index is one of the most popular and most-watched indices. Interestingly, QQQM does not track the NASDAQ Composite Index; QQQM tracks the Nasdaq 100 Index. In other words, “The NASDAQ” Composite Index is referred to in the news and displayed on websites/TV, while the NASDAQ 100 Index seems to be the benchmark for more investable funds and strategies. Despite their similar names, a comparison of the ONEQ vs QQQM reveals some major differences.

The ONEQ and QQQM have very different compositions, slightly different weights and exposures, and performance differences have reflected that.

A reminder that these are simply examples as this site does NOT provide investment recommendations.

Historical Performance: ONEQ vs QQQM

ONEQ is the older ETF with an inception date of October 1, 2003. QQQM was launched many years later in October 2020. Since that time, QQQM has outperformed ONEQ by a wide margin of nearly 2% annually. In other words, investing in QQQM would have beaten investing in “the Nasdaq” by quite a bit (over 4.5% over the past two and half years)!

Those looking to evaluate performance history before the 2000s should compare the index performance of these ETFs’ benchmarks and may want to read our post on the Nasdaq 100 vs Nasdaq Composite. Interested readers may also want to check out my post on QQQ vs QQQM or QQQ vs ONEQ. Investors looking for a mutual fund version of ONEQ should read my comparison of FNCMX vs QQQM.

Differences between ONEQ and QQQM

Overall, the two ETFs are very similar, since they are both based on the same universe of stocks. ONEQ holds approximately 1,000 stocks, while QQQM owns roughly 100 stocks. The NASDAQ site publishes the index methodologies for both the Composite and 100.

Geographic Exposure

Substantially all (95%+) of each ETF is composed of US-based companies, so I will not include the usual tables of countries, market classification, and so on.

Market Cap Exposure

QQQM holds the 100 largest stocks on the NASDAQ exchange (excluding financials), so it has a much larger weighting to large-caps than ONEQ which tracks the Composite Index. However, both ETFs use weighting methodologies based on market-cap, so large-caps dominate each ETF.

Below is an estimate of the market cap exposure as of 11/28/2022.

ONEQQQQM
Large Cap73%93%
Mid Cap16%7%
Small Cap10%0%
Source: ThoughtfulFinance.com, Morningstar

Sector Weights

Given that ONEQ tracks a much broader index than QQQM, it is not surprising that the ONEQ owns more sectors and is less concentrated than QQQM. Below are the sector weightings of the two ETFs, as of 11/29/2022.

ONEQQQQM
Basic Materials0.39%0.00%
Consumer Cyclical14.17%14.25%
Financial Services5.53%0.85%
Real Estate1.23%0.00%
Communication Services13.18%15.25%
Energy0.82%0.00%
Industrials5.28%5.07%
Technology43.31%47.92%
Consumer Defensive5.08%7.22%
Healthcare9.89%7.96%
Utilities1.14%1.48%
Source: ThoughtfulFinance.com, Morningstar

Final Thoughts: ONEQ vs QQQM

The decision of whether to invest in ONEQ vs QQQM comes down to whether an investor wants a more fund that is more concentrated in large-cap and tech or a more diversified portfolio. As the chart of ONEQ vs QQQM shows, QQQM has done better historically although this may not hold true moving forward (especially if tech and/or large-caps fall out of favor).

QQQ vs QQQM

QQQ vs QQQM

The Invesco QQQ Trust (QQQ) and the Invesco Nasdaq 100 ETF (QQQM) are two of the largest ETFs in existence and both are sponsored by Invesco. As their names suggest, QQQ and QQQM are a core holding of many portfolios. Many investors compare QQQ vs QQQM in order to decide which should be the foundation of their portfolio.

A quick reminder that this site does NOT provide investment recommendations. Fund comparisons (such as this one) are not conducted to identify the “best” fund (since that will vary from investor to investor based on investor-specific factors). Rather, these fund comparison posts are designed to identify and distinguish between the fund details that matter versus the ones that don’t.

The Short Answer

QQQ and QQQM are nearly identical is almost every way, although QQQM is slightly less expensive. In my opinion, 5 basis points is not material and I consider these two funds identical and interchangeable. The only exception would be if someone is utilizing options, as QQQ has a much more active options market.

The Longer Answer

These funds are identical in nearly every way, except QQQ is just slightly more expensive.

History of QQQ and QQQM

QQQ was the first Nasdaq 100 ETF (as well as the first tech-oriented ETF) to launch, back in 1999. This first mover advantage gave it an edge in accumulating assets under management (AUM) and became the liquid vehicle of choice for traders. Even as other Nasdaq and tech-oriented ETFs launched and competitors engaged in cutting fees, QQQ was able to command premium fees due its size and liquidity. However, other sponsors were able to begin capturing market share with ever decreasing costs. Invesco needed to respond with a lower cost option, but did not want to sacrifice their golden goose QQQ. So rather than cut QQQ’s fees, they launched QQQM at a lower fee level. Essentially, they created QQQM to compete with QQQ’s competitors without giving up the higher fees that QQQ was collecting. This is similar to what iShares did with EEM and IEMG or EFA and IEFA.

Investors looking for Nasdaq Composite exposure rather than Nasdaq 100 exposure may interested in my post comparing ONEQ vs FNCMX.

Historical Performance: QQQ vs QQQM

Since QQQM’s launch in October 2020, it has outperformed QQQ by .03% annually. This has mostly been driven by the fee differential of .05%. Again, I view these two funds are identical.

Differences Between QQQ and QQQM

These two funds are identical in nearly every way.

Geographic Exposure

QQQ and QQQM track the same Nasdaq 100 index and substantially all of the holdings are US-based companies.

Market Cap Exposure

The market cap exposures of QQQ and QQQM are identical, which is not surprising since they track the same index.

QQQ & QQQM
Large Cap94%
Mid Cap6%
Small Cap0%
Source: ThoughtfulFinance.com, Morningstar.com

Sector Weights

The sector weights between QQQ and QQQM are identical as well.

QQQ & QQQM
Basic Materials0.00%
Consumer Cyclical14.89%
Financial Services0.66%
Real Estate0.22%
Communication Services16.51%
Energy0.41%
Industrials3.89%
Technology49.80%
Consumer Defensive5.89%
Healthcare6.57%
Utilities1.16%
Source: ThoughtfulFinance.com, Morningstar.com

Transaction Costs

Both QQQ and QQQM are free to trade on many platforms. These are two of the largest and most liquid ETFs, so the bid-ask spreads are extremely low too.

Expenses

QQQ sports an .20% expense ratio, while QQQM has a slightly lower expense ratio at .15%. In other words, QQQ is 33% more expensive or 5 basis points more expensive than QQQM. That being said, I do consider 5 basis points to be a material cost or difference in this case.

Tax Efficiency & Capital Gain Distributions

As with most equity ETFs, neither QQQ nor QQQM makes capital gains distributions. Therefore, both funds are about as tax-efficient as can be.

Options Strategies

QQQ has a much more liquid options market, so any options-related strategies may call for QQQ rather than QQQM.

Final Thoughts: QQQ vs QQQM

Both QQQ and QQQM are large, core funds sponsored and managed by one of the largest asset managers in the world. Additionally, their underlying portfolios are identical and the two funds move in sync. Unless an investor is utilizing an options strategy, I do not think it matters whether someone chooses QQQ or QQQM.

Further Reading

Investors looking for a Nasdaq Composite index vehicle (rather than a Nasdaq 100 index fund) should read my post comparing QQQ and ONEQ or the lower-cost version QQQM vs ONEQ.

Scroll to Top