FNCMX vs QQQ
QQQ is one of the largest, most popular, and most liquid ETFs. The NASDAQ Composite Index is one of the most popular and most-watched indices. Interestingly, “the Q’s” does not track the NASDAQ Composite Index; QQQ tracks the Nasdaq 100 Index. In other words, “The NASDAQ” Composite Index is referred to in the news and displayed on websites/TV, while the NASDAQ 100 Index seems to be the benchmark for more investable funds and strategies. Despite their similar names, a comparison of the FNCMX vs QQQ reveals some major differences.
The FNCMX and QQQ have very different compositions, slightly different weights and exposures, and performance differences have reflected that.
A reminder that these are simply examples as this site does NOT provide investment recommendations.
Historical Performance: FNCMX vs QQQ
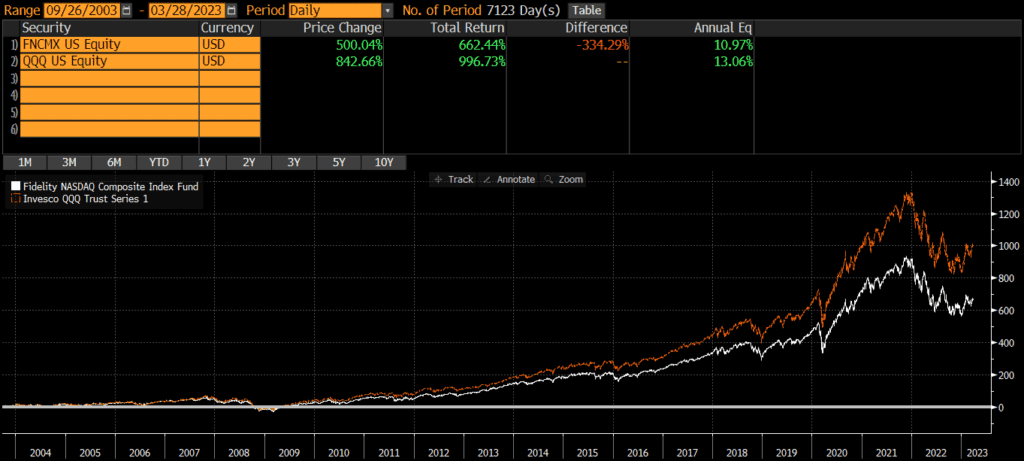
QQQ is the older fund with an inception date of March 10, 1999. FNCMX was launched just a few years later in September 2003. Since that time, QQQ has outperformed FNCMX by a wide margin of over 2% annually. In other words, investing in “the Qs” would have beaten investing in “the Nasdaq” by quite a bit (nearly 335% over the past 20 years)!
Those looking to evaluate performance history before the 2000s should compare the index performance of these ETFs’ benchmarks and may want to read our post on the Nasdaq 100 vs Nasdaq Composite.
Investors looking for a lower cost version of QQQ may want to research QQQM and/or read my post comparing QQQM vs QQQ or FNCMX vs QQQM. Investors looking for an ETF version of FNCMX should read my comparison of ONEQ vs FNCMX or ONEQ vs QQQ.
Differences between FNCMX and QQQ
Overall, the two funds are very similar, since they are both based on the same universe of stocks. FNCMX holds approximately 1,000 stocks, while QQQ owns roughly 100 stocks. The NASDAQ site publishes the index methodologies for both the Composite and 100.
Geographic Exposure
Substantially all (95%+) of each ETF is composed of US-based companies, so I will not include the usual tables of countries, market classification, and so on.
Market Cap Exposure
QQQ holds the 100 largest stocks on the NASDAQ exchange (excluding financials), so it has a much larger weighting to large-caps than FNCMX which tracks the Composite Index. However, both funds use weighting methodologies based on market-cap, so large-caps dominate each fund.
Below is an estimate of the market cap exposure as of 11/28/2022.
| FNCMX | QQQ | |
| Large Cap | 73% | 93% |
| Mid Cap | 16% | 7% |
| Small Cap | 10% | 0% |
Sector Weights
Given that FNCMX tracks a much broader index than QQQ, it is not surprising that the FNCMX owns more sectors and is less concentrated than QQQ. Below are the sector weightings of the two funds, as of 11/29/2022.
| FNCMX | QQQ | |
| Basic Materials | 0.39% | 0.00% |
| Consumer Cyclical | 14.17% | 14.25% |
| Financial Services | 5.53% | 0.85% |
| Real Estate | 1.23% | 0.00% |
| Communication Services | 13.18% | 15.25% |
| Energy | 0.82% | 0.00% |
| Industrials | 5.28% | 5.07% |
| Technology | 43.31% | 47.92% |
| Consumer Defensive | 5.08% | 7.22% |
| Healthcare | 9.89% | 7.96% |
| Utilities | 1.14% | 1.48% |
Factors to Consider
Transaction Costs
ETFs are free to trade at many brokers and custodians, including Fidelity. However, many brokers and custodians still charge commissions and/or transaction fees to buy/sell mutual funds. To my knowledge, Fidelity does not participate in the pay-to-play arrangements (with their competitor custodians) that would allow their mutual funds to trade for free on many platforms. So if an investor account is at Fidelity, it is generally free to trade FNCMX or QQQ. However, only QQQ is free to trade in many non-Fidelity accounts.
There is a bid-ask spread when trading ETFs, but this spread is typically less than .01% for QQQ and individual investor trades will not generally be large enough to “move” the market. In the case of QQQ, individual investors should not have a problem trading.
Tax Efficiency & Capital Gain Distributions
ETFs are typically more tax-efficient than mutual funds, due to their ability to avoid realizing capital gains through like-kind redemptions (a process that is beyond the scope of this post). This is true of QQQ and FNCMX, as QQQ does not make capital gains distributions and FNCMX frequently does.
Tax Loss Harvesting
My personal preference is to keep a portfolio entirely mutual funds or entirely ETFs, due to the mechanics of settlement during tax loss harvesting. If an ETF has declined in value and an investor sells it, the trade and cash proceeds will not settle for two business days (T+2). That investor may want to “replace” the sold ETF immediately and attempt to buy another ETF or mutual fund simultaneously.
However, mutual funds settle on T+1 basis, so cash for the mutual purchase would be due in one business day (which is one day earlier than the cash from the ETF sale is received). This can obviously cause problems and (even though this issue can be addressed with careful planning) I find it easier to keep accounts invested in similar vehicles. In this case, if a portfolio is all mutual funds, I might lean more towards FNCMX. If all ETFs, I might lean more towards QQQ.
Tradability
FNCMX does not have a stated minimum for purchases, although some brokerages (especially competitors of Fidelity) impose minimums. The minimum purchase size for QQQ is typically one share, although fractional shares are becoming more common. Investors can trade ETFs intraday, as well as in the pre-market and after-hours trading sessions. Investors can only buy/sell mutual funds once per day. This is not necessarily a major factor for long-term investors however.
Final Thoughts: FNCMX vs QQQ
The decision of whether to invest in FNCMX vs QQQ comes down to whether an investor wants a more fund that is more concentrated in large-cap and tech or a more diversified portfolio. As the chart of FNCMX vs QQQ shows, QQQ has done better historically although this may not hold true moving forward (especially if tech and/or large-caps fall out of favor).