Fund Review

SNAXX Review: Is SNAXX a Good Investment?

Investors are increasingly considering money market mutual funds as a place to park cash and earn higher yields. The Schwab Value Advantage Money Fund® – Ultra Shares (symbol SNAXX) is one of the largest money market funds in the market today and many investors are asking is SNAXX a good investment?

The short answer

SNAXX is a good investment for many investors. It offers a competitive yield, has no minimum investment, and is managed by one of the largest asset managers.

Those allocating less than $1M or in the highest tax brackets may need/want to use funds with lower minimums or muni money markets though.

A reminder that this site does not make recommendations. Our goal is to help educate investors and empower them to make good decisions.

Current Yields for SNAXX

The current 7 day yield is a standardized yield metric for money market mutual funds and the 7 day yield for SNAXX can be found on the fund’s webpage at: https://www.schwabassetmanagement.com/products/snaxx.

What rate is SNAXX paying?

The current interest rate for SNAXX (and other Schwab money markets) can be found on Schwab’s money market page.

SNAXX Details

The expense ratio is .19% for the ultra shares and .34% for the investor shares. Neither fund charges a load or 12b-1 fees.

SNAXX has a minimum investment of $1 million. My observation is that investors can keep SNAXX even if they sell and their balance falls below $1 million. The $1 million minimum seems to only apply to the initial purchase.

I have not checked every brokerage, but SNAXX is generally only available to clients of Charles Schwab.

Like most money market mutual funds, investors can sell SNAXX at any time.

SNAXX Risks

Hypothetically, an investor could lose money with SNAXX, but I personally do not think that is a realistic risk as I believe the fund sponsor or the federal government would intervene if that were about to happen. Technically, it is possible to lose money in SNAXX though.

As of June 30, 2023, the fund had nearly $210 billion in net assets. This was composed of approximately $130 billion in the investor shares and $80 billion in ultra shares.

Is SNAXX FDIC Insured?

No, neither SNAXX nor most money market mutual funds are FDIC insured.

Holdings

The largest holding is repurchase agreements (repos) at 42.6%, followed by CDs at 24.5%, and commercial paper at 18.4%. The vast majority of the fund’s holdings have a maturity of less than one week (81%).

Low Balances

Investors allocating less than $1 million may want to consider the “investor” share class of the fund, whose symbol is SWVXX.

Tax Considerations

SNAXX is a “prime fund” which means that it can invest in both government and non-government financial instruments. However, taxable investors may find better after-tax yields in government or municipal (muni) money market funds, both of which offer tax benefits that may improve investors’ after-tax yield.

Government and Treasury Money Market Funds

Most states have an income tax. However, interest from Treasuries is exempt from state tax. Therefore, investors in states with income tax may be better off with a government money market fund that only invests in government-backed securities.

Muni Money Market Funds

Investors subject to higher tax rates may consider municipal (muni) money market funds due to the fact the interest is typically exempt from federal income tax (and often from state tax too!).

The caveat with muni money market funds though is that the yields can move up and down A LOT. Therefore, the stated yield that an investor looks up on any given day is not necessarily indicative of the future return. To understand why, read my post on muni money market yields.

Rather than expecting a muni money market fund’s stated yield, I encourage investors to expect the trailing average yield (over the past few weeks). Generally speaking, the after tax returns of munis will only be higher than non-muni money markets for those in the highest tax brackets.

Is SNAXX a Good Investment?

Overall, SNAXX is a good investment for many situations (and I have used it many times). Those investing high balances or those who are subject to high tax rates may want to consider other funds though.

SWVXX Review: Is SWVXX a Good Investment?

Investors are increasingly considering money market mutual funds as a place to park cash and earn higher yields. The Schwab Value Advantage Money Fund® – Investor Shares (symbol SWVXX) is one of the largest money market funds in the market today and many investors are asking is SWVXX a good investment?

The short answer

SWVXX is a good investment for many investors. It offers a competitive yield, has no minimum investment, and is managed by one of the largest asset managers.

Those allocating more than $1M or in the highest tax brackets may want to use funds with higher minimums or muni money markets though.

A reminder that this site does not make recommendations. Our goal is to help educate investors and empower them to make good decisions.

Current Yields for SWVXX

The current 7 day yield is a standardized yield metric for money market mutual funds and the 7 day yield for SWVXX can be found on the fund’s webpage at: https://www.schwabassetmanagement.com/products/snaxx.

What rate is SNAXX paying?

The current interest rate for SWVXX (and other Schwab money markets) can be found on Schwab’s money market page.

SWVXX Details

The expense ratio is .34% for the investor shares and .19% for the ultra shares. Neither fund charges a load or 12b-1 fees.

SWVXX has no minimum investment and investors can invest as little as one cent.

I have not checked every brokerage, but SWVXX is generally only available to clients of Charles Schwab.

Like most money market mutual funds, investors can sell SWVXX at any time.

SWVXX Risks

Hypothetically, an investor could lose money with SWVXX, but I personally do not think that is a realistic risk as I believe the fund sponsor or the federal government would intervene if that were about to happen. Technically, it is possible to lose money in SWVXX though.

As of June 30, 2023, the fund had nearly $210 billion in net assets. This was composed of approximately $130 billion in the investor shares and $80 billion in ultra shares.

IS SWVXX FDIC Insured?

No, neither SWVXX nor most money market mutual funds are FDIC insured.

Holdings

The largest holding is repurchase agreements (repos) at 42.6%, followed by CDs at 24.5%, and commercial paper at 18.4%. The vast majority of the fund’s holdings have a maturity of less than one week (81%).

High Balances

Investors allocating more than $1 million may want to consider the “ultra” share class of the fund, whose symbol is SNAXX.

Tax Considerations

SWVXX is a “prime fund” which means that it can invest in both government and non-government financial instruments. However, taxable investors may find better after-tax yields in government or municipal (muni) money market funds, both of which offer tax benefits that may improve investors’ after-tax yield.

Government and Treasury Money Market Funds

Most states have an income tax. However, interest from Treasuries is exempt from state tax. Therefore, investors in states with income tax may be better off with a government money market fund that only invests in government-backed securities.

Muni Money Market Funds

Investors subject to higher tax rates may consider municipal (muni) money market funds due to the fact the interest is typically exempt from federal income tax (and often from state tax too!).

The caveat with muni money market funds though is that the yields can move up and down A LOT. Therefore, the stated yield that an investor looks up on any given day is not necessarily indicative of the future return. To understand why, read my post on muni money market yields.

Rather than expecting a muni money market fund’s stated yield, I encourage investors to expect the trailing average yield (over the past few weeks). Generally speaking, the after tax returns of munis will only be higher than non-muni money markets for those in the highest tax brackets.

Is SWVXX a Good Investment?

Overall, SWVXX is a good investment for many situations (and I have used it many times). Those investing high balances or those who are subject to high tax rates may want to consider other funds though.
SCHD vs S&P 500 Index: SCHD and SP500 Compared

The Schwab US Dividend Equity ETF (SCHD) is a popular dividend-oriented ETF, while the S&P 500 (or SP500 as some call it) is perhaps the best known index and benchmark in the world. Many investor compare their funds (such as SCHD) vs the S&P 500 index as it is the de facto benchmark for US equity exposure. While the S&P 500 is composed of large- and mid-cap stocks in the US, SCHD targets stocks that meet certain dividend-related requirements (as they are defined by the index provider). Even though the S&P 500 is an index, there are many related index funds out there.

A quick reminder that this site does NOT provide investment recommendations. Fund comparisons (such as this one) are not conducted to identify the “best” fund (since that will vary from investor to investor based on investor-specific factors). Rather, these fund comparison posts are designed to identify and distinguish between the fund details that matter versus the ones that don’t.

The Short Answer

SCHD only owns stocks that meet the Dow Jones U.S. Dividend 100â„¢ Index’s requirements, which has the effect of tilting the portfolio towards the value factor. The S&P 500 is composed of a more diverse portfolio including growth stocks. Historical performance of SCHD vs the S&P 500 has been similar, but will depend on how the value and growth factors perform moving forward.

Importantly, the S&P 500 is an index and cannot be invested in directly (but there are index funds that track it). Interested readers may want to read a review of SCHD vs SPY.

The Long Answer

Historical Performance: SCHD vs the SP500

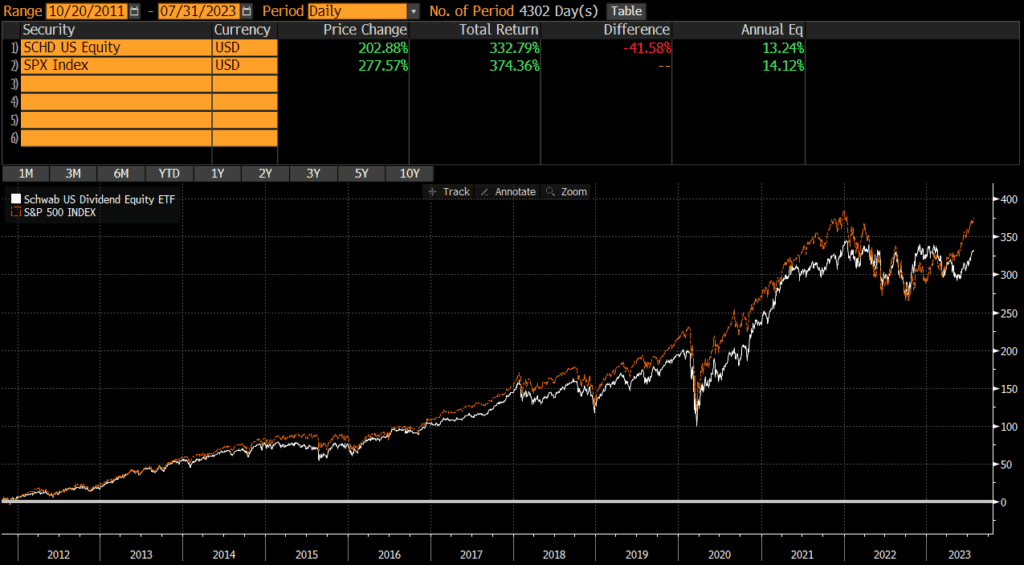
Since SCHD’s inception date in 2011, performance has been relatively similar with an annualized difference of roughly .9%. This has compounded over time though and the cumulative performance differential is about 42%. Of course, it is important to note that SCHD is exposed to fees, while the S&P 500 is not an investment vehicle and has no costs.

As the SCHD vs the S&P 500 chart of historical performance illustrates, the S&P 500 has outperformed since inception. However, SCHD has outperformed over several periods of time including the calendar year of 2022 when the growth factor really underperformed the value factor.

Differences Between SCHD and the S&P 500

The primary difference between these two funds is that SCHD tracks the Dow Jones U.S. Dividend 100â„¢ Index, while the S&P 500 is its own index.

Geographic Exposure

Both SCHD and the S&P 500 are essentially 100% US stocks, so I will not dig into country exposures or market classification here. For all intents and purposes, the two have identical country exposures.

Market Cap Exposure

Overall, the market cap exposures of SCHD and the S&P 500 are relatively similar.

SCHDthe S&P 500
Large Cap78%82%
Mid Cap17%18%
Small Cap4%0%
Source: ThoughtfulFinance.com, Morningstar (as of 5/30/2023)

Sector Weights

There are some significant differences in sector weights, which makes sense based on the fact that SCHD is targeting high dividends and some sectors meet this criteria more easily.

SCHDthe S&P 500
Basic Materials1.95%2.26%
Consumer Cyclical9.66%10.75%
Financial Services14.42%12.08%
Real Estate0.00%2.48%
Communication Services4.63%8.58%
Energy9.06%4.21%
Industrials17.48%8.26%
Technology13.34%28.55%
Consumer Defensive13.49%6.62%
Health Care15.69%13.58%
Utilities0.28%2.61%
Source: ThoughtfulFinance.com, Morningstar (as of 5/30/2023)

Expenses

SCHD’s expense ratio is .06%, while the S&P 500’s has no expense ratio because it is an index.

Transaction Costs

ETFs are free to trade at many brokers and custodians, so both SCHD should be free to trade in most cases. Additionally, SCHD is among the largest ETFs and is very liquid. The bid-ask spread of both SCHD is very low at .01%, so individual investor trades will not generally be large enough to “move” the market.

Tax Efficiency & Capital Gain Distributions

ETFs are typically more tax-efficient than mutual funds, due to their ability to avoid realizing capital gains through like-kind redemptions (a process that is beyond the scope of this post). SCHD has never made a capital gains distribution (nor do I expect it to moving forward). Thus, SCHD funds is about as tax-efficient as any fund can be and is fund is appropriate in taxable accounts, although the dividends do create a very slight tax drag.

Final Thoughts: SCHD vs the S&P 500

SCHD does what it is designed to do. I would not personally use dividend ETFs as the core of a portfolio, but that is a personal opinion and not necessarily the consensus. For a core position, I would personally choose an S&P 500 index fund over SCHD (such as IVV, which I like more than SCHD). However, investors looking for a satellite position in order to tilt their portfolio towards value could do a lot worse than using SCHD. At the end of the day, this fund and index are not necessarily comparable because they have different exposures and one in investable and the other is not.

Frequently Asked Questions (FAQs)

QYLD ETF Review: Is QYLD a Good Investment?

The Global X Nasdaq 100 Covered Call ETF (symbol: QYLD) is one of the largest covered call exchange-traded funds (ETFs) in the market and is quite popular with retail investors. QYLD employs a covered call strategy, which attempts to generate income by selling the upside potential of its portfolio. While covered calls may make sense in certain situations, my observation is that individual investors do not typically fully understand the dynamics of the strategy or the trade-offs in terms of risk and return. Interestingly, QYLD overlays its strategy on the Nasdaq 100 index, rather than the S&P 500 (like its sibling XYLD). Hopefully, the below can help investors evaluate whether QYLD is a good investment for their portfolio.

A quick reminder that this site does NOT provide investment recommendations. Fund reviews (such as this one) are for educational purposes only and are not advice or recommendations.

The Short Answer

QYLD may be a good tool in rare specific situations, but QYLD is not a good investment for many other situations. Covered call strategies (including QYLD) carry a specific and well-known set of tradeoffs that many investors do not necessarily fully understand or consider the implications. I would not recommend QYLD to most investors.

QYLD Performance

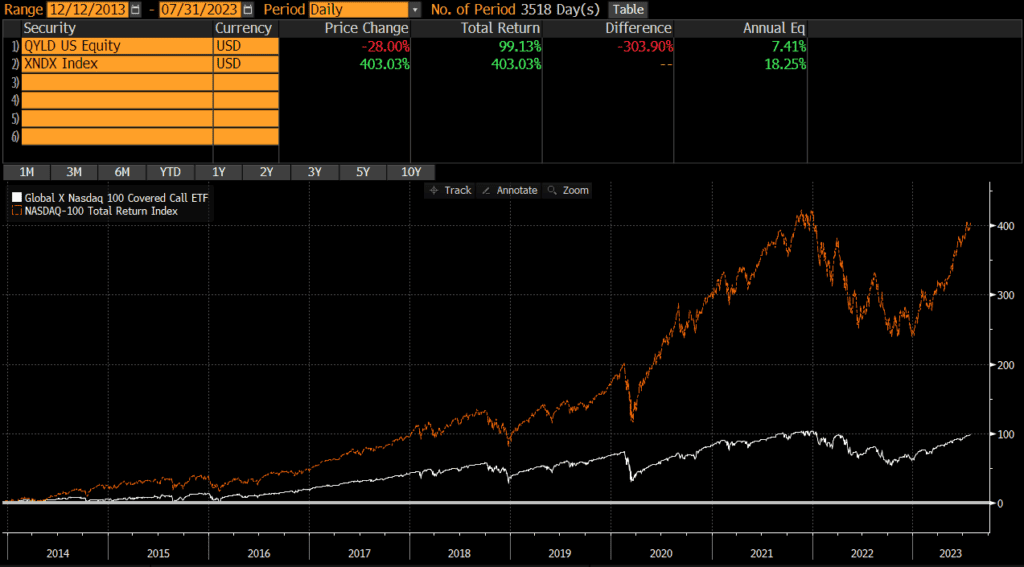
The first thing most investors want to know about is performance, so we will start there. According to Bloomberg, since the fund’s inception in late 2013, QYLD has returned 7.41% annualized which is below the Nasdaq 100 Index’s performance of 18.25% over the same time period. It is important to note that the Nasdaq 100 is different than the Nasdaq Composite Index.

Source: ThoughtfulFinance.com, Bloomberg

As the QYLD chart of historical performance below shows, QYLD has underperformed the Nasdaq 100 by a large amount (and even more so on an after-tax basis). This is not surprising and exactly what I would expect from a covered call fund as the strategy is to sell upside potential in exchange for cash which helps offset downside losses. So I would expect QYLD to underperform when equity markets are doing well, outperform when equities are volatile, and generally underperform over longer time horizons (especially on an after-tax basis).

Of course, covered call strategies tend to outperform during volatile periods, so 2022 was a bright spot for QYLD despite underperforming for a decade. That being said, it began underperforming again in the first half of 2023 and the total return between the two is essentially identical.

In terms of risk and drawdowns, QYLD’s downside has been slightly more limited (as has its upside though). The peak-to-trough decline of QYLD in 2022 was roughly -24% versus approximately 34% for the Nasdaq 100 during the same period.

QYLD Risks

QYLD owns stocks which are more volatile than cash or bonds. While the returns are higher than cash or bonds, investors need to be prepared to stomach volatility and be able to hold for the longer-term. QYLD was down over 24% at one point in 2022. This is not necessarily worse than other similar funds (over the same time period), but it is a characteristic of stocks that investors need to be aware of.

QYLD Portfolio

Fund performance is ultimately driven by a fund’s holdings and exposures, so our QYLD review will examine these items.

QYLD Holdings

QYLD (and its underlying index) is relatively well diversified in terms of number of holdings.

QYLDNASDAQ 100
Number of Stocks103100
Sources: ThoughtfulFinance.com, Morningstar (as of 7/27/2023)

QYLD Country Exposures

QYLD primarily owns US-based companies. Investors looking for international exposure may pair QYLD with international ETFs or simply hold a global ETF.

QYLD Market Cap Exposure

QYLD is primarily a large-cap fund which seeks to represent the largest US stocks listed on the Nasdaq. Even though the fund holds some mid-caps, performance is primarily driven by the large-cap exposure.

QYLD
Large-Cap91%
Mid-Cap10%
Small-Cap0%
Source: ThoughtfulFinance.com, Morningstar; data as of 7/27/2023

QYLD Sector Exposures

Similar to the underlying Nasdaq 100 index, QYLD is quite concentrated in terms of sectors.

QYLD
Basic Materials0.00%
Consumer Cyclical13.77%
Financial Services0.59%
Real Estate0.27%
Communication Services15.36%
Energy0.52%
Industrials4.88%
Technology49.64%
Consumer Defensive6.57%
Healthcare7.16%
Utilities1.23%
Source: ThoughtfulFinance.com, Morningstar; data as of 7/27/2023

Expenses

No review of QYLD would be complete without an in-depth look at the explicit and implicit costs of trading and holding QYLD.

QYLD Expense Ratio

QYLD’s expense ratio of .60% is quite a bit higher than most domestic index ETFs, but this is to be expected for a more active strategy.

QYLD Transaction Costs

ETFs are free to trade at many brokers and custodians, so QYLD should be free to trade in most cases. Additionally, it is among the largest ETFs and is very liquid. The bid-ask spread of QYLD is about .06%, so individual investor trades will not generally be large enough to impact or move the market.

QYLD Tax Efficiency

QYLD is not very tax-efficient as the premiums received from selling calls are taxed at ordinary income rates. While some investors may not mind receiving income in lieu of potential upside, this is akin to converting capital gains (from appreciation) into ordinary income. Of course, a covered call strategy will lose less money if the market declines, but covered call strategies (including QYLD) have a large tax drag.

ETFs are typically more tax-efficient than mutual funds, due to their ability to avoid realizing capital gains through like-kind redemptions (a process that is beyond the scope of this post). However, QYLD has made capital gains distributions and I would not necessarily say that the fund is tax efficient since covered call strategies essentially convert capital gains into ordinary income.

QYLD Premium Costs

Many retail investors focus on the premiums that are received from selling calls. However, investment returns need to calculated net of costs. If an investor sells a call for $3 and buys it back for $1, the return is $2 rather than $3. Of course, if the underlying stock goes up, an investor may have to buy the call back at $5 (as an example). Premium costs vary over time, so investors may want to evaluate total return rather than just premiums received.

QYLD Review: A Recap

The above review of QYLD illustrates that QYLD is a typical covered call strategy, but covered call strategies are not for everyone (including yours truly). I would not personally invest in QYLD nor would I recommend it to anyone else, unless they fully understand covered calls and the performance and tax implications.

FAQs

XYLD ETF Review: Is XYLD a Good Investment?

The Global X S&P 500 Covered Call ETF (symbol: XYLD) is one of the largest covered call exchange-traded funds (ETFs) in the market and is quite popular with retail investors. XYLD employs a covered call strategy, which attempts to generate income by selling the upside potential of its portfolio. While covered calls may make sense in certain situations, my observation is that individual investors do not typically fully understand the dynamics of the strategy or the trade-offs in terms of risk and return. Hopefully, the below can help investors evaluate whether XYLD is a good investment for their portfolio.

A quick reminder that this site does NOT provide investment recommendations. Fund reviews (such as this one) are for educational purposes only and are not advice or recommendations.

The Short Answer

XYLD may be a good tool in very specific situations, but XYLD is not a good investment for many other situations. Covered call strategies (including XYLD) carry a specific and well-known set of tradeoffs that many investors do not necessarily fully understand or consider the implications. I would not recommend XYLD to most investors.

XYLD Performance

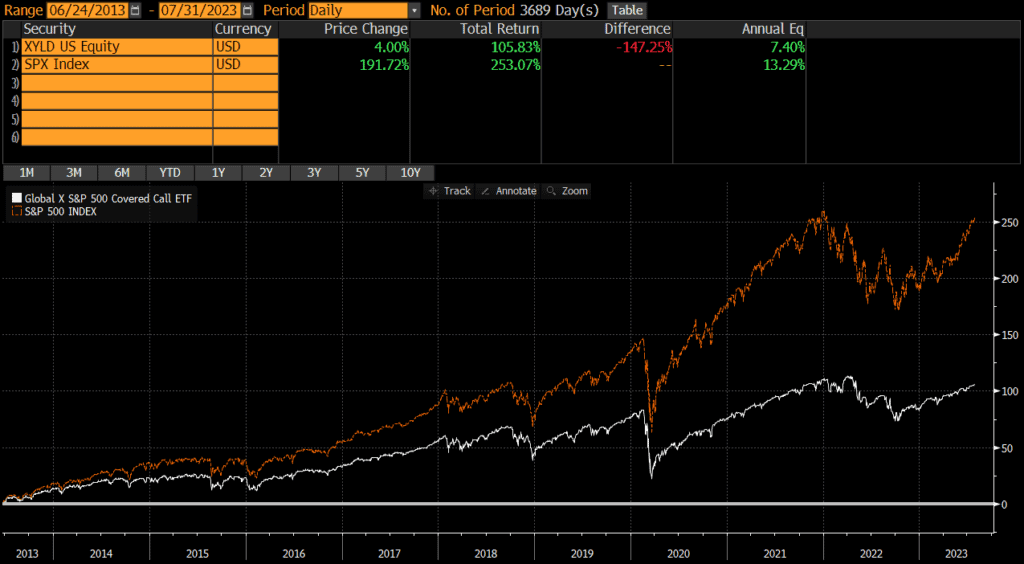
The first thing most investors want to know about is performance, so we will start there. According to Bloomberg, since the fund’s inception in mid 2013, XYLD has returned 7.40% per year which is WAY below the S&P 500’s performance of 13.29% over the same time period.

Source: ThoughtfulFinance.com, Bloomberg

As the XYLD chart of historical performance below shows, XYLD has dramatically underperformed the S&P 500 over time. XYLD outperformed in 2022, when equity markets experienced a lot of volatility, but began to underperform again in 2022. As of this writing, the total return of the two similar (although XYLD is much less tax-efficient). This is not surprising and exactly what I would expect from a covered call fund as the strategy is to sell upside potential in exchange for cash which helps offset downside losses. So I would expect XYLD to underperform when equity markets are doing well, outperform when equities are volatile, and generally underperform over longer time horizons (especially on an after-tax basis).

In terms of risk and drawdowns, XYLD’s downside has been more limited (as has its upside though). The peak-to-trough decline of the S&P 500 total return in 2022 was roughly 23% while XYLD’s total return was down “only” 17%. That being said, the S&P’s prior outperformance meant that it still performed much better even thought it had larger decline in 2022 (see first chart). My view is that writing covered calls does not provide that much (if any) downside protection because of the general underperformance relative to the underlying. This is not necessarily intrinsically good or bad, but investors should be aware.

XYLD Risks

XYLD owns stocks which are more volatile than cash or bonds. While the returns are higher than cash or bonds, investors need to be prepared to stomach volatility and be able to hold for the longer-term. XYLD was down over 17% at one point in 2022. This is not necessarily worse than other similar funds, but it is a characteristic of stocks that investors need to be aware of.

XYLD Portfolio

Fund performance is ultimately driven by a fund’s holdings and exposures, so our XYLD review will examine these items.

XYLD Holdings

XYLD (and its underlying index) is relatively well diversified, holding over 500 stocks. This represents the large-cap segment of the US stock market.

XYLDS&P 500
Number of Stocks506503
Sources: ThoughtfulFinance.com, Morningstar (as of 7/27/2023)

XYLD Country Exposures

XYLD only owns US-based companies. Investors looking for international exposure may pair XYLD with international ETFs or simply hold a global ETF.

XYLD Market Cap Exposure

XYLD is primarily a large-cap fund which seeks to represent the largest US stocks. Even though the fund holds some mid-caps, performance is primarily driven by the large-cap exposure.

XYLD
Large-Cap82%
Mid-Cap17%
Small-Cap0%
Source: ThoughtfulFinance.com, Morningstar; data as of 7/27/2023

XYLD Sector Exposures

XYLD is extremely diversified across sectors and mirrors the approximate weights of the broad US stock market.

XYLD
Basic Materials2.27%
Consumer Cyclical10.68%
Financial Services12.28%
Real Estate2.48%
Communication Services8.62%
Energy4.32%
Industrials8.37%
Technology28.53%
Consumer Defensive6.63%
Healthcare13.30%
Utilities2.53%
Source: ThoughtfulFinance.com, Morningstar; data as of 7/27/2023

Expenses

No review of XYLD would be complete without an in-depth look at the explicit and implicit costs of trading and holding XYLD.

XYLD Expense Ratio

XYLD’s expense ratio of .60% is quite a bit higher than most domestic index ETFs, but this is to be expected for a more active strategy.

XYLD Transaction Costs

ETFs are free to trade at many brokers and custodians, so XYLD should be free to trade in most cases. Additionally, it is among the largest ETFs and is very liquid. The bid-ask spread of XYLD is about .02%, so individual investor trades will not generally be large enough to impact or move the market.

XYLD Tax Efficiency

XYLD is not very tax-efficient as the premiums received from selling calls are taxed at ordinary income rates. While some investors may not mind receiving income in lieu of potential upside, this is akin to converting capital gains (from appreciation) into ordinary income. Of course, a covered call strategy will lose less money if the market declines, but covered call strategies (including XYLD) have a large tax drag.

ETFs are typically more tax-efficient than mutual funds, due to their ability to avoid realizing capital gains through like-kind redemptions (a process that is beyond the scope of this post). However XYLD has made capital gains distributions and I would not necessarily say that the fund is tax efficient since covered call strategies essentially convert capital gains into ordinary income.

XYLD Premium Costs

Many retail investors focus on the premiums that are received from selling calls. However, investment returns need to calculated net of costs. If an investor sells a call for $3 and buys it back for $1, the return is $2 rather than $3. Of course, if the underlying stock goes up, an investor may have to buy the call back at $5 (as an example). Premium costs vary over time, so investors may want to evaluate total return rather than just premiums received.

XYLD Review: A Recap

The above review of XYLD illustrates that XYLD is a typical covered call strategy. But covered call strategies are not for everyone (including yours truly). I would not personally invest in XYLD nor would I recommend it to anyone else, unless they fully understand covered calls and the performance and tax implications.

FAQs

DIVO ETF Review: Is DIVO a Good Investment?

The Amplify CWP Enhanced Dividend ETF (symbol: DIVO) is one of the larger covered call exchange-traded funds (ETFs) in the market and is quite popular with retail investors. DIVO employs a covered call strategy, which attempts to generate income by selling the upside potential of its portfolio. While covered calls may make sense in certain situations, my observation is that individual investors do not typically fully understand the dynamics of the strategy or the trade-offs in terms of risk and return. Hopefully, the below can help investors evaluate whether DIVO is a good investment for their portfolio.

A quick reminder that this site does NOT provide investment recommendations. Fund reviews (such as this one) are for educational purposes only and are not advice or recommendations.

The Short Answer

DIVO may be a good tool in very rare specific situations, but DIVO is not a good investment for many other situations. Covered call strategies (including DIVO) carry a specific and well-known set of tradeoffs that many investors do not necessarily fully understand or consider the implications. Even if I were to invest in a covered call strategy, I probably would not use DIVO.

DIVO Performance

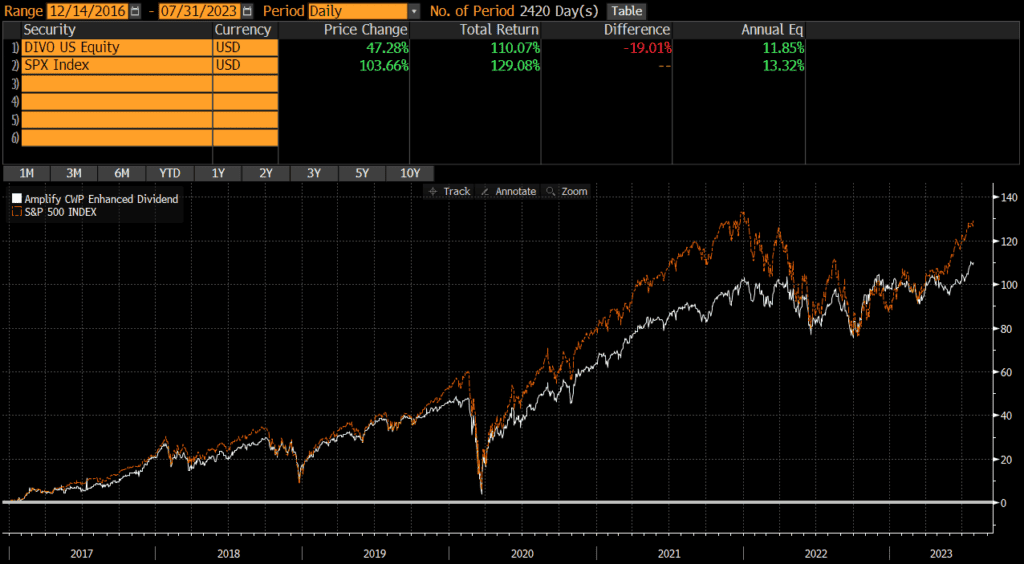
The first thing most investors want to know about is performance, so we will start there. According to Bloomberg, since the fund’s inception in late 2016, DIVO has returned 11.85% per year which is below the S&P 500’s performance of 13.32% over the same time period.

As the DIVO chart of historical performance below shows, DIVO has not materially outperformed in any year except 2022. DIVO outperformed in 2022, when equity markets experienced a lot of volatility, but began to underperform again in 2023. This is not surprising and exactly what I would expect from a covered call fund as the strategy is to sell upside potential in exchange for cash which helps offset downside losses. So I would expect DIVO to underperform when equity markets are doing well, outperform when equities are volatile, and generally underperform over longer time horizons (especially on an after-tax basis).

Source: ThoughtfulFinance.com, Bloomberg

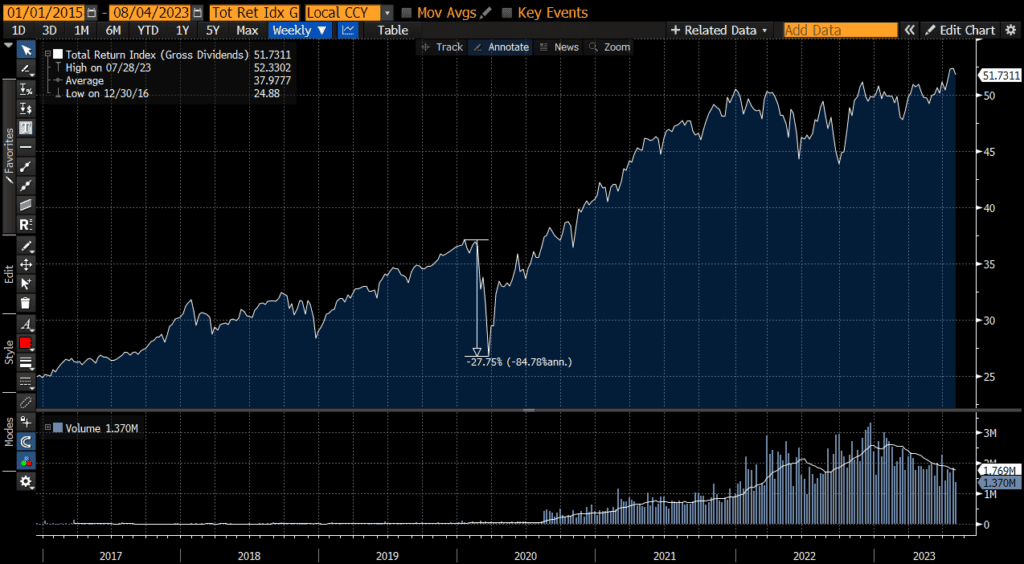
In terms of risk and drawdowns, DIVO’s downside has been slightly more limited (as has its upside though). The peak-to-trough decline of DIVO’s total return was down “only” 27.75% in 2020, while the S&P 500 was closer to 31.5%. That being said, the S&P’s prior outperformance meant that its larger decline only brought the total return down to DIVO’s level (rather than below it). My view is that writing covered calls does not provide that much (if any) downside protection because of the general underperformance relative to the underlying. This is not necessarily intrinsically good or bad, but investors should be aware.

Source: ThoughtfulFinance.com

DIVO Risks

DIVO owns stocks which are more volatile than cash or bonds. While the returns are higher than cash or bonds, investors need to be prepared to stomach volatility and be able to hold for the longer-term. DIVO was down nearly 28% at one point in 2020. This is not necessarily worse than other similar funds, but it is a characteristic of stocks that investors need to be aware of.

DIVO Portfolio

Fund performance is ultimately driven by a fund’s holdings and exposures, so our DIVO review will examine these items.

DIVO Holdings

DIVO (and its underlying index) is relatively concentrated and does not hold very many stocks. This represents the large-cap segment of the US stock market.

DIVOS&P 500
Number of Stocks24503
Sources: ThoughtfulFinance.com, Morningstar (as of 7/27/2023)

DIVO Country Exposures

DIVO only owns US-based companies. Investors looking for international exposure may pair DIVO with international ETFs or simply hold a global ETF.

DIVO Market Cap Exposure

DIVO is primarily a large-cap fund which seeks to represent the largest US stocks. Even though the fund holds some mid-caps, performance is primarily driven by the large-cap exposure.

DIVO
Large-Cap96%
Mid-Cap3%
Small-Cap0%
Source: ThoughtfulFinance.com, Morningstar; data as of 7/27/2023

DIVO Sector Exposures

DIVO is not very diversified across sectors nor does it mirror the approximate weights of the broad US stock market.

DIVO
Basic Materials1.18%
Consumer Cyclical11.76%
Financial Services17.40%
Real Estate0.00%
Communication Services1.86%
Energy10.96%
Industrials11.69%
Technology11.08%
Consumer Defensive14.81%
Healthcare15.95%
Utilities3.31%
Source: ThoughtfulFinance.com, Morningstar; data as of 7/27/2023

Expenses

No review of DIVO would be complete without an in-depth look at the explicit and implicit costs of trading and holding DIVO.

DIVO Expense Ratio

DIVO’s expense ratio of .55% is quite a bit higher than most domestic index ETFs, but this is not surprising for a more active strategy.

DIVO Transaction Costs

ETFs are free to trade at many brokers and custodians, so DIVO should be free to trade in most cases. Additionally, it is relatively liquid. The bid-ask spread of DIVO is about .1%, so individual investor trades will not generally be large enough to impact or move the market.

DIVO Tax Efficiency

DIVO is not very tax-efficient as the premiums received from selling calls are taxed at ordinary income rates. While some investors may not mind receiving income in lieu of potential upside, this is akin to converting capital gains (from appreciation) into ordinary income. Of course, a covered call strategy will lose less money if the market declines, but covered call strategies (including DIVO) have a large tax drag.

ETFs are typically more tax-efficient than mutual funds, due to their ability to avoid realizing capital gains through like-kind redemptions (a process that is beyond the scope of this post). However, DIVO has made capital gains distributions and I would not necessarily say that the fund is tax efficient since covered call strategies essentially convert capital gains into ordinary income.

DIVO Premium Costs

Many retail investors focus on the premiums that are received from selling calls. However, investment returns need to calculated net of costs. If an investor sells a call for $3 and buys it back for $1, the return is $2 rather than $3. Of course, if the underlying stock goes up, an investor may have to buy the call back at $5 (as an example). Premium costs vary over time, so investors may want to evaluate total return rather than just premiums received.

DIVO Review: A Recap

The above review of DIVO illustrates that DIVO is a typical covered call strategy. It gained quite a bit of popularity and assets during the bear market of 2022, but covered call strategies are not for everyone (including yours truly). I would not personally invest in DIVO nor would I recommend it to anyone else, unless they fully understand covered calls and the performance and tax implications.

FAQs

JEPQ ETF Review: Is JEPQ a Good Investment?

The JP Morgan Nasdaq Equity Premium ETF (symbol: JEPQ) is one of the largest covered call exchange-traded funds (ETFs) in the market and is quite popular with retail investors. JEPQ employs a covered call strategy, which attempts to generate income by selling the upside potential of its portfolio. While covered calls may make sense in certain situations, my observation is that individual investors do not typically fully understand the dynamics of the strategy or the trade-offs in terms of risk and return. Interestingly, JEPQ overlays its strategy on the Nasdaq 100 index, rather than the S&P 500 (like its big sibling JEPI). Hopefully, the below can help investors evaluate whether JEPQ is a good investment for their portfolio.

A quick reminder that this site does NOT provide investment recommendations. Fund reviews (such as this one) are for educational purposes only and are not advice or recommendations.

The Short Answer

JEPQ may be a good tool in rare specific situations, but JEPQ is not a good investment for many other situations. Covered call strategies (including JEPQ) carry a specific and well-known set of tradeoffs that many investors do not necessarily fully understand or consider the implications. I would not recommend JEPQ to most investors.

JEPQ Performance

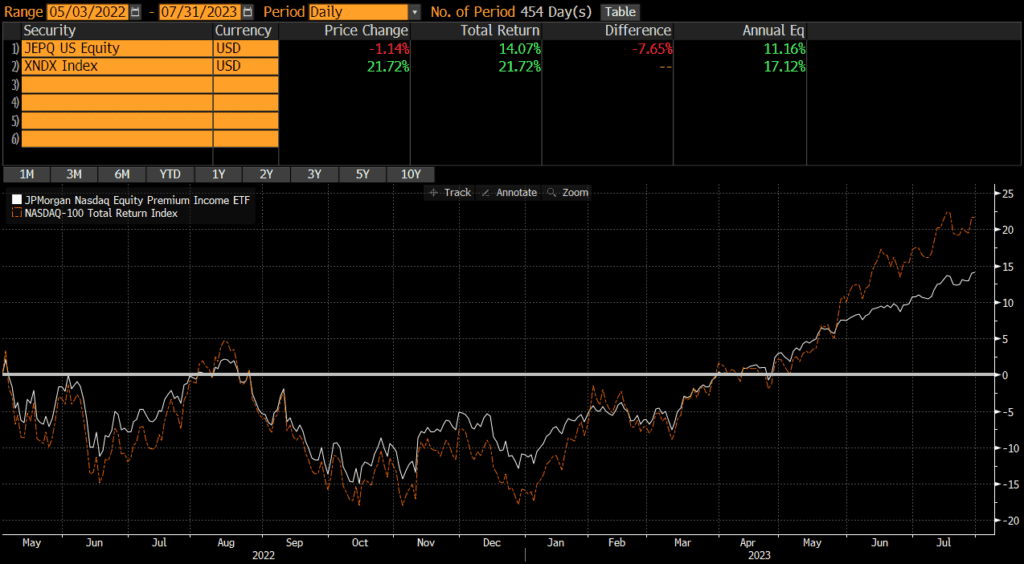
The first thing most investors want to know about is performance, so we will start there. According to Bloomberg, since the fund’s inception in mid 2022, JEPQ has returned 11.16% annualized which is below the Nasdaq 100 Index’s performance of 17.12% over the same time period. It is important to note that the Nasdaq 100 is different than the Nasdaq Composite Index.

As the JEPQ chart of historical performance below shows, JEPQ outperformed in ever so slightly in 2022 (when equity markets experienced a lot of volatility) and began to underperform in 2022 (as market rallied). This is not surprising and exactly what I would expect from a covered call fund as the strategy is to sell upside potential in exchange for cash which helps offset downside losses. So I would expect JEPQ to underperform when equity markets are doing well, outperform when equities are volatile, and generally underperform over longer time horizons (especially on an after-tax basis). I am a bit surprised that JEPQ did not perform better in 2022 given the volatility, but perhaps the fund was launched a bit too late. Overall, performance has not been impressive.

Source: ThoughtfulFinance.com, Bloomberg

In terms of risk and drawdowns, JEPQ’s downside has been slightly more limited (as has its upside though). The peak-to-trough decline of JEPQ in 2022 was roughly 15% versus approximately 18% for the Nasdaq 100 during the same period.

JEPQ Risks

JEPQ owns stocks which are more volatile than cash or bonds. While the returns are higher than cash or bonds, investors need to be prepared to stomach volatility and be able to hold for the longer-term. JEPQ was down over 16% at one point in 2022. Interestingly, QYLD (a similar strategy that launched before 2022) was down over 24% in 2022, so there definitely is risk. This is not necessarily worse than other similar funds (over the same time period), but it is a characteristic of stocks that investors need to be aware of.

JEPQ Portfolio

Fund performance is ultimately driven by a fund’s holdings and exposures, so our JEPQ review will examine these items.

JEPQ Holdings

JEPQ (and its underlying index) is relatively well diversified in terms of number of holdings.

JEPQNASDAQ 100
Number of Stocks88100
Sources: ThoughtfulFinance.com, Morningstar (as of 7/27/2023)

JEPQ Country Exposures

JEPQ primarily owns US-based companies. Investors looking for international exposure may pair JEPQ with international ETFs or simply hold a global ETF.

JEPQ Market Cap Exposure

JEPQ is primarily a large-cap fund which seeks to represent the largest US stocks listed on the Nasdaq. Even though the fund holds some mid-caps, performance is primarily driven by the large-cap exposure.

JEPQ
Large-Cap93%
Mid-Cap6%
Small-Cap0%
Source: ThoughtfulFinance.com, Morningstar; data as of 7/27/2023

JEPQ Sector Exposures

Similar to the underlying Nasdaq 100 index, JEPQ is quite concentrated in terms of sectors.

JEPQ
Basic Materials0.00%
Consumer Cyclical13.73%
Financial Services0.90%
Real Estate0.35%
Communication Services15.25%
Energy0.37%
Industrials4.24%
Technology49.92%
Consumer Defensive6.75%
Healthcare7.04%
Utilities1.44%
Source: ThoughtfulFinance.com, Morningstar; data as of 7/27/2023

Expenses

No review of JEPQ would be complete without an in-depth look at the explicit and implicit costs of trading and holding JEPQ.

JEPQ Expense Ratio

JEPQ’s expense ratio of .35% is quite a bit higher than most domestic index ETFs, but this is to be expected for a more active strategy. Also, although it’s 10x the cost of a plain vanilla index fund, its only 30-35 basis points.

JEPQ Transaction Costs

ETFs are free to trade at many brokers and custodians, so JEPQ should be free to trade in most cases. Additionally, it is among the largest ETFs and is very liquid. The bid-ask spread of JEPQ is about .02%, so individual investor trades will not generally be large enough to impact or move the market.

JEPQ Tax Efficiency

JEPQ is not very tax-efficient as the premiums received from selling calls are taxed at ordinary income rates. While some investors may not mind receiving income in lieu of potential upside, this is akin to converting capital gains (from appreciation) into ordinary income. Of course, a covered call strategy will lose less money if the market declines, but covered call strategies (including JEPQ) have a large tax drag.

ETFs are typically more tax-efficient than mutual funds, due to their ability to avoid realizing capital gains through like-kind redemptions (a process that is beyond the scope of this post). This is true of JEPQ as well, since it has not made any capital gains distributions to date. However, I would not necessarily say that the fund is tax efficient since covered call strategies essentially convert capital gains into ordinary income.

JEPQ Premium Costs

Many retail investors focus on the premiums that are received from selling calls. However, investment returns need to calculated net of costs. If an investor sells a call for $3 and buys it back for $1, the return is $2 rather than $3. Of course, if the underlying stock goes up, an investor may have to buy the call back at $5 (as an example). Premium costs vary over time, so investors may want to evaluate total return rather than just premiums received.

JEPQ Review: A Recap

The above review of JEPQ illustrates that JEPQ is a typical covered call strategy. It gained quite a bit of popularity and assets during the bear market of 2022, but covered call strategies are not for everyone (including yours truly). I would not personally invest in JEPQ nor would I recommend it to anyone else, unless they fully understand covered calls and the performance and tax implications.

FAQs

JEPI ETF Review: Is JEPI a Good Investment?

The JP Morgan Equity Premium ETF (symbol: JEPI) is one of the largest covered call exchange-traded funds (ETFs) in the market and is quite popular with retail investors. JEPI employs a covered call strategy, which attempts to generate income by selling the upside potential of its portfolio. While covered calls may make sense in certain situations, my observation is that individual investors do not typically fully understand the dynamics of the strategy or the trade-offs in terms of risk and return. Hopefully, the below can help investors evaluate whether JEPI is a good investment for their portfolio.

A quick reminder that this site does NOT provide investment recommendations. Fund reviews (such as this one) are for educational purposes only and are not advice or recommendations.

The Short Answer

JEPI may be a good tool in very specific situations, but JEPI is not a good investment for many other situations. Covered call strategies (including JEPI) carry a specific and well-known set of tradeoffs that many investors do not necessarily fully understand or consider the implications. I would not recommend JEPI to most investors.

JEPI Performance

The first thing most investors want to know about is performance, so we will start there. According to Bloomberg, since the fund’s inception in mid 2020, JEPI has returned 13.32% per year which is below the S&P 500’s performance of 16.65% over the same time period.

As the JEPI chart of historical performance below shows, JEPI underperformed the S&P 500 in 2020 and 2021. Then JEPI outperformed in 2022, when equity markets experienced a lot of volatility, but began to underperform again in 2022. This is not surprising and exactly what I would expect from a covered call fund as the strategy is to sell upside potential in exchange for cash which helps offset downside losses. So I would expect JEPI to underperform when equity markets are doing well, outperform when equities are volatile, and generally underperform over longer time horizons (especially on an after-tax basis).

Source: ThoughtfulFinance.com, Bloomberg

In terms of risk and drawdowns, JEPI’s downside has been more limited (as has its upside though). The peak-to-trough decline of the S&P 500 total return in 2022 was roughly 23% while JEPI’s total return was down only 13.6%. That being said, the S&P’s prior outperformance meant that its larger decline only brought the total return down to JEPI’s. My view is that writing covered calls does not provide that much (if any) downside protection because of the general underperformance relative to the underlying. This is not necessarily intrinsically good or bad, but investors should be aware.

Source: ThoughtfulFinance.com

JEPI Risks

JEPI owns stocks which are more volatile than cash or bonds. While the returns are higher than cash or bonds, investors need to be prepared to stomach volatility and be able to hold for the longer-term. JEPI was down over 13% at one point in 2022. This is not necessarily worse than other similar funds, but it is a characteristic of stocks that investors need to be aware of.

JEPI Portfolio

Fund performance is ultimately driven by a fund’s holdings and exposures, so our JEPI review will examine these items.

JEPI Holdings

JEPI (and its underlying index) is relatively well diversified, holding over 100 stocks. This represents the large-cap segment of the US stock market.

JEPIS&P 500
Number of Stocks136503
Sources: ThoughtfulFinance.com, Morningstar (as of 7/27/2023)

JEPI Country Exposures

JEPI only owns US-based companies. Investors looking for international exposure may pair JEPI with international ETFs or simply hold a global ETF.

JEPI Market Cap Exposure

JEPI is primarily a large-cap fund which seeks to represent the largest US stocks. Even though the fund holds some mid-caps, performance is primarily driven by the large-cap exposure.

JEPI
Large-Cap82%
Mid-Cap17%
Small-Cap0%
Source: ThoughtfulFinance.com, Morningstar; data as of 7/27/2023

JEPI Sector Exposures

JEPI is extremely diversified across sectors and mirrors the approximate weights of the broad US stock market.

JEPI
Basic Materials3.86%
Consumer Cyclical9.07%
Financial Services12.22%
Real Estate3.70%
Communication Services5.27%
Energy2.95%
Industrials13.58%
Technology17.57%
Consumer Defensive12.85%
Healthcare13.58%
Utilities5.36%
Source: ThoughtfulFinance.com, Morningstar; data as of 7/27/2023

Expenses

No review of JEPI would be complete without an in-depth look at the explicit and implicit costs of trading and holding JEPI.

JEPI Expense Ratio

JEPI’s expense ratio of .35% is quite a bit higher than most domestic index ETFs, but this is to be expected for a more active strategy. Also, although it’s 10x the cost of a plain vanilla index fund, its only 30-35 basis points.

JEPI Transaction Costs

ETFs are free to trade at many brokers and custodians, so JEPI should be free to trade in most cases. Additionally, it is among the largest ETFs and is very liquid. The bid-ask spread of JEPI is about .02%, so individual investor trades will not generally be large enough to impact or move the market.

JEPI Tax Efficiency

JEPI is not very tax-efficient as the premiums received from selling calls are taxed at ordinary income rates. While some investors may not mind receiving income in lieu of potential upside, this is akin to converting capital gains (from appreciation) into ordinary income. Of course, a covered call strategy will lose less money if the market declines, but covered call strategies (including JEPI) have a large tax drag.

ETFs are typically more tax-efficient than mutual funds, due to their ability to avoid realizing capital gains through like-kind redemptions (a process that is beyond the scope of this post). This is true of JEPI as well, since it has not made any capital gains distributions to date. However, I would not necessarily say that the fund is tax efficient since covered call strategies essentially convert capital gains into ordinary income.

JEPI Premium Costs

Many retail investors focus on the premiums that are received from selling calls. However, investment returns need to calculated net of costs. If an investor sells a call for $3 and buys it back for $1, the return is $2 rather than $3. Of course, if the underlying stock goes up, an investor may have to buy the call back at $5 (as an example). Premium costs vary over time, so investors may want to evaluate total return rather than just premiums received.

JEPI Review: A Recap

The above review of JEPI illustrates that JEPI is a typical covered call strategy. It gained quite a bit of popularity and assets during the bear market of 2022, but covered call strategies are not for everyone (including yours truly). I would not personally invest in JEPI nor would I recommend it to anyone else, unless they fully understand covered calls and the performance and tax implications.

FAQs

SCHB ETF Review: Is SCHB a Good Investment?

The Schwab US Broad Market ETF (symbol: SCHB) is one of the largest exchange-traded funds (ETFs) in the market and widely used by both individual and institutional investors. SCHB is a low-cost index fund, which tracks the Dow Jones US Broad Stock Market Index. As its name implies, it seeks to provide exposure to the broad US stock market at a very low price. The fund is the core of many portfolios and the below review of SCHB will evaluate why that is.

A quick reminder that this site does NOT provide investment recommendations. Fund reviews (such as this one) are for educational purposes only and are not advice or recommendations.

SCHB Performance

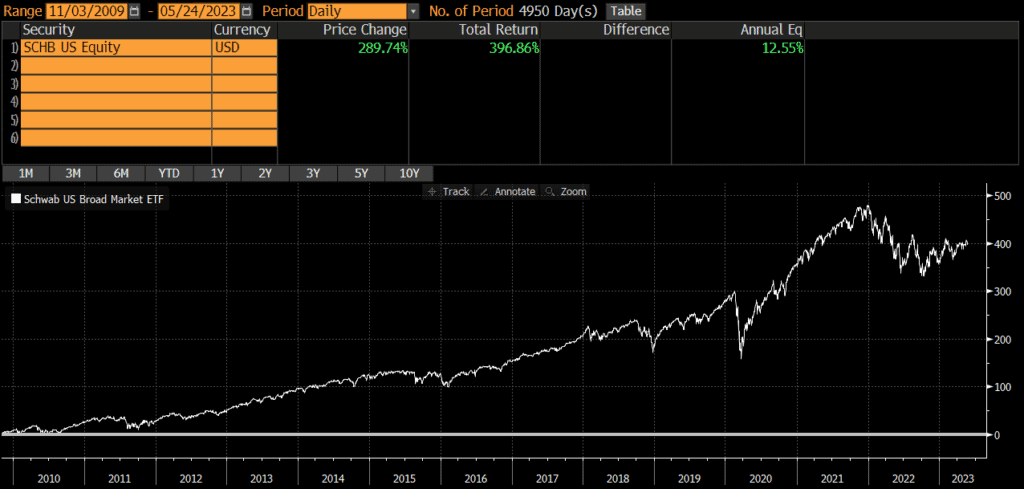
The first thing most investors want to know about is performance, so we will start there. According to Bloomberg, since the fund’s inception 14 years ago, SCHB has returned over 12.5% per year. Of course, this figure can go up or down and the returns in any single year are unlikely to be 12.5%. From 2010 through 2022 (13 years), SCHB was up in 11 years and down in 2 years. The average return in the up years was 17.5%, while the average return in the down years was -12.4%.

Source: ThoughtfulFinance.com, Bloomberg

SCHB Risks

SCHB owns stocks which are more volatile than cash or bonds. While the returns are higher than cash or bonds, investors need to be prepared to stomach volatility and be able to hold for the longer-term. SCHB was down over 35% during the covid pandemic and similar funds declined roughly 50% during the previous two recessions in 2001 and 2007. This is not necessarily worse than other similar funds, but it is a characteristic of stocks that investors need to be aware of.

SCHB Portfolio

Fund performance is ultimately driven by a fund’s holdings and exposures, so our SCHB review will examine these items.

SCHB Holdings

SCHB (and its underlying index) is incredibly diversified, holding nearly 4,000 stocks. This represents the vast majority of the US stock market.

SCHBDow Jones US Broad Stock Market Index
Number of Stocks2,4842,519
Sources: ThoughtfulFinance.com, Schwab (as of 3/31/2023)

SCHB Country Exposures

SCHB only owns US-based companies. Investors looking for international exposure may pair SCHB with international ETFs or simply hold a global ETF.

SCHB Market Cap Exposure

SCHB is a “total market” fund which seeks to represent the entire US stock market, which is predominantly composed of large-caps. Even though the fund holds mid-caps and small-caps, performance is primarily driven by the large-cap exposure. This dynamic can be found by comparing SCHB to SWPPX (a large-cap fund).

SCHB
Large-Cap73%
Mid-Cap19%
Small-Cap8%
Source: ThoughtfulFinance.com, Morningstar; data as of 5/24/2023

SCHB Sector Exposures

SCHB is extremely diversified across sectors and mirrors the approximate weights of the broad US stock market.

SCHB
Basic Materials2.47%
Consumer Cyclical10.61%
Financial Services12.53%
Real Estate3.14%
Communication Services8.04%
Energy4.40%
Industrials8.98%
Technology26.69%
Consumer Defensive6.49%
Healthcare14.01%
Utilities2.65%
Source: ThoughtfulFinance.com, Morningstar; data as of 5/24/2023

Expenses

No review of SCHB would be complete without an in-depth look at the explicit and implicit costs of trading and holding SCHB.

SCHB Expense Ratio

SCHB’s expense ratio of .03% is among the lowest of any total market funds. Even if another fund is free, three basis points is not a material difference in my opinion.

SCHB Transaction Costs

ETFs are free to trade at many brokers and custodians, so SCHB should be free to trade in most cases. Additionally, it is among the largest ETFs and is very liquid. The bid-ask spread of SCHB is about .01%, so individual investor trades will not generally be large enough to impact or move the market.

SCHB Tax Efficiency

Like most index funds, SCHB is very tax-efficient. Unlike actively-managed funds, passively-managed index funds typically have less trading and lower turnover. This results in fewer taxable events and higher tax efficiency.

ETFs are typically more tax-efficient than mutual funds, due to their ability to avoid realizing capital gains through like-kind redemptions (a process that is beyond the scope of this post). SCHB has never made a capital gains distribution, so SCHB is about as tax-efficient as any fund can be.

Investors in a high tax bracket with at least $250,000 may consider direct indexing rather than SCHB, as direct indexing can potentially generate even more tax savings.

SCHB Review: A Recap

The above review of SCHB illustrates that SCHB is a well-constructed, low-cost and tax-efficient index fund that provides diversified exposure to the broad US stock market. SCHB is a great choice in many situations and a tool that I often use personally and professionally.

FAQ’s

IVV Review: Is IVV a Good Investment?

The iShares S&P 500 ETF (symbol: IVV) is one of the largest exchange-traded funds (ETFs) in the market and widely used by both individual and institutional investors. IVV is a low-cost index fund, which tracks the S&P 500 Index. The fund seeks to provide exposure to the US stock market at a very low price. The fund is the core of many portfolios and the below review of IVV will evaluate why that is.

A quick reminder that this site does NOT provide investment recommendations. Fund reviews (such as this one) are for educational purposes only and are not advice or recommendations.

IVV Performance

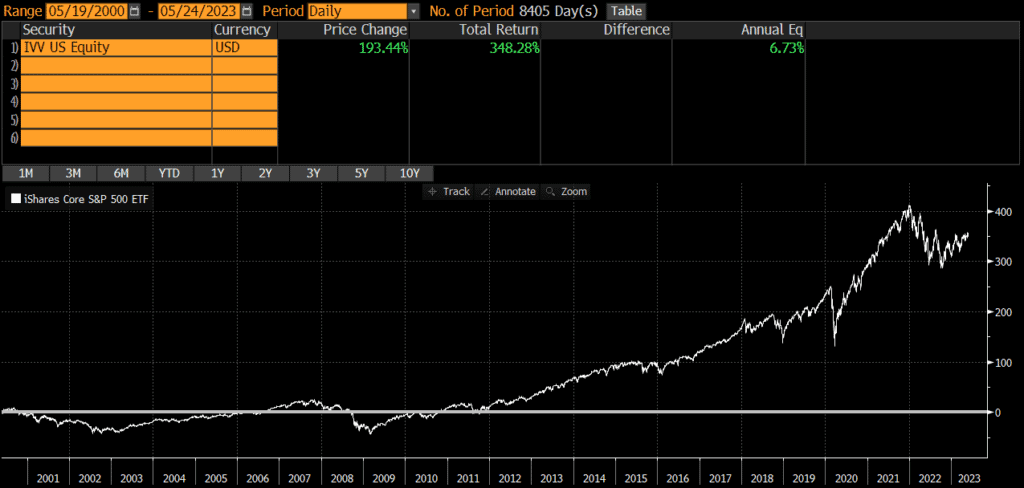
The first thing most investors want to know about is performance, so we will start there. According to Bloomberg, since the fund’s inception 23 years ago, IVV has returned nearly 7% per year. Of course, this figure can go up or down and the returns in any single year are unlikely to be 7%. From 2001 through 2022 (22 years), IVV was up in 17 years and down in 5 years. The average return in the up years was 16.7%, while the average return in the down years was -18.6%.

Source: ThoughtfulFinance.com, Bloomberg

IVV Risks

IVV owns stocks which are more volatile than cash or bonds. While the returns are higher than cash or bonds, investors need to be prepared to stomach volatility and be able to hold for the longer-term. IVV was down nearly 35% during the covid pandemic and down over 25% at one point in 2022. It was also down nearly 50% in the 2000-2003 recession and declined over 55% during the 2007-2009 recession. This is not necessarily worse than other similar funds, but it is a characteristic of stocks that investors need to be aware of.

IVV Portfolio

Fund performance is ultimately driven by a fund’s holdings and exposures, so our IVV review will examine these items.

IVV Holdings

IVV (and its underlying index) is incredibly diversified, holding over 500 stocks. This represents the large-cap segment of the US stock market.

IVVS&P 500
Number of Stocks503503
Sources: ThoughtfulFinance.com, iShares (as of 4/30/2023)

IVV Country Exposures

IVV only owns US-based companies. Investors looking for international exposure may pair IVV with international ETFs or simply hold a global ETF.

IVV Market Cap Exposure

IVV is primarily a large-cap fund which seeks to represent the largest US stocks. Even though the fund holds some mid-caps, performance is primarily driven by the large-cap exposure.

IVV
Large-Cap83%
Mid-Cap17%
Small-Cap0%
Source: ThoughtfulFinance.com, Morningstar; data as of 5/22/2023

IVV Sector Exposures

IVV is extremely diversified across sectors and mirrors the approximate weights of the broad US stock market.

IVV
Basic Materials2.27%
Consumer Cyclical10.35%
Financial Services12.34%
Real Estate2.53%
Communication Services8.75%
Energy4.32%
Industrials8.13%
Technology27.42%
Consumer Defensive7.02%
Healthcare14.14%
Utilities2.73%
Source: ThoughtfulFinance.com, Morningstar; data as of 5/22/2023

Expenses

No review of IVV would be complete without an in-depth look at the explicit and implicit costs of trading and holding IVV.

IVV Expense Ratio

IVV’s expense ratio of .03% is among the lowest of any large-cap funds. Even if another fund is free, three basis points is not a material difference in my opinion.

IVV Transaction Costs

ETFs are free to trade at many brokers and custodians, so IVV should be free to trade in most cases. Additionally, it is among the largest ETFs and is very liquid. The bid-ask spread of IVV is about .01%, so individual investor trades will not generally be large enough to impact or move the market.

IVV Tax Efficiency

Like most index funds, IVV is very tax-efficient. Unlike actively-managed funds, passively-managed index funds typically have less trading and lower turnover. This results in fewer taxable events and higher tax efficiency.

ETFs are typically more tax-efficient than mutual funds, due to their ability to avoid realizing capital gains through like-kind redemptions (a process that is beyond the scope of this post). IVV has never made a capital gains distribution, so IVV is about as tax-efficient as any fund can be.

Investors in a high tax bracket with at least $250,000 may consider direct indexing rather than IVV, as direct indexing can potentially generate even more tax savings.

IVV Review: A Recap

The above review of IVV illustrates that IVV is a well-constructed, low-cost and tax-efficient index fund that provides diversified exposure to the US stock market. IVV is a great choice in many situations and a tool that I often use personally and professionally.

FAQs

Scroll to Top