The Global X Nasdaq 100 Covered Call ETF (symbol: QYLD) is one of the largest covered call exchange-traded funds (ETFs) in the market and is quite popular with retail investors. QYLD employs a covered call strategy, which attempts to generate income by selling the upside potential of its portfolio. While covered calls may make sense in certain situations, my observation is that individual investors do not typically fully understand the dynamics of the strategy or the trade-offs in terms of risk and return. Interestingly, QYLD overlays its strategy on the Nasdaq 100 index, rather than the S&P 500 (like its sibling XYLD). Hopefully, the below can help investors evaluate whether QYLD is a good investment for their portfolio.
A quick reminder that this site does NOT provide investment recommendations. Fund reviews (such as this one) are for educational purposes only and are not advice or recommendations.
The Short Answer
QYLD may be a good tool in rare specific situations, but QYLD is not a good investment for many other situations. Covered call strategies (including QYLD) carry a specific and well-known set of tradeoffs that many investors do not necessarily fully understand or consider the implications. I would not recommend QYLD to most investors.
QYLD Performance
The first thing most investors want to know about is performance, so we will start there. According to Bloomberg, since the fund’s inception in late 2013, QYLD has returned 7.41% annualized which is below the Nasdaq 100 Index’s performance of 18.25% over the same time period. It is important to note that the Nasdaq 100 is different than the Nasdaq Composite Index.
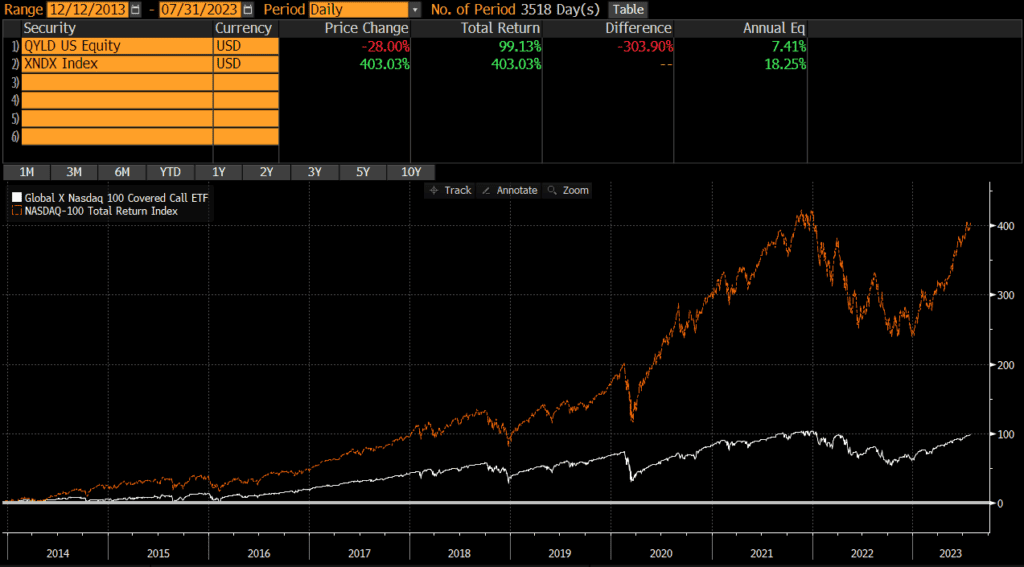
As the QYLD chart of historical performance below shows, QYLD has underperformed the Nasdaq 100 by a large amount (and even more so on an after-tax basis). This is not surprising and exactly what I would expect from a covered call fund as the strategy is to sell upside potential in exchange for cash which helps offset downside losses. So I would expect QYLD to underperform when equity markets are doing well, outperform when equities are volatile, and generally underperform over longer time horizons (especially on an after-tax basis).
Of course, covered call strategies tend to outperform during volatile periods, so 2022 was a bright spot for QYLD despite underperforming for a decade. That being said, it began underperforming again in the first half of 2023 and the total return between the two is essentially identical.

In terms of risk and drawdowns, QYLD’s downside has been slightly more limited (as has its upside though). The peak-to-trough decline of QYLD in 2022 was roughly -24% versus approximately 34% for the Nasdaq 100 during the same period.
QYLD Risks
QYLD owns stocks which are more volatile than cash or bonds. While the returns are higher than cash or bonds, investors need to be prepared to stomach volatility and be able to hold for the longer-term. QYLD was down over 24% at one point in 2022. This is not necessarily worse than other similar funds (over the same time period), but it is a characteristic of stocks that investors need to be aware of.
QYLD Portfolio
Fund performance is ultimately driven by a fund’s holdings and exposures, so our QYLD review will examine these items.
QYLD Holdings
QYLD (and its underlying index) is relatively well diversified in terms of number of holdings.
| QYLD | NASDAQ 100 | |
| Number of Stocks | 103 | 100 |
QYLD Country Exposures
QYLD primarily owns US-based companies. Investors looking for international exposure may pair QYLD with international ETFs or simply hold a global ETF.
QYLD Market Cap Exposure
QYLD is primarily a large-cap fund which seeks to represent the largest US stocks listed on the Nasdaq. Even though the fund holds some mid-caps, performance is primarily driven by the large-cap exposure.
| QYLD | |
| Large-Cap | 91% |
| Mid-Cap | 10% |
| Small-Cap | 0% |
QYLD Sector Exposures
Similar to the underlying Nasdaq 100 index, QYLD is quite concentrated in terms of sectors.
| QYLD | |
| Basic Materials | 0.00% |
| Consumer Cyclical | 13.77% |
| Financial Services | 0.59% |
| Real Estate | 0.27% |
| Communication Services | 15.36% |
| Energy | 0.52% |
| Industrials | 4.88% |
| Technology | 49.64% |
| Consumer Defensive | 6.57% |
| Healthcare | 7.16% |
| Utilities | 1.23% |
Expenses
No review of QYLD would be complete without an in-depth look at the explicit and implicit costs of trading and holding QYLD.
QYLD Expense Ratio
QYLD’s expense ratio of .60% is quite a bit higher than most domestic index ETFs, but this is to be expected for a more active strategy.
QYLD Transaction Costs
ETFs are free to trade at many brokers and custodians, so QYLD should be free to trade in most cases. Additionally, it is among the largest ETFs and is very liquid. The bid-ask spread of QYLD is about .06%, so individual investor trades will not generally be large enough to impact or move the market.
QYLD Tax Efficiency
QYLD is not very tax-efficient as the premiums received from selling calls are taxed at ordinary income rates. While some investors may not mind receiving income in lieu of potential upside, this is akin to converting capital gains (from appreciation) into ordinary income. Of course, a covered call strategy will lose less money if the market declines, but covered call strategies (including QYLD) have a large tax drag.
ETFs are typically more tax-efficient than mutual funds, due to their ability to avoid realizing capital gains through like-kind redemptions (a process that is beyond the scope of this post). However, QYLD has made capital gains distributions and I would not necessarily say that the fund is tax efficient since covered call strategies essentially convert capital gains into ordinary income.
QYLD Premium Costs
Many retail investors focus on the premiums that are received from selling calls. However, investment returns need to calculated net of costs. If an investor sells a call for $3 and buys it back for $1, the return is $2 rather than $3. Of course, if the underlying stock goes up, an investor may have to buy the call back at $5 (as an example). Premium costs vary over time, so investors may want to evaluate total return rather than just premiums received.
QYLD Review: A Recap
The above review of QYLD illustrates that QYLD is a typical covered call strategy, but covered call strategies are not for everyone (including yours truly). I would not personally invest in QYLD nor would I recommend it to anyone else, unless they fully understand covered calls and the performance and tax implications.