The iShares MSCI EAFE ETF (EFA) and the iShares Core MSCI EAFE ETF (IEFA) are two of the largest ETFs in existence and both are sponsored by Blackrock’s iShares. EAFE is a acronym that stands for Europe, Australasia, and Far East and so is used to describe developed markets (excluding the Americas). As their names suggest, EFA and IEFA are a core international holding of many portfolios. Many investors compare IEFA vs EFA in order to decide which should be the foundation of their portfolio.
A quick reminder that this site does NOT provide investment recommendations. Fund comparisons (such as this one) are not conducted to identify the “best” fund (since that will vary from investor to investor based on investor-specific factors). Rather, these fund comparison posts are designed to identify and distinguish between the fund details that matter versus the ones that don’t.
The Short Answer
EFA and IEFA are nearly identical is most ways, but EFA is much more expensive than IEFA. In most situations, IEFA is preferable to EFA.
The Longer Answer
These funds are nearly identical in most ways, although EFA is a much more expensive fund.
EFA and IEFA track different indices. The older EFA tracks the large-cap MSCI EAFE Index, while IEFA tracks the MSCI EAFE Investable Market Index (IMI) which owns more mid-caps and small-caps (see our comparison of the indices here).
History of EFA and IEFA
EFA was the first EAFE ETF to launch, back in 2001. This first mover advantage gave it an edge in accumulating assets under management (AUM) and became the liquid vehicle of choice for traders. Even as other EAFE ETFs launched and competitors engaged in cutting fees, EFA was able to command premium fees. However, Vanguard and other sponsors were able to begin capturing market share with ever decreasing costs. Blackrock (which owns iShares) needed to respond with a lower cost option, but did not want to sacrifice their golden goose EFA. So rather than cut EFA’s fees, they launched IEFA at a much lower fee level. Essentially, they created IEFA to compete with Vanguard without giving up the high fees that EFA was collecting.
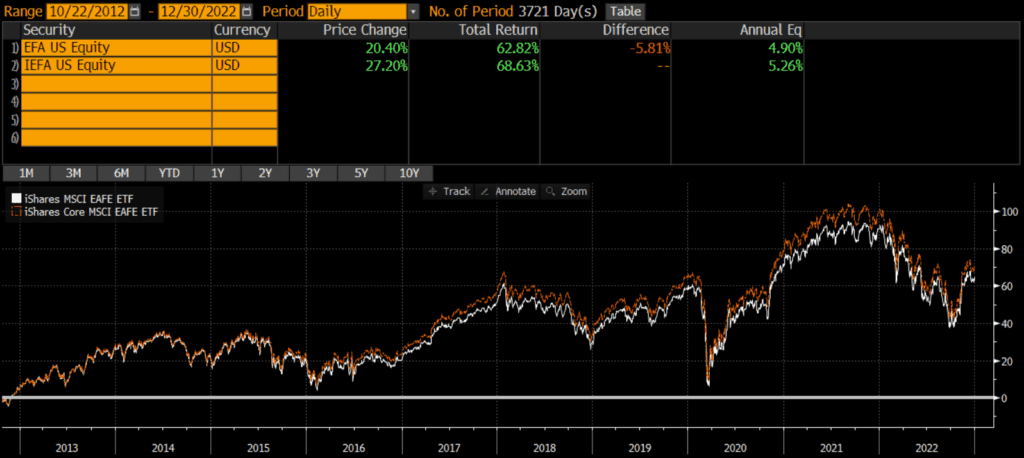
Historical Performance: IEFA vs EFA
Since IEFA’s launch in October 2012, it has outperformed EFA by .36% annually! This has mostly been driven by the fee differential, which currently stands at .26%. The cumulative performance over the past 10 years is nearly 6%. As the below chart illustrates, the two funds move in lockstep, but EFA’s performance is degraded by its expenses.
Differences between IEFA vs EFA
These two funds are nearly identical in every way. Beyond the expenses, the biggest difference between EFA and IEFA is the market cap exposure of the funds.
Geographic Exposure
The country exposures of the two funds appears nearly identical. Below are the top country exposures as of 12/31/2022.
| EFA | IEFA | |
| Japan | 21.87% | 23.23% |
| United Kingdom | 15.21% | 15.14% |
| France | 11.81% | 10.59% |
| Switzerland | 10.11% | 9.31% |
| Germany | 8.12% | 8.22% |
Market Cap Exposure
EFA tracks the large- and mid-cap MSCI EAFE Index, while IEFA tracks the more expansive Investable Market Index (IMI) version of the index. So IEFA owns many more mid-caps and small-caps. In other words, EFA is a large-cap vehicle, while IEFA is a total market vehicle. That being said, due to market cap weighting, both funds are overwhelmingly influenced by the large-cap holdings.
| EFA | IEFA | |
| Large-Cap | 87% | 75% |
| Mid-Cap | 12% | 20% |
| Small-Cap | 0% | 4% |
Sector Weights
The sector weights between EFA and IEFA are nearly identical, as of 12/31/2022.
| EFA | IEFA | |
| Financials | 18.60% | 17.59% |
| Industrials | 15.01% | 16.09% |
| Health Care | 13.50% | 12.51% |
| Consumer Discretionary | 11.03% | 11.20% |
| Consumer Staples | 10.43% | 9.83% |
| Information Technology | 7.79% | 7.99% |
| Materials | 7.77% | 7.97% |
| Energy | 4.94% | 4.63% |
| Communication | 4.49% | 4.40% |
| Utilities | 3.47% | 3.84% |
| Real Estate | 2.62% | 3.41% |
Transaction Costs
Both EFA and IEFA are free to trade on many platforms. These are two of the largest and most liquid ETFs, so the bid-ask spreads are extremely low too.
Expenses
EFA sports an .33% expense ratio, while IEFA is a fraction of that at .07%. In other words, EFA is nearly 5x more expensive or 26 basis points more expensive.
Tax Efficiency & Capital Gain Distributions
As with most equity ETFs, neither EFA nor IEFA makes capital gains distributions. Therefore, both funds are about as tax-efficient as can be.
Final Thoughts: IEFA vs EFA
Both EFA and IEFA are large, core funds sponsored and managed by one of the largest asset managers in the world. Additionally, their underlying portfolios are nearly identical and the two funds move in sync. However, EFA is much more expensive, so IEFA is the way to go in most situations.
EFA has a much more liquid options market, so any options-related strategies may call for EFA rather than IEFA (but I would go with IEFA in every other situation I can think of).