SWPPX vs IVV: Comparison by an expert

The Schwab S&P 500 Index Fund (SWPPX) and the Blackrock/iShares S&P 500 Index Fund (IVV) are two of the largest index mutual funds in existence and easily two of the most popular among individual investors. Both SWPPX and IVV track the well-known S&P 500 index and form the core of many investor portfolios. Many investors compare SWPPX vs IVV in order to decide which should be the foundation of their portfolio.

The Short Answer

The main difference is that SWPPX is a mutual fund and IVV is an ETF; however investors should consider several other factors when deciding which is best.

A quick reminder that this site does NOT provide investment recommendations. Fund comparisons (such as this one) are not conducted to identify the “best” fund (since that will vary from investor to investor based on investor-specific factors). Rather, these fund comparison posts are designed to identify and distinguish between the fund details that matter versus the ones that don’t.

The Long Answer

Historical Performance: SWPPX vs IVV

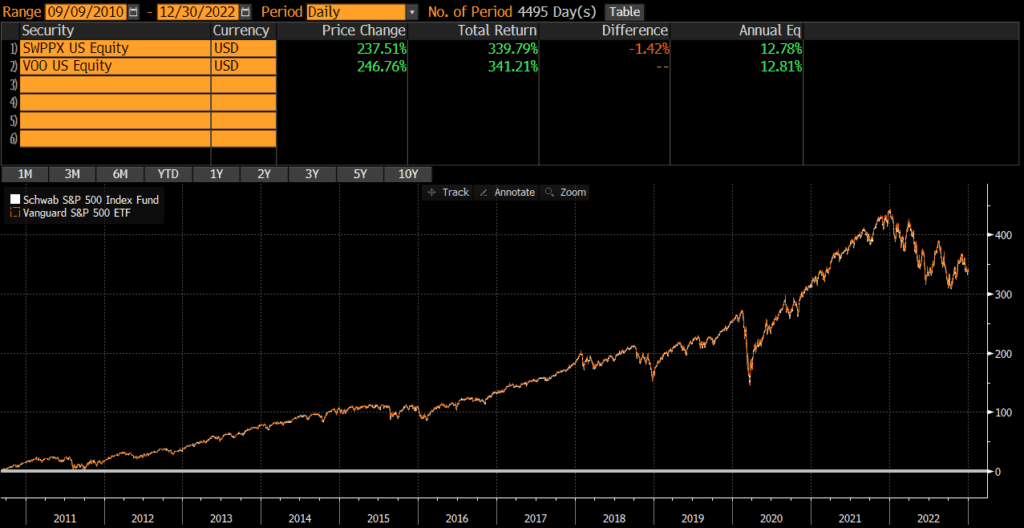
SWPPX was launched back in 1997, while IVV was launched in May 2000. Since then the two funds have performed identically, with a difference of just .01% annually! The cumulative performance difference between these two funds has been just over .4% (over a 23 year timeframe)! Thus, from a performance perspective, I would consider these two funds interchangeable.

Differences between SWPPX vs IVV

Both SWPPX and IVV track the S&P 500, so I will not delve into differences in geographic exposures, sector weights, or market cap coverage. For all intents and purposes, the portfolios are identical with 504 stocks each. The S&P 500 has more than 500 stocks because of the index constituents have multiple share classes of stock (such as GOOG and GOOGL).

Factors to Consider

Transaction Costs

ETFs are free to trade at many brokers and custodians, including Schwab. However, many brokers and custodians still charge commissions and/or transaction fees to buy/sell mutual funds. To my knowledge, Schwab does not participate in the pay-to-play arrangements (with their competitor custodians) that would allow their mutual funds to trade for free on many platforms. So if an investor account is at Schwab, it is generally free to trade SWPPX or IVV. However, only IVV is free to trade in many non-Schwab accounts.

There is a bid-ask spread when trading ETFs, but this spread is typically less than .01% for IVV and individual investor trades will not generally be large enough to “move” the market. In the case of IVV, individual investors should not have a problem trading.

Tax Efficiency & Capital Gain Distributions

ETFs are typically more tax-efficient than mutual funds, due to their ability to avoid realizing capital gains through like-kind redemptions (a process that is beyond the scope of this post). As expected, IVV is more tax-efficient.

SWPPX has made capital gains distributions in the past and I would expect this to continue in future. IVV has never paid out a capital gain distribution, nor do I expect it to in the future. Thus, tax-sensitive investors may want to consider whether ETFs make more sense for them.

Tax Loss Harvesting

My personal preference is to keep a portfolio entirely mutual funds or entirely ETFs, due to the mechanics of settlement during tax loss harvesting. If an ETF has declined in value and an investor sells it, the trade and cash proceeds will not settle for two business days (T+2). That investor may want to “replace” the sold ETF immediately and attempt to buy another ETF or mutual fund simultaneously.

However, mutual funds settle on T+1 basis, so cash for the mutual purchase would be due in one business day (which is one day earlier than the cash from the ETF sale is received). This can obviously cause problems and (even though this issue can be addressed with careful planning) I find it easier to keep accounts invested in similar vehicles. In this case, if a portfolio is all mutual funds, I might lean more towards SWPPX. If all ETFs, I might lean more towards IVV.

On this topic, investors may want to avoid using these two funds as tax loss harvesting substitutes for one another since they could be considered “substantially identical.”

Tradability

SWPPX does not have a stated minimum for purchases, although some brokerages (especially competitors of Schwab) impose minimums. The minimum purchase size for IVV is typically one share, although fractional shares are becoming more common. Investors can trade ETFs intraday, as well as in the pre-market and after-hours trading sessions. Investors can only buy/sell mutual funds once per day. This is not necessarily a major factor for long-term investors however.

Final Thoughts: SWPPX vs IVV

Both SWPPX and IVV are large, core funds sponsored and managed by Schwab and Blackrock’s iShares respectively. Performance has been nearly identical. I view SWPPX and IVV as essentially interchangeable and would not spend too much energy trying to decide which one is “better.”

However, there are some situations that may call for one fund versus another. For instance, many custodians offer free ETF trades, but charge trading fees or redemption fees for mutual funds. So I might select SWPPX or IVV solely based on where my account is held or whether I’m investing taxable vs retirement dollars. Despite these considerations, these two funds are very similar for all intents and purposes.

SWPPX vs VOO: Comparison by an expert

The Schwab S&P 500 Index Fund (SWPPX) and the Vanguard S&P 500 Index Fund (VOO) are two of the largest index mutual funds in existence and easily two of the most popular among individual investors. Both SWPPX and VOO track the well-known S&P 500 index and form the core of many investor portfolios. Many investors compare SWPPX vs VOO in order to decide which should be the foundation of their portfolio.

The Short Answer

The main difference is that SWPPX is a mutual fund and VOO is an ETF; however investors should consider several other factors when deciding which to use.

A quick reminder that this site does NOT provide investment recommendations. Fund comparisons (such as this one) are not conducted to identify the “best” fund (since that will vary from investor to investor based on investor-specific factors). Rather, these fund comparison posts are designed to identify and distinguish between the fund details that matter versus the ones that don’t.

The Long Answer

Historical Performance: SWPPX vs VOO

SWPPX was launched back in 1997, while VOO was launched on September 7, 2010. Since then the two funds have performed identically, with a difference of just .03% annually! The cumulative performance difference between these two funds has been just over 1.4% (over a dozen year timeframe)! Thus, from a performance perspective, I would consider these two funds interchangeable.

Differences between SWPPX vs VOO

Both SWPPX and VOO track the S&P 500, so I will not delve into differences in geographic exposures, sector weights, or market cap coverage. For all intents and purposes, the portfolios are identical with 504 stocks each. The S&P 500 has more than 500 stocks because of the index constituents have multiple share classes of stock (such as GOOG and GOOGL).

Factors to Consider

Transaction Costs

ETFs are free to trade at many brokers and custodians, including Schwab. However, many brokers and custodians still charge commissions and/or transaction fees to buy/sell mutual funds. To my knowledge, Schwab does not participate in the pay-to-play arrangements (with their competitor custodians) that would allow their mutual funds to trade for free on many platforms. So if an investor account is at Schwab, it is generally free to trade SWPPX or VOO. However, only VOO is free to trade in many non-Schwab accounts.

There is a bid-ask spread when trading ETFs, but this spread is typically less than .01% for VOO and individual investor trades will not generally be large enough to “move” the market. In the case of VOO, individual investors should not have a problem trading.

Tax Efficiency & Capital Gain Distributions

ETFs are typically more tax-efficient than mutual funds, due to their ability to avoid realizing capital gains through like-kind redemptions (a process that is beyond the scope of this post). As expected, VOO is more tax-efficient.

SWPPX has made capital gains distributions in the past and I would expect this to continue in future. VOO has never paid out a capital gain distribution, nor do I expect it to in the future. Thus, tax-sensitive investors may want to consider whether ETFs make more sense for them.

Tax Loss Harvesting

My personal preference is to keep a portfolio entirely mutual funds or entirely ETFs, due to the mechanics of settlement during tax loss harvesting. If an ETF has declined in value and an investor sells it, the trade and cash proceeds will not settle for two business days (T+2). That investor may want to “replace” the sold ETF immediately and attempt to buy another ETF or mutual fund simultaneously.

However, mutual funds settle on T+1 basis, so cash for the mutual purchase would be due in one business day (which is one day earlier than the cash from the ETF sale is received). This can obviously cause problems and (even though this issue can be addressed with careful planning) I find it easier to keep accounts invested in similar vehicles. In this case, if a portfolio is all mutual funds, I might lean more towards SWPPX. If all ETFs, I might lean more towards VOO.

On this topic, investors may want to avoid using these two funds as tax loss harvesting substitutes for one another since they could be considered “substantially identical.”

Tradability

SWPPX does not have a stated minimum for purchases, although some brokerages (especially competitors of Schwab) impose minimums. The minimum purchase size for VOO is typically one share, although fractional shares are becoming more common. Investors can trade ETFs intraday, as well as in the pre-market and after-hours trading sessions. Investors can only buy/sell mutual funds once per day. This is not necessarily a major factor for long-term investors however.

Final Thoughts: SWPPX vs VOO

Both SWPPX and VOO are large, core funds sponsored and managed by Schwab and Vanguard respectively. Performance has been nearly identical. I view SWPPX and VOO as essentially interchangeable and would not spend too much energy trying to decide which one is “better.”

However, there are some situations that may call for one fund versus another. For instance, many custodians offer free ETF trades, but charge trading fees or redemption fees for mutual funds. So I might select SWPPX or VOO solely based on where my account is held or whether I’m investing taxable vs retirement dollars. Despite these considerations, these two funds are very similar for all intents and purposes.

SWPPX vs SWTSX: Comparison by an expert

The Schwab S&P 500 Index mutual fund (SWPPX) and the Schwab Total Stock Market Index mutual fund (SWTSX) are two of the largest mutual funds in existence. Both funds are sponsored and managed by Schwab. SWPPX and SWTSX are the core of many investor portfolios and many investors compare SWPPX vs SWTSX in order to decide which should be the foundation of their portfolio.

A quick reminder that this site does NOT provide investment recommendations. Fund comparisons (such as this one) are not conducted to identify the “best” fund (since that will vary from investor to investor based on investor-specific factors). Rather, these fund comparison posts are designed to identify and distinguish between the fund details that matter versus the ones that don’t.

The Short Answer

The main difference between SWPPX and SWTSX is that SWPPX is a large- and mid-cap fund, while SWTSX is a total market fund. Despite these differences, the risk and return between these two funds is pretty close and I largely consider them interchangeable in a portfolio.

The Long Answer

Historical Performance: SWPPX vs SWTSX

SWPPX was launched on May 19, 1997, while SWTSX was launched a couple years later on June 1, 1999. Since then, SWTSX has outperformed by .35% annually. This is not a huge performance differential, but it does compound over time. The cumulative difference between the two funds since common inception is nearly 37%.

Differences between SWPPX vs SWTSX

The biggest difference between SWPPX and SWTSX is the market cap exposure of the funds. SWPPX tracks the S&P 500 index which includes mostly large-caps and some mid-caps, while SWTSX covers much more of the market by including more mid-caps and small-caps.

Geographic Exposure

Both SWPPX and SWTSX hold essentially 100% stocks, so I will not dig into country exposures or market classification here. For all intents and purposes, the two funds have identical exposures.

Market Cap Exposure

SWPPX focuses on the S&P 500 index and so it mostly holds large-caps with a bit of mid-cap exposure. SWTSX tracks the broader Dow Jones U.S. Total Stock Market Index and so it owns many more mid-caps and small-caps (as of 12/31/2022). In other words, SWPPX is a large-cap vehicle, while SWTSX is a total market vehicle. That being said, due to market cap weighting, both funds are overwhelmingly influenced by the large-cap holdings.

SWPPXSWTSX
Large-Cap83%72%
Mid-Cap16%19%
Small-Cap0%9%
Source: ThoughtfulFinance.com, Morningstar

Sector Weights

The sector weights between SWPPX and SWTSX are nearly identical, as of 12/31/2022. The weights are within 1% for every single sector.

SWPPXSWTSX
Basic Materials2.46%2.65%
Consumer Cyclical9.56%9.86%
Financial Services13.89%14.08%
Real Estate2.81%3.45%
Communication Services7.28%6.74%
Energy5.23%5.20%
Industrials9.06%9.79%
Technology23.02%22.62%
Consumer Defensive7.61%6.95%
Healthcare15.90%15.58%
Utilities3.18%3.04%
Source: ThoughtfulFinance.com, Morningstar

Transaction Costs

Many brokers and custodians still charge commissions and/or transaction fees to buy/sell mutual funds. To my knowledge, Schwab does not participate in the pay-to-play arrangements (with their competitor custodians) that would allow their mutual funds to trade for free on many platforms. So if an investor account is at Schwab, it is generally free to trade SWPPX or SWTSX.

It is worth noting that neither fund has a minimum for initial or additional investments. That being said, investors looking for free trades may want to consider an a total market ETF or large-cap ETF, rather than SWTSX or SWPPX.

Expenses

Some investors may point out that the expense ratios between SWTSX and SWPPX differ. This is true, but it is also reflected in the net performance chart above. At a certain level, differences in expense ratio do not matter that much. In this case, the difference in expenses is fractions of a hundredth of a percent, so no need to compare or split hairs.

Tax Efficiency & Capital Gain Distributions

Both funds have made capital gains distributions in the past and will likely make them in the future. It is not possible to say which one will be more tax-efficient in the future. As index funds, the tax drag on both funds is very low. However, tax-sensitive taxable investors may want to consider using an ETF in lieu of either of these funds.

Final Thoughts: SWPPX vs SWTSX

Both SWPPX and SWTSX are large, core funds sponsored and managed by one of the largest asset managers in the world (Schwab). Beyond market cap exposures, the funds appear and act very similar. Long-term performance has been nearly identical. I view these two funds as essentially interchangeable and would not spend too much energy splitting hairs to decide which one is “better.”

ACWI vs SPGM: Liquidity vs Price

The iShares MSCI All-Country World Index ETF (ACWI) and the iShares Core MSCI All-Country World Index ETF (SPGM) are two popular funds and sponsored by Blackrock’s iShares and State Street SPDRs respectively. ACWI is one of the largest ETFs, while SPGM is quite small. As their names suggest, ACWI and SPGM are a core holding of many portfolios. Many investors compare SPGM vs ACWI in order to decide which should be the foundation of their portfolio.

A quick reminder that this site does NOT provide investment recommendations. Fund comparisons (such as this one) are not conducted to identify the “best” fund (since that will vary from investor to investor based on investor-specific factors). Rather, these fund comparison posts are designed to identify and distinguish between the fund details that matter versus the ones that don’t.

The Short Answer

ACWI and SPGM are nearly identical is most ways, but ACWI is much larger, liquid, and more expensive than SPGM. Deciding between ACWI and SPGM depends on the tradeoffs that an investor is willing to make.

The Longer Answer

These funds are nearly identical in most ways, although ACWI is a much more expensive fund. However, ACWI is much larger and more liquid than SPGM.

ACWI and SPGM track different indices. The older ACWI tracks the large-cap MSCI All-Country World Index Index, while SPGM tracks the MSCI All-Country World Index Investable Market Index (IMI) which owns more mid-caps and small-caps (see our comparison of the indices here).

History of ACWI and SPGM

ACWI was the first All-Country World Index ETF to launch, back in 2008. This first mover advantage gave it an edge in accumulating assets under management (AUM) and became the liquid vehicle of choice for traders. Even as other All-Country World Index ETFs launched and competitors engaged in cutting fees, ACWI was able to command premium fees due to its size and liquidity. Since SPGM and other similar funds have (to date) been unable to raise substantial assets, ACWI has been able to continue charging fees that are multiples of its competitors.

Historical Performance: SPGM vs ACWI

Since SPGM’s launch in October 2012, it has outperformed ACWI by .38% annually! This has mostly been driven by the fee differential, which currently stands at .23%. The cumulative performance over the past 10 years is over 1%. As the below chart illustrates, the two funds move in lockstep, but the ACWI’s performance is degraded by its expenses.

Differences between SPGM vs ACWI

These two funds are nearly identical in every way. Beyond the expenses, the biggest difference between ACWI and SPGM is the market cap exposure of the funds.

Geographic Exposure

The country exposures of the two funds appears nearly identical. Below are the top country exposures as of 12/31/2022.

ACWISPGM
United States60.12%59.65%
Japan5.53%6.10%
United Kingdom3.85%4.35%
Canada3.08%3.29%
China3.61%3.04%
Source: ThoughtfulFinance.com, iShares, State Street

Market Cap Exposure

ACWI tracks the large- and mid-cap MSCI All-Country World Index Index, while SPGM tracks the more expansive Investable Market Index (IMI) version of the index. So SPGM owns many more mid-caps and small-caps. In other words, ACWI is a large-cap vehicle, while SPGM is a total market vehicle. That being said, due to market cap weighting, both funds are overwhelmingly influenced by the large-cap holdings.

ACWISPGM
Large-Cap84%81%
Mid-Cap16%12%
Small-Cap0%6%
Source: ThoughtfulFinance.com, Morningstar (as of 1/31/2023)

Sector Weights

The sector weights between ACWI and SPGM are nearly identical, as of 12/31/2022.

ACWISPGM
Information Technology19.90%19.19%
Financials15.05%14.45%
Health Care13.33%13.24%
Consumer Discretionary10.42%12.17%
Industrials10.10%10.68%
Consumer Staples7.74%7.23%
Communication6.77%6.53%
Energy5.56%5.74%
Materials4.97%4.87%
Utilities3.18%3.08%
Real Estate2.61%2.74%
Source: ThoughtfulFinance.com, iShares, State Street

Transaction Costs

Both ACWI and SPGM are free to trade on many platforms. ACWI is one of the largest ETFs around with bid-ask spreads of .01%, while SPGM has not attracted much assets and sports a .13% bid-ask spread.

Expenses

ACWI sports an .32% expense ratio, while SPGM is a fraction of that at .09%. In other words, ACWI is 3x more expensive or 23 basis points more expensive.

Tax Efficiency & Capital Gain Distributions

As with most equity ETFs, neither ACWI nor SPGM makes capital gains distributions. Therefore, both funds are about as tax-efficient as can be.

Final Thoughts: SPGM vs ACWI

Both ACWI and SPGM are large, core funds sponsored and managed by the largest asset managers in the world. Additionally, their underlying portfolios are nearly identical and the two funds move in sync. ACWI is much larger, liquid, and cheaper to trade, although it is also more expensive. Deciding which fund is better is a tough call in my opinion and I do not think there is a right answer as far as which fund is “better.”

ACWI has a much more liquid options market, so any options-related strategies may call for ACWI rather than SPGM.

ACWX vs IXUS: Comparison (and a clear winner)

The iShares MSCI All-Country World Index ex-US ETF (ACWX) and the iShares Core MSCI All-Country World Index ex-US ETF (IXUS) are two of the largest ETFs in existence and both are sponsored by Blackrock’s iShares. As their names suggest, ACWX and IXUS are a core holding of many portfolios. Many investors compare IXUS vs ACWX in order to decide which should be the foundation of their portfolio.

A quick reminder that this site does NOT provide investment recommendations. Fund comparisons (such as this one) are not conducted to identify the “best” fund (since that will vary from investor to investor based on investor-specific factors). Rather, these fund comparison posts are designed to identify and distinguish between the fund details that matter versus the ones that don’t.

The Short Answer

ACWX and IXUS are nearly identical is most ways, but ACWX is much more expensive than IXUS. In most situations, IXUS is preferable to ACWX.

The Longer Answer

These funds are nearly identical in most ways, although ACWX is a much more expensive fund.

ACWX and IXUS track different indices. The older ACWX tracks the large-cap MSCI All-Country World Index ex-US Index, while IXUS tracks the MSCI All-Country World Index ex-US Investable Market Index (IMI) which owns more mid-caps and small-caps (see our comparison of the indices here).

History of ACWX and IXUS

ACWX was one of the first (if not the first) All-Country World Index ex-US ETF to launch, back in 2008. This first mover advantage gave it an edge in accumulating assets under management (AUM) and became the liquid vehicle of choice for traders. Even as other All-Country World Index ex-US ETFs launched and competitors engaged in cutting fees, ACWX was able to command premium fees. However, Vanguard and other sponsors were able to begin capturing market share with ever decreasing costs. Blackrock (which owns iShares) needed to respond with a lower cost option, but did not want to sacrifice their golden goose ACWX. So rather than cut ACWX’s fees, they launched IXUS at a much lower fee level. Essentially, they created IXUS to compete with Vanguard without giving up the high fees that ACWX was collecting.

Historical Performance: IXUS vs ACWX

Since IXUS’s launch in October 2012, it has outperformed ACWX by .33% annually. This has mostly been driven by the fee differential, which currently stands at .25%. The cumulative performance over the past 10 years is about 5%. As the below chart illustrates, the two funds move in lockstep, but the ACWX’s performance is degraded by its expenses.

Differences between IXUS vs ACWX

These two funds are nearly identical in every way. Beyond the expenses, the biggest difference between ACWX and IXUS is the market cap exposure of the funds.

Geographic Exposure

The country exposures of the two funds appears nearly identical. Below are the top country exposures as of 12/31/2022.

ACWXIXUS
Japan13.95%14.96%
United Kingdom9.69%9.74%
China9.12%8.19%
Canada7.71%7.64%
France7.57%6.80%
Source: ThoughtfulFinance.com, iShares

Market Cap Exposure

ACWX tracks the large- and mid-cap MSCI All-Country World Index ex-US Index, while IXUS tracks the more expansive Investable Market Index (IMI) version of the index. So IXUS owns many more mid-caps and small-caps. In other words, ACWX is a large-cap vehicle, while IXUS is a total market vehicle. That being said, due to market cap weighting, both funds are overwhelmingly influenced by the large-cap holdings.

ACWXIXUS
Large-Cap87%75%
Mid-Cap12%19%
Small-Cap0%4%
Source: ThoughtfulFinance.com, Morningstar (as of 1/31/2023)

Sector Weights

The sector weights between ACWX and IXUS are nearly identical, as of 12/31/2022.

ACWXIXUS
Financials20.99%19.48%
Industrials12.16%13.25%
Consumer Discretionary11.30%11.32%
Information Technology10.69%10.69%
Health Care9.80%9.45%
Consumer Staples8.88%8.78%
Materials8.32%8.51%
Energy6.02%5.73%
Communication5.91%5.59%
Utilities3.30%3.36%
Real Estate2.24%3.31%
Source: ThoughtfulFinance.com, iShares

Transaction Costs

Both ACWX and IXUS are free to trade on many platforms. These are two of the largest and most liquid ETFs, so the bid-ask spreads are extremely low too.

Expenses

ACWX sports an .32% expense ratio, while IXUS is a fraction of that at .07%. In other words, ACWX is 5x more expensive or 25 basis points more expensive.

Tax Efficiency & Capital Gain Distributions

As with most equity ETFs, neither ACWX nor IXUS makes capital gains distributions. Therefore, both funds are about as tax-efficient as can be.

Final Thoughts: IXUS vs ACWX

Both ACWX and IXUS are large, core funds sponsored and managed by one of the largest asset managers in the world. Additionally, their underlying portfolios are nearly identical and the two funds move in sync. However, ACWX is much more expensive, so IXUS is the way to go in most situations.

IEFA vs EFA: Comparison (and a clear winner)

The iShares MSCI EAFE ETF (EFA) and the iShares Core MSCI EAFE ETF (IEFA) are two of the largest ETFs in existence and both are sponsored by Blackrock’s iShares. EAFE is a acronym that stands for Europe, Australasia, and Far East and so is used to describe developed markets (excluding the Americas). As their names suggest, EFA and IEFA are a core international holding of many portfolios. Many investors compare IEFA vs EFA in order to decide which should be the foundation of their portfolio.

A quick reminder that this site does NOT provide investment recommendations. Fund comparisons (such as this one) are not conducted to identify the “best” fund (since that will vary from investor to investor based on investor-specific factors). Rather, these fund comparison posts are designed to identify and distinguish between the fund details that matter versus the ones that don’t.

The Short Answer

EFA and IEFA are nearly identical is most ways, but EFA is much more expensive than IEFA. In most situations, IEFA is preferable to EFA.

The Longer Answer

These funds are nearly identical in most ways, although EFA is a much more expensive fund.

EFA and IEFA track different indices. The older EFA tracks the large-cap MSCI EAFE Index, while IEFA tracks the MSCI EAFE Investable Market Index (IMI) which owns more mid-caps and small-caps (see our comparison of the indices here).

History of EFA and IEFA

EFA was the first EAFE ETF to launch, back in 2001. This first mover advantage gave it an edge in accumulating assets under management (AUM) and became the liquid vehicle of choice for traders. Even as other EAFE ETFs launched and competitors engaged in cutting fees, EFA was able to command premium fees. However, Vanguard and other sponsors were able to begin capturing market share with ever decreasing costs. Blackrock (which owns iShares) needed to respond with a lower cost option, but did not want to sacrifice their golden goose EFA. So rather than cut EFA’s fees, they launched IEFA at a much lower fee level. Essentially, they created IEFA to compete with Vanguard without giving up the high fees that EFA was collecting.

Historical Performance: IEFA vs EFA

Since IEFA’s launch in October 2012, it has outperformed EFA by .36% annually! This has mostly been driven by the fee differential, which currently stands at .26%. The cumulative performance over the past 10 years is nearly 6%. As the below chart illustrates, the two funds move in lockstep, but EFA’s performance is degraded by its expenses.

Differences between IEFA vs EFA

These two funds are nearly identical in every way. Beyond the expenses, the biggest difference between EFA and IEFA is the market cap exposure of the funds.

Geographic Exposure

The country exposures of the two funds appears nearly identical. Below are the top country exposures as of 12/31/2022.

EFAIEFA
Japan21.87%23.23%
United Kingdom15.21%15.14%
France11.81%10.59%
Switzerland10.11%9.31%
Germany8.12%8.22%
Source: ThoughtfulFinance.com, iShares

Market Cap Exposure

EFA tracks the large- and mid-cap MSCI EAFE Index, while IEFA tracks the more expansive Investable Market Index (IMI) version of the index. So IEFA owns many more mid-caps and small-caps. In other words, EFA is a large-cap vehicle, while IEFA is a total market vehicle. That being said, due to market cap weighting, both funds are overwhelmingly influenced by the large-cap holdings.

EFAIEFA
Large-Cap87%75%
Mid-Cap12%20%
Small-Cap0%4%
Source: ThoughtfulFinance.com, Morningstar (as of 1/31/2023)

Sector Weights

The sector weights between EFA and IEFA are nearly identical, as of 12/31/2022.

EFAIEFA
Financials18.60%17.59%
Industrials15.01%16.09%
Health Care13.50%12.51%
Consumer Discretionary11.03%11.20%
Consumer Staples10.43%9.83%
Information Technology7.79%7.99%
Materials7.77%7.97%
Energy4.94%4.63%
Communication4.49%4.40%
Utilities3.47%3.84%
Real Estate2.62%3.41%
Source: ThoughtfulFinance.com, iShares

Transaction Costs

Both EFA and IEFA are free to trade on many platforms. These are two of the largest and most liquid ETFs, so the bid-ask spreads are extremely low too.

Expenses

EFA sports an .33% expense ratio, while IEFA is a fraction of that at .07%. In other words, EFA is nearly 5x more expensive or 26 basis points more expensive.

Tax Efficiency & Capital Gain Distributions

As with most equity ETFs, neither EFA nor IEFA makes capital gains distributions. Therefore, both funds are about as tax-efficient as can be.

Final Thoughts: IEFA vs EFA

Both EFA and IEFA are large, core funds sponsored and managed by one of the largest asset managers in the world. Additionally, their underlying portfolios are nearly identical and the two funds move in sync. However, EFA is much more expensive, so IEFA is the way to go in most situations.

EFA has a much more liquid options market, so any options-related strategies may call for EFA rather than IEFA (but I would go with IEFA in every other situation I can think of).

IEMG vs EEM: Comparison With A Clear Winner

The iShares MSCI Emerging Markets ETF (EEM) and the iShares Core MSCI Emerging Markets ETF (IEMG) are two of the largest ETFs in existence and both are sponsored by Blackrock’s iShares. As their names suggest, EEM and IEMG are a core holding of many portfolios. Many investors compare IEMG vs EEM in order to decide which should be the foundation of their portfolio.

A quick reminder that this site does NOT provide investment recommendations. Fund comparisons (such as this one) are not conducted to identify the “best” fund (since that will vary from investor to investor based on investor-specific factors). Rather, these fund comparison posts are designed to identify and distinguish between the fund details that matter versus the ones that don’t.

The Short Answer

EEM and IEMG are nearly identical is most ways, but EEM is much more expensive than IEMG. In most situations, IEMG is preferable to EEM.

The Longer Answer

These funds are nearly identical in most ways, although EEM is a much more expensive fund.

EEM and IEMG track different indices. The older EEM tracks the large-cap MSCI Emerging Markets Index, while IEMG tracks the MSCI Emerging Markets Investable Market Index (IMI) which owns more mid-caps and small-caps (see our comparison of the indices here).

History of EEM and IEMG

EEM was the first emerging markets ETF to launch, back in 2003. This first mover advantage gave it an edge in accumulating assets under management (AUM) and became the liquid vehicle of choice for traders. Even as other emerging markets ETFs launched and competitors engaged in cutting fees, EEM was able to command premium fees. However, Vanguard and other sponsors were able to begin capturing market share with ever decreasing costs. Blackrock (which owns iShares) needed to respond with a lower cost option, but did not want to sacrifice their golden goose EEM. So rather than cut EEM’s fees, they launched IEMG at a much lower fee level. Essentially, they created IEMG to compete with Vanguard without giving up the high fees that EEM was collecting.

Historical Performance: IEMG vs EEM

Since IEMG’s launch in October 2012, it has outperformed EEM by .78% annually! This has mostly been driven by the fee differential, which currently stands at .6%. The cumulative performance over the past 10 years is over 10%. As the below chart illustrates, the two funds move in lockstep, but the EEM’s performance is degraded by its expenses.

Differences between IEMG vs EEM

These two funds are nearly identical in every way. Beyond the expenses, the biggest difference between EEM and IEMG is the market cap exposure of the funds.

Geographic Exposure

The country exposures of the two funds appears nearly identical. Below are the top country exposures as of 12/31/2022.

EEMIEMG
China32.20%29.21%
India14.38%15.45%
Taiwan13.75%14.48%
Korea11.27%11.58%
Brazil5.24%5.28%
Source: ThoughtfulFinance.com, iShares

Market Cap Exposure

EEM tracks the large- and mid-cap MSCI Emerging Markets Index, while IEMG tracks the more expansive Investable Market Index (IMI) version of the index. So IEMG owns many more mid-caps and small-caps. In other words, EEM is a large-cap vehicle, while IEMG is a total market vehicle. That being said, due to market cap weighting, both funds are overwhelmingly influenced by the large-cap holdings.

EEMIEMG
Large-Cap91%79%
Mid-Cap10%17%
Small-Cap0%5%
Source: ThoughtfulFinance.com, Morningstar

Sector Weights

The sector weights between EEM and IEMG are nearly identical, as of 12/31/2022.

EEMIEMG
Financials22.01%20.44%
Information Technology18.59%18.18%
Consumer Discretionary14.02%13.62%
Communication9.85%9.36%
Materials8.78%9.10%
Consumer Staples6.41%7.28%
Industrials6.04%6.42%
Energy4.86%4.77%
Healthcare4.07%4.55%
Utilities3.04%3.08%
Real Estate1.94%2.58%
Source: ThoughtfulFinance.com, iShares

Transaction Costs

Both EEM and IEMG are free to trade on many platforms. These are two of the largest and most liquid ETFs, so the bid-ask spreads are extremely low too.

Expenses

EEM sports an .69% expense ratio, while IEMG is a fraction of that at .09%. In other words, EEM is 7x more expensive or 60 basis points more expensive.

Tax Efficiency & Capital Gain Distributions

As with most equity ETFs, neither EEM nor IEMG makes capital gains distributions. Therefore, both funds are about as tax-efficient as can be.

Final Thoughts: IEMG vs EEM

Both EEM and IEMG are large, core funds sponsored and managed by one of the largest asset managers in the world. Additionally, their underlying portfolios are nearly identical and the two funds move in sync. However, EEM is much more expensive, so IEMG is the way to go in most situations.

EEM has a much more liquid options market, so any options-related strategies may call for EEM rather than IEMG (but I would go with IEMG in every other situation I can think of).

529 vs Coverdell ESA

Two of the most popular ways to save for future educational expenses are the 529 college savings plan and the Coverdell Education Savings Account (ESA). Both are a great way to save for future educational expenses.

The two account types are similar in many ways, but there are important differences. Many people ask whether they should contribute to one or the other. The short answer is contribute to both!

People other than parents can contribute to both 529 and ESA accounts, but my strong advice to most parents is to buy enough term life insurance and establish an estate plan BEFORE saving for education.

529 vs Coverdell: The Longer Answer

When evaluating 529 vs Coverdell accounts, the thing to remember is that both 529 and Coverdell ESA accounts are tools to save for education, but there are some major differences. Below are some of the main features and differences between the two programs.

I should note that the below is not exhaustive, but covers the factors that I consider when evaluating how to save for my own family’s education expenses. To read the all of the rules relating to 529 and Coverdell accounts, read IRS publication 970.

529 Accounts

529 Contributions

  • 529 contributions are made with post-tax dollars. However, some states’ plans offer state income tax deductions for contributions.
  • Contribution limits vary by state, but are generally in the hundreds of thousands of dollars and not a factor for most people.
    • Only contributions below the annual gift tax exclusion ($17,000/year for 2023) do not count against one’s lifetime gift tax exemption ($12.92 million for 2023).
    • The IRS does allow individuals to contribute five years of the gift tax exclusion amount without counting against the lifetime exemption. For instance, someone could contribute $85,000 to a 529 in year one, without using any lifetime gift tax exemption. Similarly, two parents could contribute $170,000 in year one.
  • Contributions are not limited by one’s income.

529 Investments

  • 529 accounts are limited to mutual funds (often in preset model allocations) and allocations can only be changed once per year.

529 Distributions

  • Distributions from a 529 are tax-free if used towards qualified education expenses. The definitions of qualified education expenses (which differs from a Coverdell ESA’s) is quite detailed, so read the IRS guidelines for 529s. Below are a couple of areas that differ materially from Coverdell ESAs:
    • Only $10,000 per year can be used towards K-12 tuition and fees, while computers, books, room and board, and other items are reserved for college expenses.
    • $10,000 can be used towards student loan payments. This is a lifetime limit and not per year.
  • Unlike Coverdell ESAs, there is no age limit for beneficiaries of 529s. Even an adult could open a 529 to save for their future education expenses!

Rollovers

  • Beneficiaries can be changed and/or the assets rolled into a family member’s 529. Family member is of course defined by the IRS 🙂

Coverdell Educational Savings Account (ESA)

Coverdell Contributions

  • Coverdell ESA contributions are made with post-tax dollars.
  • Contributions are limited to $2,000 per year.
  • Contributions are limited by one’s income. However, a common tax strategy is outlined below.

Coverdell ESA Tax Strategy

There is an income limitation for Coverdell ESA donations; someone cannot contribute to a Coverdell if their modified adjusted gross income (MAGI) is above $110,000 individually (or $220,000 jointly) in any tax year.

Interestingly, the IRS clarifies (in Publication 970) that “organizations, such as corporations and trusts can also contribute to Coverdell ESAs. There is no requirement that an organization’s income be below a certain level.” Many investors read this to mean that they can make an eligible contribution from their revocable trust, even if their individual or joint income is above the limit. Thus, many high-earners contribute to Coverdell accounts (regardless of their income) by making contributions through a trust.

Coverdell ESA Investments

  • Coverdell ESAs can be invested in many tradable securities, such as stocks, bonds, ETFs, mutual funds, etc.

Coverdell ESA Distributions

  • Distributions from a Coverdell ESA are tax-free if used towards qualified education expenses. The definitions of an ESA’s qualified education expenses (which differs from a 529’s) is quite detailed, so read the IRS guidelines for 529s. Below are a couple of areas that differ materially from 529s:
    • Coverdell ESA’s cover elementary, secondary, and college expenses (unlike 529s which focus primarily on college expenses).
    • Coverdell ESA funds cannot be used towards student loan payments.
  • Coverdell ESAs need to be fully distributed by the time the beneficiary is 30 years old.

Rollovers

  • Beneficiaries can be changed and/or the assets rolled into the Coverdell ESA of a family member under the age of 30 (with certain exceptions). Again, family member is defined by the IRS.

Q&A: Coverdell vs 529

Are 529 and Coverdells the same thing?

No, 529 and Coverdell accounts are not the same thing; they are different types of accounts. A 529 is not a Coverdell plan and a Coverdell is not a 529 plan.

Can you have a Coverdell and a 529 plan?

Yes, people can both a Coverdell and a 529 plan.

Can you contribute to a Coverdell and a 529?

Yes, people can contribute to both Coverdell and 529 accounts, even in the same year.

Should you contribute to a Coverdell or a 529 or both?

If I was going to contribute less than $2,000 per year, I would only contribute a Coverdell ESA.

Those who are contributing the maximum allowable amounts to a 529 and don’t want to maintain additional Coverdell ESA accounts, may want to just stick to 529. The rationale being: why open and maintain a Coverdell with $2,000 if opening and depositing $170,000 into a 529.

Those who want to maximize contributions and tax savings can open both a Coverdell and a 529, although I prioritize the Coverdell for the first $2,000.

Is 529 better than Coverdell?

Neither 529 nor Coverdell is “better.” The savings programs are different and the best choice will vary from person to person.

Should I used 529 or Coverdell first?

Generally, I contribute to Coverdell accounts first. However, the state tax benefits in certain states makes it more attractive to contribute to 529s first.

MSCI ACWI vs MSCI ACWI IMI (Investable Market Index)

The MSCI ACWI Index and the MSCI ACWI IMI (Index Investable Market Index) are two of the most followed global stock indices. Many portfolios and investment vehicles are benchmarked to each index.

The MSCI ACWI Index and the MSCI ACWI IMI have some slight differences, but performance has been nearly identical. The below performance chart of the MSCI ACWI and MSCI ACWI IMI illustrates that the MSCI ACWI Index has outperformed the IMI version on a backtested basis. However, returns since the MSCI EM IMI’s inception have been nearly identical. This similar to the findings in my analysis of the Russell 1000 vs S&P 500 and MSCI EM vs MSCI EM IMI.

A quick note that investors cannot invest directly in an index. These unmanaged indexes do not reflect management fees and transaction costs that are associated with an investable vehicle, such as the iShares ACWI ETF (symbol: ACWI) or the State Street SPDR Portfolio MSCI Global Stock ETF (symbol: SPGM). A reminder that these are simply examples as this site does NOT provide investment recommendations.

What is the difference between MSCI ACWI and MSCI ACWI IMI?

The MSCI ACWI IMI (Investable Market Index) is similar to the traditional MSCI ACWI Index (non-IMI), but it has many more constituent stocks and includes more exposure to mid-caps and small-caps.

What does MSCI ACWI IMI mean?

The IMI in “MSCI ACWI IMI” stands for “Investable Market Index” and connotes that it includes more stocks than the original ACWI index.

Historical Performance: MSCI ACWI vs MSCI ACWI IMI

The MSCI ACWI Index was launched in 2001, while the MSCI ACWI IMI Index was launched a few years later in 2007. Since inception, the MSCI ACWI IMI has outperformed the original MSCI ACWI Index by .60% per year (5.71% vs 6.31%, respectively). The cumulative performance differential over that time period has been over 20%!

Composition Differences: MSCI ACWI vs MSCI ACWI IMI

Both the MSCI ACWI vs MSCI ACWI IMI indices are broad-based indices that represent the equity markets of developed nations. As of 12/31/2022, the indices have similar geographic exposures, similar sector weights, and slightly different market cap exposures.

Geography

The MSCI ACWI index and the ACWI IMI have identical country constituents, although the weight vary ever so slightly. Below are the weights of the top five countries.

MSCI ACWI IndexMSCI ACWI Investable Market Index
US60.37%59.35%
Japan5.56%6.1%
United Kingdom3.87%3.98%
China3.63%3.35%
Canada3.06%3.12%
Source: ThoughtfulFinance.com, MSCI

Both indices include both developed and emerging markets, which helpful since each have had periods of outperformance.

Market Capitalization

One of the main differences between the two indices is that the MSCI ACWI Investable Market Index (IMI) has many more constituents that the original MSCI ACWI Index. According to MSCI, the number of constituents is as follows:

MSCI ACWI IndexMSCI ACWI IMI Index
Constituent Stocks2,8859,154
Source: ThoughtfulFinance.com, MSCI (data as of 12/30/2022)

Additionally, the two indices have slightly different market cap exposures. Using the iShares ACWI ETF (which tracks the MSCI ACWI Index) (symbol ACWI) and the State Street SPDR Portfolio MSCI Global Stock ETF (which tracks the MSCI ACWI IMI Index) (symbol SPGM) as proxies, we can infer the below market cap weights of each index.

MSCI ACWI IndexMSCI ACWI IMI Index
Large Cap85%81%
Mid Cap16%14%
Small Cap0%6%
Source: ThoughtfulFinance.com, Morningstar.com (as of 11/30/2022)

Sector Weights

Again, using ACWI and SPGM as proxies, we can infer the index weights are very similar.

MSCI ACWI IMIMSCI ACWI Index
Basic Materials5.01%4.86%
Consumer Cyclical10.50%10.43%
Financial Services16.50%15.49%
Real Estate2.74%3.28%
Communication Services7.14%7.25%
Energy5.49%5.62%
Industrials10.19%12.21%
Technology18.81%18.46%
Consumer Defensive7.67%7.18%
Healthcare12.93%12.90%
Utilities3.02%2.32%
Source: ThoughtfulFinance.com, Morningstar.com (as of 1/18/2023)

Final Thoughts on MSCI ACWI Index vs ACWI IMI

Investors cannot invest in indices directly and should do their own research before deciding to invest in a fund that tracks either index. That being said, these two indices appear nearly identical in terms of geographic, market cap, and sector exposure. For all intents and purposes, I would argue that these two benchmarks are interchangeable.

With such a small performance difference, the costs of actual investment strategies/vehicles may be a larger consideration than which benchmark to select. Sometimes benchmark selection matters quite a bit, although that does not appear to be the case between these two indices. Interested readers may want to read my review of ACWI, the best known MSCI ACWI index fund.

MSCI EAFE Index vs MSCI EAFE IMI (Investable Market Index)

The MSCI EAFE Index and the MSCI EAFE IMI (Index Investable Market Index) are two of the most followed international stock indices. Many portfolios and investment vehicles are benchmarked to each index.

The MSCI EAFE Index and the MSCI EAFE IMI have some slight differences, but performance has been nearly identical. The below performance chart of the MSCI EAFE and MSCI EAFE IMI illustrates that the MSCI EAFE Index has outperformed the IMI version on a backtested basis. However, returns since the MSCI EAFE IMI’s inception have been nearly identical. This similar to the findings in my analysis of the Russell 1000 vs S&P 500 and MSCI EM vs MSCI EM IMI.

A quick note that investors cannot invest directly in an index. These unmanaged indexes do not reflect management fees and transaction costs that are associated with an investable vehicle, such as the iShares EAFE ETF (symbol: EFA) or the iShares Core EAFE ETF (symbol: IEFA). A reminder that these are simply examples as this site does NOT provide investment recommendations.

What is the difference between MSCI EAFE and MSCI EAFE IMI?

The MSCI EAFE IMI (Investable Market Index) is similar to the traditional MSCI EAFE Index (non-IMI), but it has many more constituent stocks and includes more exposure to mid-caps and small-caps.

What does MSCI EAFE IMI mean?

The IMI in “MSCI EAFE IMI” stands for “Investable Market Index” and connotes that it includes more stocks than the original EAFE index.

Historical Performance: MSCI EAFE Index vs MSCI EAFE IMI

The MSCI EAFE Index was launched way back in 1986, while the MSCI EAFE IMI Index was launched 21 years later in 2007. However, MSCI has provided backtested data that goes back about a dozen years before that. Since 1994, the MSCI EAFE Index has outperformed the MSCI EAFE IMI Index by about 1.25% per year (5.11% vs 3.86%, respectively). The cumulative performance differential over that time period has been over 120%!

However, when we chart the performance of MSCI EAFE vs MSCI EAFE IMI since 2007 (below), we find that performance has been nearly identical: 2.39% vs 2.30% annualized. The cumulative performance difference has been roughly 2%! I haven’t yet dug into the why this is (technically called performance attribution analysis), but it is a topic for future research. In the meantime, it is clear that the indices have performed identically since their common inception in 2007.

Composition Differences: MSCI EAFE Index vs MSCI EAFE IMI

Both the MSCI EAFE vs MSCI EAFE IMI indices are broad-based indices that represent the equity markets of developed nations. As of 12/31/2022, the indices have identical geographic exposures, similar sector weights, and slightly different market cap exposures.

Geography

The MSCI EAFE index and the EAFE IMI have identical country constituents, although the weight vary ever so slightly. Below are the weights of the top five countries.

MSCI EAFE IndexMSCI EAFE Investable Market Index
Japan21.94%23.36%
United Kingdom15.27%15.24%
France11.85%10.67%
Switzerland10.14%9.34%
Australia8.15%8.26%
Source: ThoughtfulFinance.com, MSCI

Market Capitalization

One of the main differences between the two indices is that the MSCI EAFE Investable Market Index (IMI) has many more constituents that the original MSCI EAFE Index. According to MSCI, the number of constituents is as follows:

MSCI EAFE IndexMSCI EAFE IMI Index
Constituent Stocks3,073796
Source: ThoughtfulFinance.com, MSCI (data as of 12/30/2022)

Additionally, the two indices have slightly different market cap exposures. Using the iShares EAFE ETF (which tracks the MSCI EAFE Index) (symbol EFA) and the iShares Core EAFE ETF (which tracks the MSCI EAFE IMI Index) (symbol IXUS) as proxies, we can infer the below market cap weights of each index.

MSCI EAFE IndexMSCI EAFE IMI Index
Large Cap88%77%
Mid Cap12%19%
Small Cap0%4%
Source: ThoughtfulFinance.com, Morningstar.com (as of 11/30/2022)

Sector Weights

Again, using EFA and IEFA as proxies, we can infer the index weights are very similar.

MSCI EAFE IndexMSCI EAFE IMI
Basic Materials8.01%8.11%
Consumer Cyclical10.74%11.15%
Financial Services18.74%17.74%
Real Estate2.72%3.86%
Communication Services4.90%4.79%
Energy4.90%4.60%
Industrials14.97%16.09%
Technology8.52%8.66%
Consumer Defensive10.05%9.43%
Healthcare13.30%12.47%
Utilities3.14%3.10%
Source: ThoughtfulFinance.com, Morningstar.com (as of 1/18/2023)

Final Thoughts on MSCI EAFE Index vs EAFE IMI

Investors cannot invest in indices directly and should do their own research before deciding to invest in a fund that tracks either index. That being said, these two indices appear nearly identical in terms of geographic, market cap, and sector exposure. For all intents and purposes, I would argue that these two benchmarks are interchangeable, despite the wide historical performance difference prior to 2007.

With such a small performance difference, the costs of actual investment strategies/vehicles may be a larger consideration than which benchmark to select. Sometimes benchmark selection matters quite a bit, although that does not appear to be the case between these two indices.

Scroll to Top