The iShares MSCI All-Country World Index ETF (ACWI) and the iShares Core MSCI All-Country World Index ETF (SPGM) are two popular funds and sponsored by Blackrock’s iShares and State Street SPDRs respectively. ACWI is one of the largest ETFs, while SPGM is quite small. As their names suggest, ACWI and SPGM are a core holding of many portfolios. Many investors compare SPGM vs ACWI in order to decide which should be the foundation of their portfolio.
A quick reminder that this site does NOT provide investment recommendations. Fund comparisons (such as this one) are not conducted to identify the “best” fund (since that will vary from investor to investor based on investor-specific factors). Rather, these fund comparison posts are designed to identify and distinguish between the fund details that matter versus the ones that don’t.
The Short Answer
ACWI and SPGM are nearly identical is most ways, but ACWI is much larger, liquid, and more expensive than SPGM. Deciding between ACWI and SPGM depends on the tradeoffs that an investor is willing to make.
The Longer Answer
These funds are nearly identical in most ways, although ACWI is a much more expensive fund. However, ACWI is much larger and more liquid than SPGM.
ACWI and SPGM track different indices. The older ACWI tracks the large-cap MSCI All-Country World Index Index, while SPGM tracks the MSCI All-Country World Index Investable Market Index (IMI) which owns more mid-caps and small-caps (see our comparison of the indices here).
History of ACWI and SPGM
ACWI was the first All-Country World Index ETF to launch, back in 2008. This first mover advantage gave it an edge in accumulating assets under management (AUM) and became the liquid vehicle of choice for traders. Even as other All-Country World Index ETFs launched and competitors engaged in cutting fees, ACWI was able to command premium fees due to its size and liquidity. Since SPGM and other similar funds have (to date) been unable to raise substantial assets, ACWI has been able to continue charging fees that are multiples of its competitors.
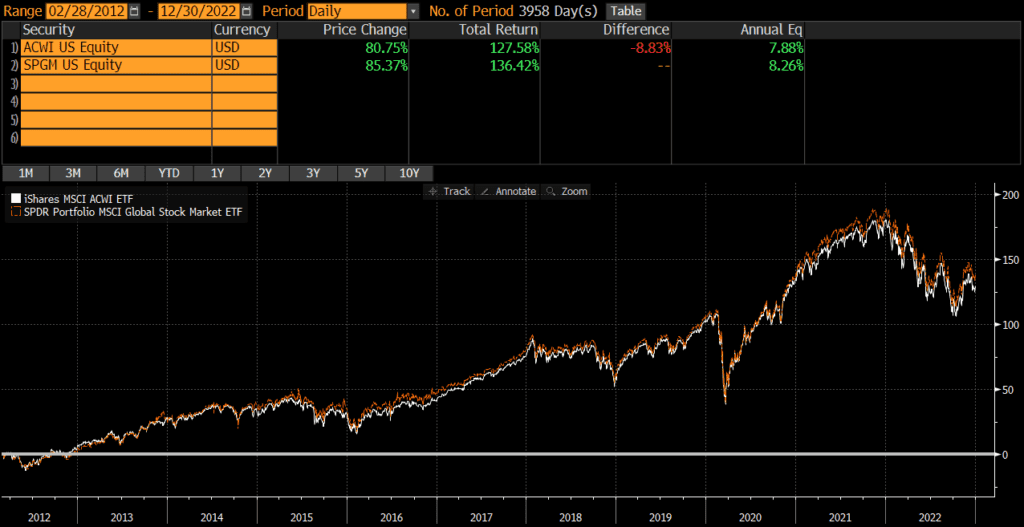
Historical Performance: SPGM vs ACWI
Since SPGM’s launch in October 2012, it has outperformed ACWI by .38% annually! This has mostly been driven by the fee differential, which currently stands at .23%. The cumulative performance over the past 10 years is over 1%. As the below chart illustrates, the two funds move in lockstep, but the ACWI’s performance is degraded by its expenses.
Differences between SPGM vs ACWI
These two funds are nearly identical in every way. Beyond the expenses, the biggest difference between ACWI and SPGM is the market cap exposure of the funds.
Geographic Exposure
The country exposures of the two funds appears nearly identical. Below are the top country exposures as of 12/31/2022.
| ACWI | SPGM | |
| United States | 60.12% | 59.65% |
| Japan | 5.53% | 6.10% |
| United Kingdom | 3.85% | 4.35% |
| Canada | 3.08% | 3.29% |
| China | 3.61% | 3.04% |
Market Cap Exposure
ACWI tracks the large- and mid-cap MSCI All-Country World Index Index, while SPGM tracks the more expansive Investable Market Index (IMI) version of the index. So SPGM owns many more mid-caps and small-caps. In other words, ACWI is a large-cap vehicle, while SPGM is a total market vehicle. That being said, due to market cap weighting, both funds are overwhelmingly influenced by the large-cap holdings.
| ACWI | SPGM | |
| Large-Cap | 84% | 81% |
| Mid-Cap | 16% | 12% |
| Small-Cap | 0% | 6% |
Sector Weights
The sector weights between ACWI and SPGM are nearly identical, as of 12/31/2022.
| ACWI | SPGM | |
| Information Technology | 19.90% | 19.19% |
| Financials | 15.05% | 14.45% |
| Health Care | 13.33% | 13.24% |
| Consumer Discretionary | 10.42% | 12.17% |
| Industrials | 10.10% | 10.68% |
| Consumer Staples | 7.74% | 7.23% |
| Communication | 6.77% | 6.53% |
| Energy | 5.56% | 5.74% |
| Materials | 4.97% | 4.87% |
| Utilities | 3.18% | 3.08% |
| Real Estate | 2.61% | 2.74% |
Transaction Costs
Both ACWI and SPGM are free to trade on many platforms. ACWI is one of the largest ETFs around with bid-ask spreads of .01%, while SPGM has not attracted much assets and sports a .13% bid-ask spread.
Expenses
ACWI sports an .32% expense ratio, while SPGM is a fraction of that at .09%. In other words, ACWI is 3x more expensive or 23 basis points more expensive.
Tax Efficiency & Capital Gain Distributions
As with most equity ETFs, neither ACWI nor SPGM makes capital gains distributions. Therefore, both funds are about as tax-efficient as can be.
Final Thoughts: SPGM vs ACWI
Both ACWI and SPGM are large, core funds sponsored and managed by the largest asset managers in the world. Additionally, their underlying portfolios are nearly identical and the two funds move in sync. ACWI is much larger, liquid, and cheaper to trade, although it is also more expensive. Deciding which fund is better is a tough call in my opinion and I do not think there is a right answer as far as which fund is “better.”
ACWI has a much more liquid options market, so any options-related strategies may call for ACWI rather than SPGM.