KLD 400 vs S&P 500

The KLD 400 index is one of oldest socially responsible investing (SRI) indices and it still offers SRI investors an alternative to traditional indices like the S&P 500. However some differences become apparent when examining the KLD 400 vs S&P 500 and we will explore these below.

A quick note that investors cannot invest directly in an index. These unmanaged indexes do not reflect management fees and transaction costs that are associated with an investable vehicle, such as the iShares MSCI KLD 400 Social ETF (symbol: DSI) or the iShares Core S&P 500 ETF (symbol: IVV). A reminder that these are simply examples as this site does NOT provide investment recommendations.

Historical Performance: KLD 400 vs S&P 500

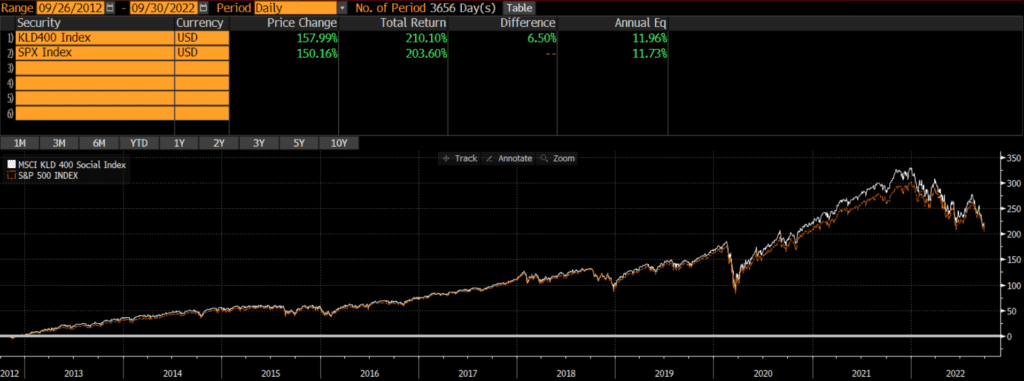
The below KLD 400 vs S&P 500 chart shows that the S&P 500 has outperformed by nearly 1% annually since the KLD 400’s inception in 1990. However, similar to our analysis of the Russell 1000 vs S&P 500, the performance differential is narrower more recently.
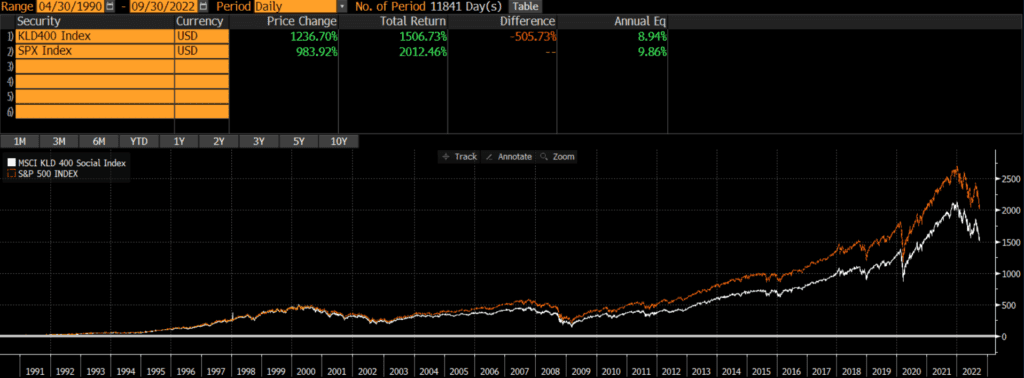
If we shorten the KLD 400 vs S&P 500 graph timeframe to the past 15 years, the performance difference narrows. Over this timeframe the S&P index outperformed the KLD index by 50 basis points annually.
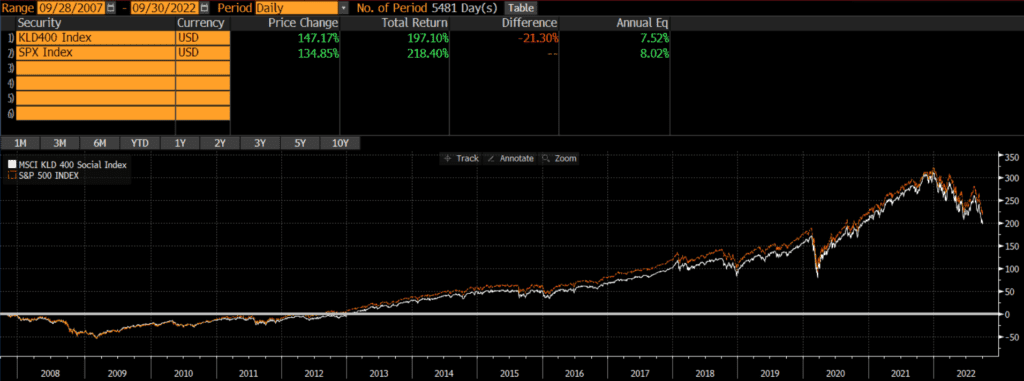
The difference in KLD 400 vs S&P 500 performance flips if we change the chart timeframe to 10 years. Over this timeframe, the KLD has outperformed by nearly a quarter percent annually. Of course, nobody knows what the future holds, but the performance over all timeframes has been relatively close (within 100 bps since inception).
Composition Differences: KLD 400 vs S&P 500

The KLD 400 and the S&P 500 are similar in many respects. The KLD 400 index

It is worth noting that the MSCI KLD 400 index is derived from the MSCI USA index. Our analysis of the MSCI USA Index vs S&P 500 found that the two are nearly identical. However, the KLD 400 contains some ESG screens that set it apart from both the MSCI USA and the S&P 500.

ESG Methodology

According to MSCI, the MSCI USA index is the parent index of the KLD 400. The first step in deriving the KLD index is to exclude any companies involved in Nuclear Power, Tobacco, Alcohol, Gambling, Military Weapons, Civilian Firearms, GMOs, or Adult Entertainment. Then constituents are added based on ESG considerations, as well as to keep sector and market cap exposures inline with the parent index. There is additional steps taken during the semi-annual reconstitution and rebalancing, all of which can be found on MSCI’s website.

Geography

Both the MSCI KLD 400 Index and the S&P 500 only include the stocks of US-domiciled companies.

Market Capitalization: KLD 400 vs S&P 500

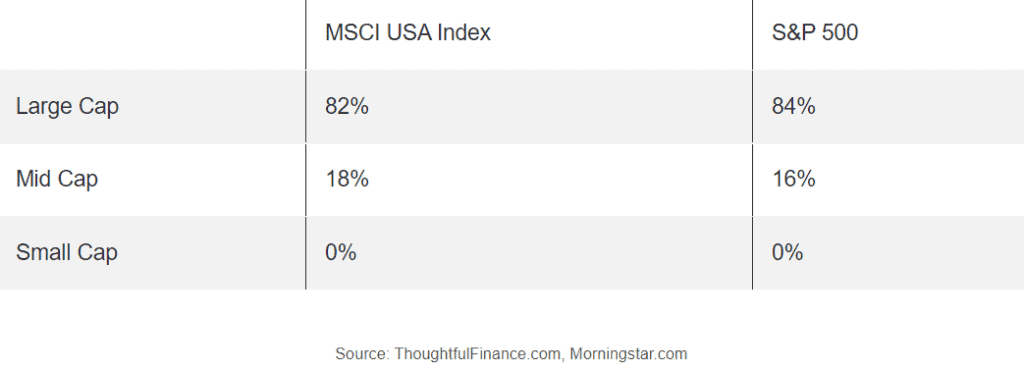
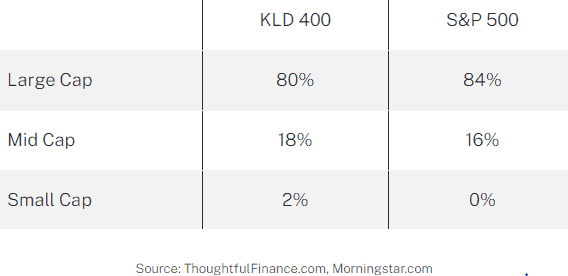
The market cap exposure of the KLD index and the S&P index are similar, although the KLD 400 tilts marginally more towards mid-cap and small-cap stocks.
Sector Comparison

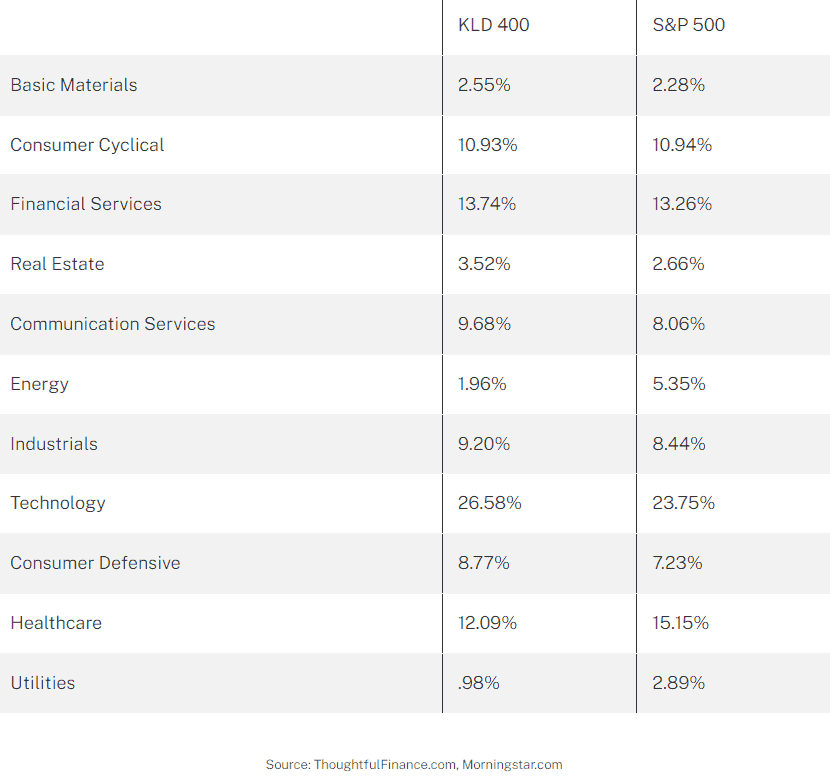
The sector exposure of the two indices is very similar with just a few key differences. Like many ESG-oriented indices, the KLD 400 is underweight energy, utilities, and healthcare.
Final Thoughts on KLD 400 vs S&P 500

Investors cannot invest in indices directly and should do their own research before deciding to invest in a fund that tracks either index. These indices are similar in many ways and performance differentials have depended on the time period being evaluated. Those considering benchmarking to the KLD 400 index (or any SRI/ESG for that matter) should first review the index methodology. The primary reason investors would use something like the KLD 400 index is to align their portfolio with their values, so they better ensure that they agree with the index methodology!

For instance, an investor may care deeply about the environment and social issues and be drawn to the KLD 400 index as a benchmark. However, if the investor is supportive of nuclear power as an alternative to fossil fuels, then the KLD index may not be the one for them.
MSCI USA Index vs S&P 500

The MSCI USA index and the S&P 500 are two of the most popular indices of US stocks. Many portfolios and investment vehicles are benchmarked to each index as both are representative of the US stock market.

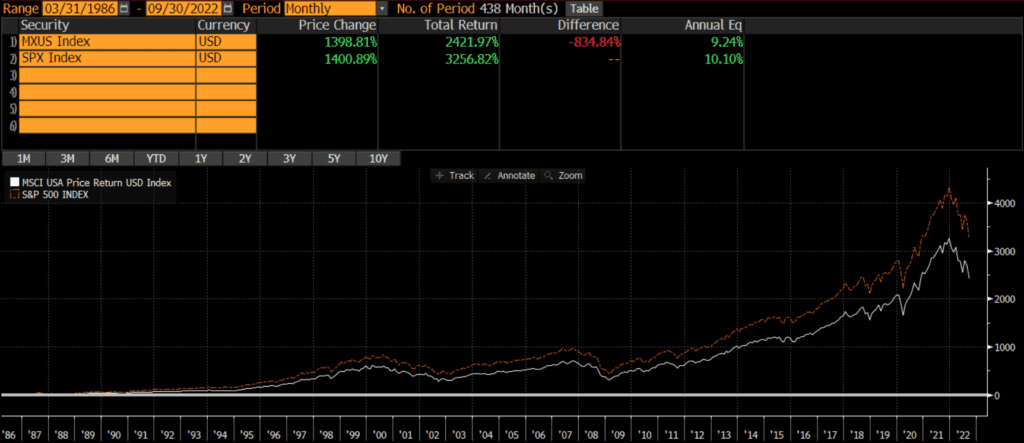
These two indices are nearly identical in every respect. The below charts of the MSCI USA vs S&P 500 performance illustrate that the S&P 500 has outperformed the MSCI USA by since its inception. However, returns over the past 25 years have been nearly identical. This is extremely similar to the findings in my analysis of the Russell 1000 vs S&P 500.

A quick note that investors cannot invest directly in an index. These unmanaged indexes do not reflect management fees and transaction costs that are associated with an investable vehicle, such as the Invesco PureBeta MSCI USA ETF (symbol: PBUS) or the iShares Core S&P 500 ETF (symbol: IVV). A reminder that these are simply examples as this site does NOT provide investment recommendations.

Historical Performance: MSCI USA Index vs S&P 500

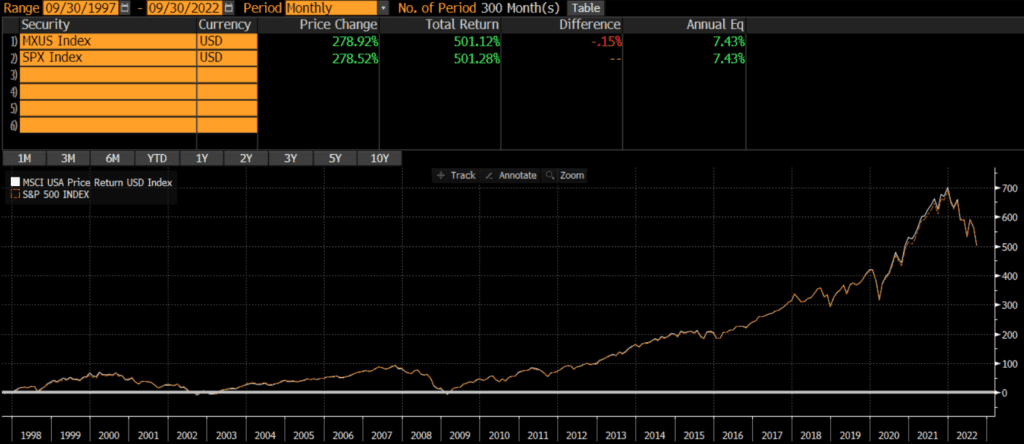
Similar to my analysis of the Russell 3000 vs S&P 500, the time period is very important when evaluating the performance of the MSCI USA Index vs S&P 500. The below chart of the MSCI USA Index vs S&P 500 shows that the S&P 500 outperformed the MSCI USA index by about 85 basis points annually (since inception on 3/31/1986).

However, it is a completely different story if we graph the MSCI USA Index vs S&P 500 over the past 25 years (as shown in the below chart). The two indices have performed identically (down to the basis point!) at 7.43% annually.

Composition Differences: MSCI USA vs S&P 500

Both the MSCI USA Index and the S&P 500 are broad-based indices that represent the US equity markets. As of Q3 2022, the indices have identical geographic exposures, similar sector weights, and slightly different market cap exposures.

Geography

Both the MSCI USA Index and the S&P 500 only include the stocks of US-domiciled companies.

Market Capitalization

The two indices have a similar number of constituent stocks; the MSCI USA has 626 constituents versus the S&P’s 500 companies. Consequently, the MSCI USA has marginally more mid-cap exposure, but it is not a material difference. Both indices are market-cap weighted, so the composition is largely similar.

Sectors

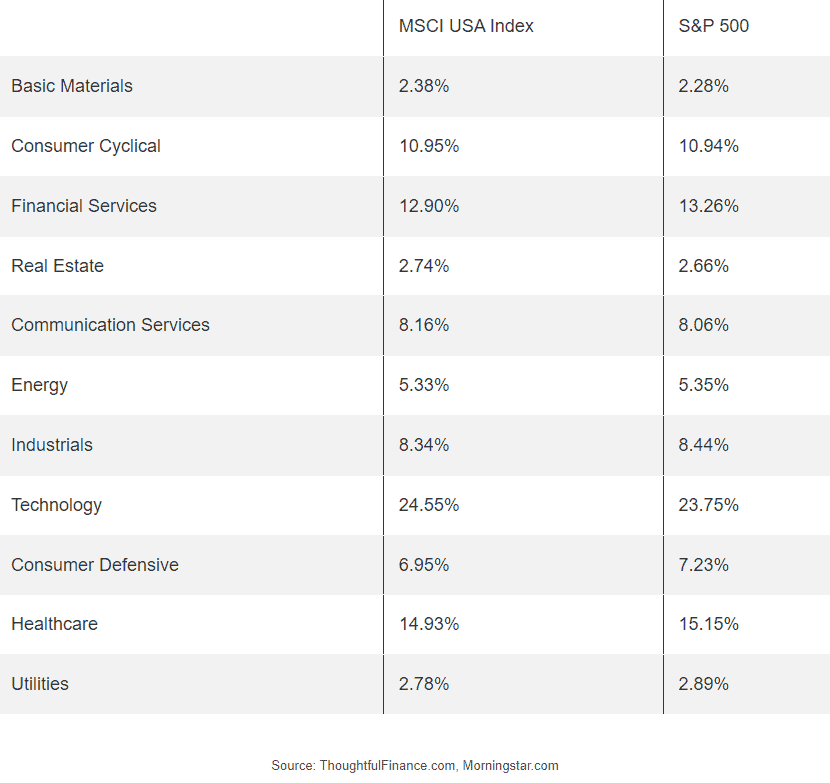
The sector exposure of the two indices is also nearly identical.

Final Thoughts on MSCI USA vs S&P 500

Investors cannot invest in indices directly and should do their own research before deciding to invest in a fund that tracks either index. That being said, these two indices appear largely identical in terms of geographic, market cap, and sector exposure. For all intents and purposes, I would argue that these two benchmarks are interchangeable.

With such a small performance difference though, the costs of investable index strategies may be a larger consideration than which benchmark to select. Sometimes benchmark selection matters quite a bit, although that does not appear to be the case between these two indices.

Are Markets Efficient?

Are markets efficient?

The question of whether markets are efficient has been debated for decades and there is no consensus. However, I think the debate and conclusion is best summed up by a famous story.

A finance professor and his student were walking across campus when they spotted a $20 bill on the ground. The professor advised, “Don’t bother picking that up. If it was real, someone would’ve picked it up already.” The student picks it up anyways and buys herself a beer.

There are not a lot of $20 bills laying on the ground, but they are found from time to time. That’s the short answer. The longer answer is below.

What does market efficiency mean?

The term efficiency is used to connote several different ideas, but the most common one is a concept formalized into the Efficient Markets Hypothesis (EMH) by Eugene Fama, who won a Nobel prize for his work on the subject. The theory basically says that markets allocate capital best and thus value assets best (or “efficiently”). There are 3 forms of the theory:

  • Weak Form: all historical information is priced into an asset’s price.
  • Semi-Strong Form: all historical and public information is incorporated into an asset’s price.
  • Strong Form: all historical, public, and non-public information is Incorporated into an asset’s price.

Below are some examples of situations where each form does not hold up.

Strong Form

Strong Form claim: all historical, public, and non-public information is Incorporated into an asset’s price.

Strong Form problems:

  • Prices often have material and sustained moves when private information is publicized.
  • Prices often move on earnings announcements or press releases.
  • The uncovering of scandals or fraud impacts prices.
  • I do not know anyone that subscribes to the strong form of the EMH.

Semi-Strong Form

Semi-Strong Form claim: all historical and public information is incorporated into an asset’s price.

Semi-Strong Form problems:

  • Arbitrage opportunities exist fairly frequently. Although not all are actionable due to constraints and costs, enough are.
  • Closed-end funds can trade at extreme premiums and discounts to their underlying NAV.
  • We have seen public companies trading for less than the value of their stakes in other public companies.

Weak Form

Weak Form claim: all historical information is priced into an asset’s price.

Weak Form problems:

  • Momentum as a risk factor has been shown to offer a return premium.
  • Flash crashes and flash rallies have extreme mean reverting tendencies.

There are many more examples of market inefficiency, but few would have been robust enough to categorically prove markets are inefficient (and stand up to every possible logical critique).

So, are markets efficient?

Beyond poking holes in the idea of market efficiency, the above examples represent opportunities for active managers to outperform. Yet, there is plenty of data that indicates markets are difficult to beat on a consistent basis. This implies (but does not prove) that markets are at least somewhat “efficient.” If markets were generally inefficient, it would seem that investors would beat the markets more easily, frequently, and consistently.

So what can we conclude? That markets are not always efficient, but are probably efficient at least some of the time. This is a very unsatisfying answer, but that is okay because it is unclear whether market efficiency even matters to investors. I’ll explain why in an upcoming post.

Additional thoughts on market efficiency

Even if markets are generally efficient, efficiency seems non-existent during certain times (ie. when rationality gets thrown out the window during bubbles and panics) and in specific asset classes (where there are constraints to arbitrage, complexity, due diligence costs, transaction costs, or anything else that makes it difficult to invest easily). So my usual answer to the original question is that markets are generally efficient, but there are episodes and pockets of inefficiency.

Peter Thiel on Competition

It is wise to remember Thiel’s quote about avoiding competition. Just as businesses do best in the absence of competitors, investors perform best when they do not have to compete for opportunities.

“Competition means no profits for anybody, no meaningful differentiation, and a struggle for survival. So why do people believe that competition is healthy? The answer is that competition is not just an economic concept or a simple inconvenience that individuals and companies must deal with in the marketplace. More than anything else, competition is an ideology—the ideology—that pervades our society and distorts our thinking. We preach competition, internalize its necessity, and enact its commandments; and as a result, we trap ourselves within it—even though the more we compete, the less we gain… If you can recognize competition as a destructive force instead of a sign of value, you’re already more sane than most.

Peter Thiel, Zero to One

Russell 3000 vs S&P 500

The S&P 500 and the Russell 3000 are two of the most popular indices of US stocks. Many portfolios and investment vehicles are benchmarked to each index as both are representative of the US stock market.

The primary difference between the two indices is that the S&P 500 is a large-cap index, while the Russell 3000 is a total market index that includes mid-cap and small-cap stocks. The below charts of the Russell 3000 vs S&P 500 performance illustrate that the S&P 500 has outperformed the Russell 1000 by a wide margin since its inception. However, returns over the past 25 years have been nearly identical. This is extremely similar to the findings in my analysis of the Russell 1000 vs S&P 500.

A quick note that investors cannot invest directly in an index. These unmanaged indexes do not reflect management fees and transaction costs that are associated with an investable vehicle, such as the State Street SPDR S&P 500 ETF (symbol: SPY) or the iShares Russell 3000 ETF (symbol: IWV). A reminder that these are simply examples as this site does NOT provide investment recommendations.

Historical Performance: Russell 3000 vs S&P 500

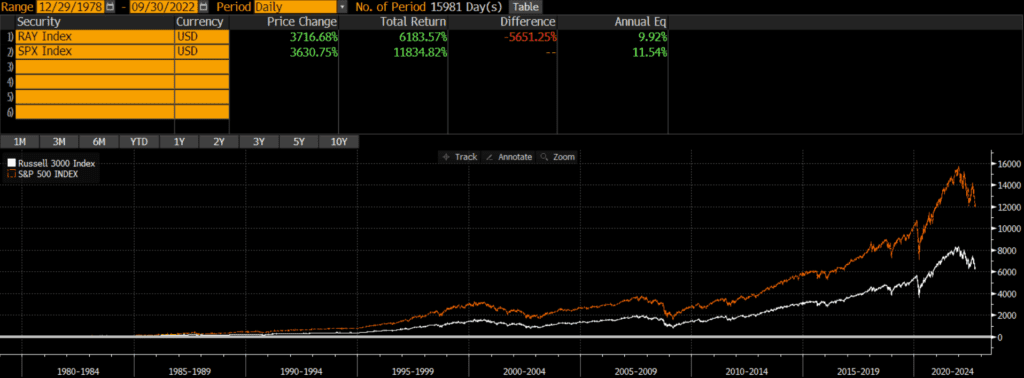
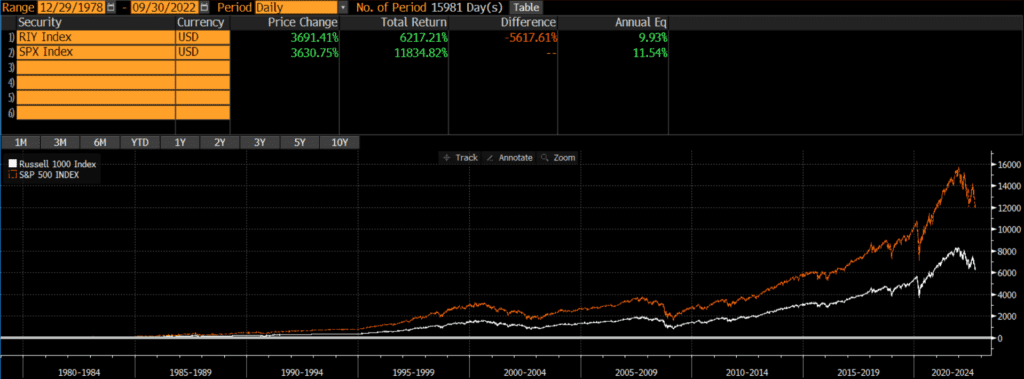
Similar to our analysis of the Russell 1000 vs S&P 500, the time period is very important when evaluating the performance of the Russell 3000 vs the S&P 500. The below chart of the Russell 3000 vs S&P 500 shows that the S&P 500 outperformed by a wide margin (since the Russell index’s inception in 1978). In fact, the difference is about 1.6% annually.

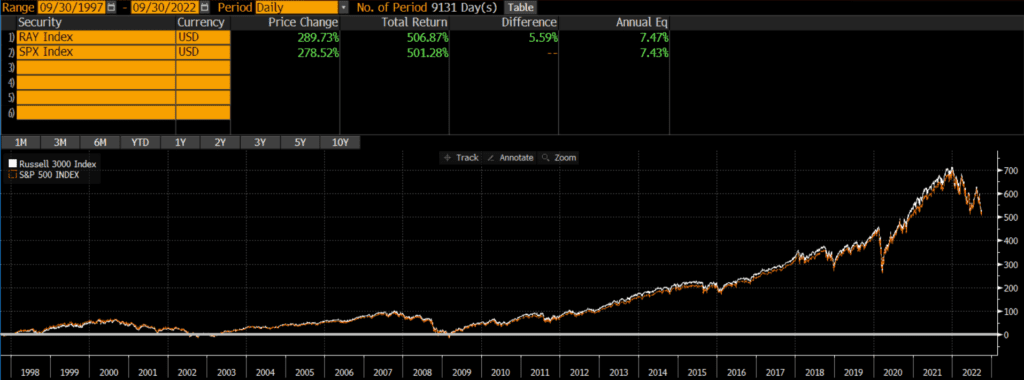
However, it is a completely different story if we graph the Russell 3000 and S&P 500 over the past 25 years. The two indices perform nearly identically with only a .04% difference annually!

Composition Differences: Russell 3000 vs S&P 500

Both the Russell 3000 and the S&P 500 are broad-based indices that represent the US equity markets. As of Q3 2022, the indices have identical geographic exposures, similar sector weights, and slightly different market cap exposures.

Geography

Both the Russell 3000 and S&P 500 only include the stocks of US-domiciled companies.

Market Capitalization

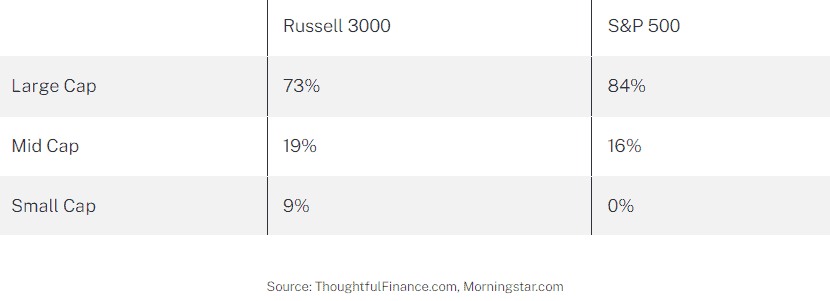
The biggest difference between the two indices is the market capitalization of constituents. The S&P 500 includes large-cap and mid-cap stocks, while the Russell 3000 is more of a total market index and includes large-, mid-, and small- cap stocks. However, both indices are market-cap weighted, so the composition is largely similar.

Sectors

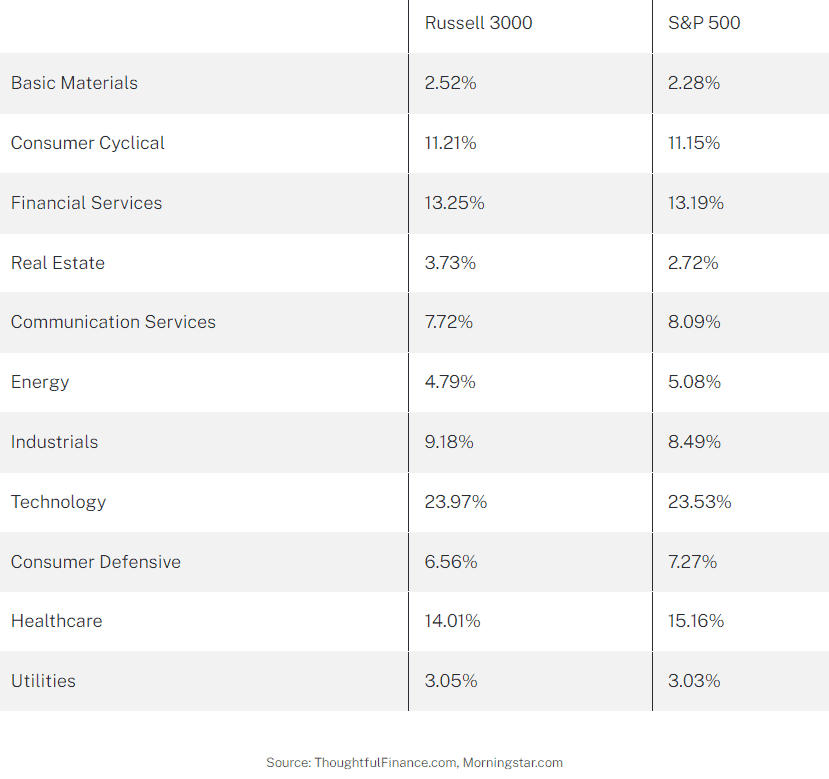
The sector exposure of the two indices is roughly similar, which is not surprising given that they are both broad-based indices.

Final Thoughts on Russell 3000 vs S&P 500

Investors cannot invest in indices directly and should do their own research before deciding to invest in a fund that tracks either index. When deciding between the Russell 3000 and S&P 500, investors should determine if they primarily want large-cap exposure or more of a total market exposure.

With such a small performance difference though, the costs of investable index strategies may be a larger consideration than which benchmark to select. Sometimes benchmark selection matters quite a bit, although that does not appear to be the case between these two indices. Perhaps the biggest consideration beyond the usual costs, taxes, etc, is the liquidity of a small-cap exposure in the Russell 3000. There is a theoretical diversification benefit of holding more assets, but the question is at what cost?

Further Reading

As mentioned in the intro, the above analysis of the Russell 3000 vs S&P 500 is extremely similar to my analysis of the Russell 1000 vs S&P 500. For more information about these two Russell indices are so similar (and arguably interchangeable for most investors), read my analysis of the Russell 1000 vs Russell 2000 vs Russell 3000.

Russell 1000 vs Russell 2000 vs Russell 3000

The Russell 1000, 2000, and 3000 are three of the most popular indices of US stocks. Many portfolios and investment vehicles are benchmarked to each index. The Russell 1000 is composed of mostly large-cap stocks, while the Russell 2000 is composed of mostly small-cap stocks. The Russell 3000 is more of a total market index, which includes large caps, mid caps, and small caps.

A quick note investors cannot invest directly in an index. These unmanaged indexes do not reflect management fees and transaction costs that are associated with an investable vehicle. Examples include the iShares Russell 1000 ETF (symbol: IWB), the iShares Russell 2000 ETF (symbol: IWM), or the iShares Russell 3000 ETF (symbol: IWV). A reminder that these are simply examples as this site does NOT provide investment recommendations.

Difference Between Russell 1000, Russell 2000, and Russell 3000

Fortunately, FTSE Russell (the provider of the Russell indices) makes it fairly simply to understand the differences between the Russell 3000, 2000, and 1000.

Russell 3000

The Russell 3000 represents the 3,000 US stocks with the largest market caps. So it is a very broad index that covers most stocks in the US, although some microcap stocks do not make the cut. Interestingly, index inclusion is based purely on market capitalization and a webpage for the index notes: “Investors seeking to capture a strategy reflecting broad US equities performance can confidently choose the Russell 3000 knowing there are no subjective inclusions or exclusions of stocks.” This seems to be a not-so-veiled criticism of Standard & Poors, the index provider for the S&P 500 and other major indices that takes a more subjective committee-based approach. That being said, my analysis of the Russell 1000 vs S&P 500 performance did not find any differences over the past 30 years.

Russell 1000 and Russell 2000

Russell segments the Russell 3000 into two additional indices. The 1,000 stocks with the largest market caps constitute the Russell 1000, while the 2,000 stocks with the smallest market caps are the Russell 2000. The full methodology can be found on FTSE Russell’s website here.

Historical Performance: Russell 1000 vs Russell 2000 vs Russell 3000

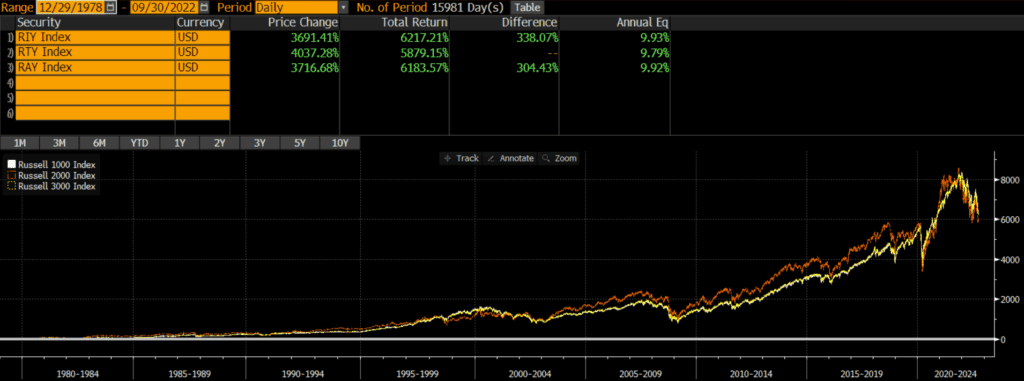
Surprisingly, the performance of all three indices is within .15% annually over the past 44 years! Looking at the Russell 1000 vs Russell 2000 vs Russell 3000 chart below, it is clear that the Russell 1000 and Russell 3000 have moved in lockstep. The Russell 2000’s performance has more volatile, both in absolute terms as well as relative to the Russell 1000 and Russell 3000 graphs. However, the Russell 2000 has more or less arrived at the same annualized performance (as of 2022).

Current Index Composition

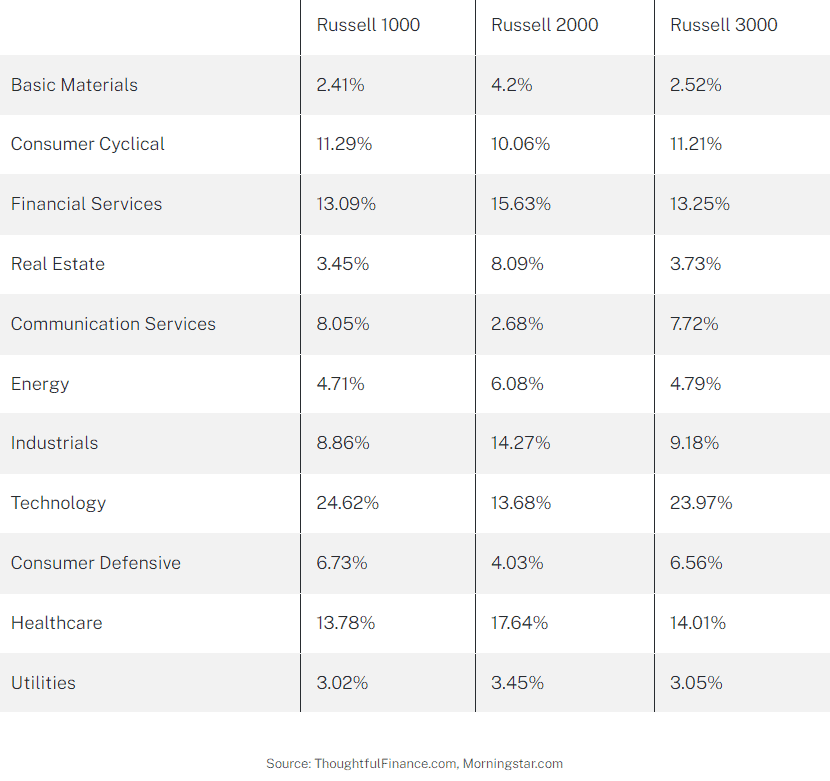
The near-identical performance over the past two decades is not surprising when looking at the current index compositions. As of 9/30/2022, the geographic, market cap, and sector weights are nearly identical.

Geographic Exposure

The Russell 3000 (and its component Russell 1000 and Russell 2000 indices) only includes stocks of US-based companies.

Market Cap Exposure

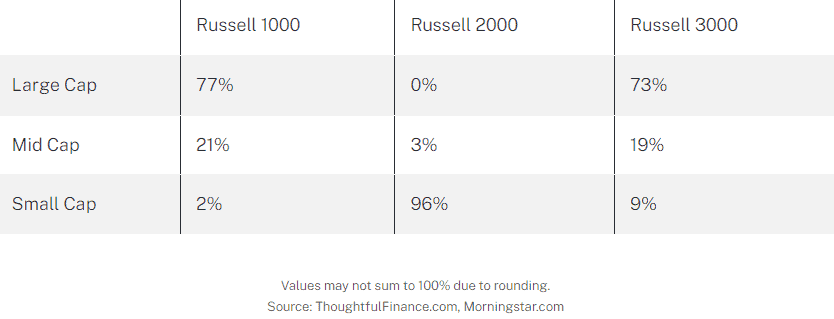
As mentioned above, the Russell 1000 represents the larger stocks of the Russell 3000 and the Russell 2000 represents the smaller stocks of the Russell 3000. However, since these are cap-weighted indices, the Russell 3000 ends up being closer to a large-cap index even though it contains small caps. This explains the near-identical performance of the Russell 1000 and Russell 3000.

Sector Weights

Looking at the sector weightings of the respective indices, we see a similar theme. The Russell 1000 and Russell 3000 have similar sector weights, while the Russell 2000 has some notable differences.

Final Thoughts

In my view, the Russell 1000 and Russell 3000 are equivalent and interchangeable. Yes, the Russell 3000 is more diversified in that it has more stocks, but the performance has been identical for 44 years. If it walks like a duck and talks like a duck… The Russell 2000 is obviously different which is plain to see for anyone looking at a chart of the Russell 1000 vs Russell 2000 vs Russell 3000.

The question I see many allocators face is whether to simply own the total market (something benchmarked to the Russell 3000) versus splitting equity allocations into large-cap and small-cap components. My thought is that if an investor is going to hold large-caps and small-caps at their market cap weights, then go for a total market benchmark. However, if an investor wants to overweight or underweight large-caps or small-caps, then they should divide the equity allocation.

Investors cannot invest in indices directly and should do their own research before deciding to invest in a strategy that tracks any of these indices. Investors should focus their research on details like expenses, overall costs, tracking error, and so on. These factors are especially important when evaluating something benchmarked to the Russell 2000 or Russell 3000 since small-caps stocks can be notoriously illiquid.

Further Reading

The Russell indices take a similar approach as the NASDAQ indices, where the NASDAQ 100 is a subset of the NASDAQ Composite.

Investors looking for US large-cap exposure may also want to explore the MSCI USA Index or the S&P 500 Index.

Russell 1000 vs S&P 500

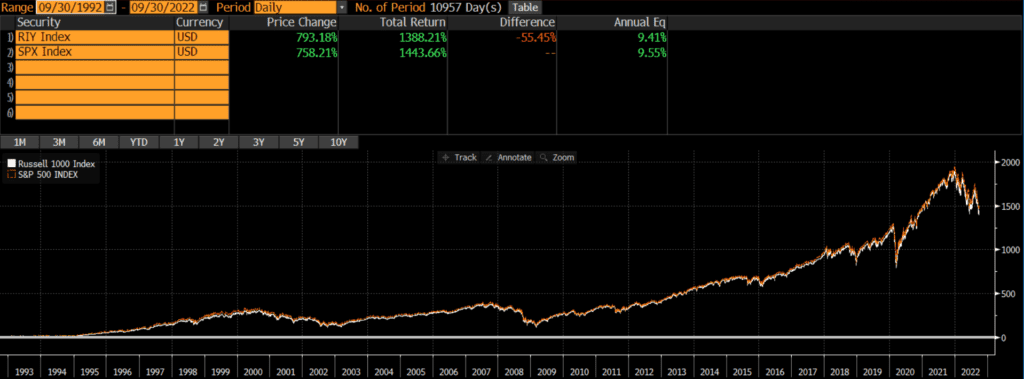
The Russell 1000 and the S&P 500 are two of the most widely-followed indices of US large-cap stocks. The below charts of the Russell 1000 vs the S&P 500 illustrate that the S&P 500 has outperformed the Russell 1000 by a wide margin since its inception. However, returns over the past 30 years have been identical.

A quick note investors cannot invest directly in an index. These unmanaged indexes do not reflect management fees and transaction costs that are associated with an investable vehicle, such as the iShares Russell 1000 ETF (symbol: IWB) or the State Street SPDR S&P 500 Index Trust (symbol: SPY). A reminder that these are simply examples as this site does NOT provide investment recommendations.

Performance: Russell 1000 vs S&P 500 Historical Returns

When comparing the historical returns of the Russell 1000 and the S&P 500, it is important to note the timeframe. The performance of Russell 1000 vs S&P 500 graphs (below) look completely different during different timeframes. Since the Russell 1000’s inception in 1978, the S&P 500 has outperformed it by about 1.6% annually (through 9/30/2022).

However, charts (and marketing materials) can be deceiving. If we look at the past 30 years, the S&P 500 outperformed the Russell 1000 and the performance difference has been less than .15% annually.

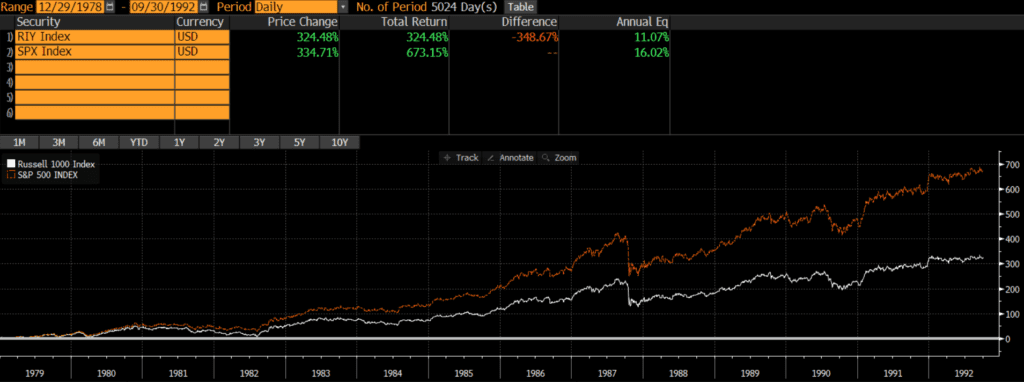
This implies that more than 100% of the S&P 500’s outperformance was generated between 1978 and 1993. Sure enough, the Russell 1000 vs S&P 500 chart (below) indicates that from inception to 9/30/1992, the S&P 500 outperformed the Russell 1000 by nearly 5% per year!

Current Index Composition

The near-identical performance over the past two decades is not surprising when looking at the current index compositions. As of 9/30/2022, the geographic, market cap, and sector weights are nearly identical.

Geographic Exposure

Both the Russell 1000 and the S&P 500 only include stocks of US-based companies.

Market Cap Exposure

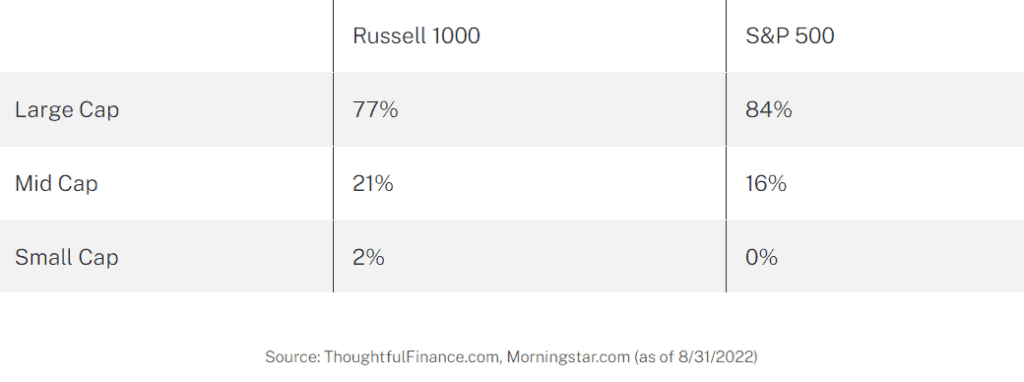
Both indices are primarily composed of large-cap stocks. However, since the Russell has twice as many stocks, it has slightly more mid cap constituents.

Sector Weights

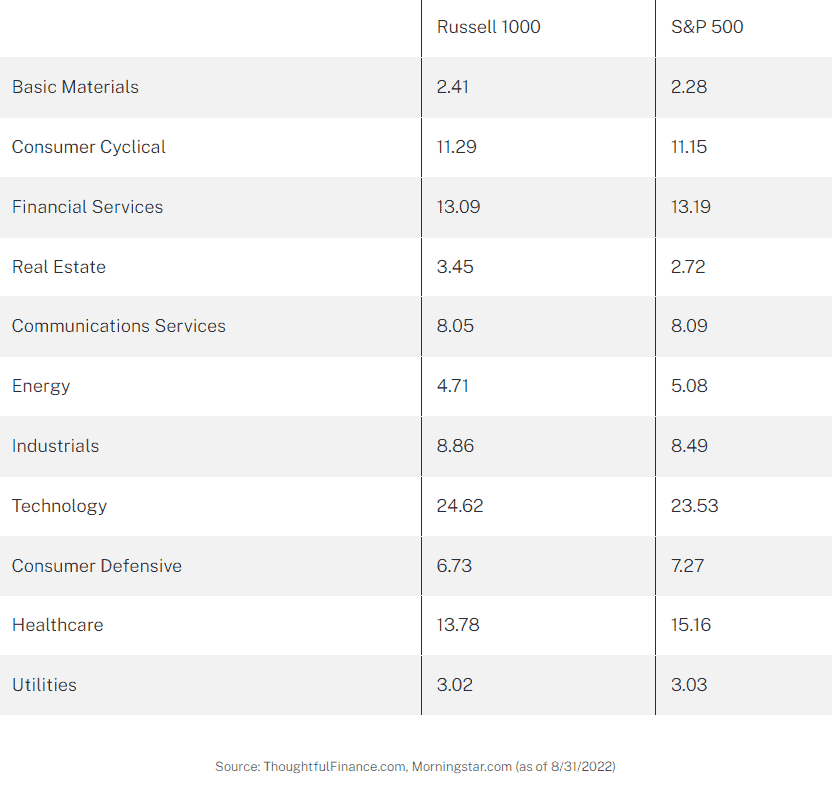
The Russell 1000 and S&P 500 have nearly identical sector weightings.

Final Thoughts

In my view, these two indices are interchangeable. Yes, the S&P 500 trounced the Russell 1000 in the early years, but we’ve observed 30 years of near-identical performance.

Investors cannot invest in indices directly and should do their own research before deciding to invest in a strategy that tracks either index. Given the negligible performance difference in the indices, investors should focus their research on details like expenses, overall costs, tracking error, and so on.

Russell 1000 & S&P 500 Index Funds

As mentioned, these are two of the most widely followed indices. In fact, the three largest ETFs are S&P 500 index funds (as of 9/30/2022):

  • State Street SPDR S&P 500 ETF Trust (symbol: SPY)
  • iShares Core S&P 500 ETF (symbol: IVV)
  • Vanguard S&P 500 ETF (symbol: VOO)

Two of the largest Russell 1000 index funds include:

  • iShares Russell 1000 ETF (symbol: IWB)
  • Vanguard Russell 1000 ETF (symbol: VONE)

Donor-Advised Funds: What DAFs are & How DAFs Work

An important tax planning and charitable giving tool is the Donor-Advised Fund (DAF). There are hundreds of DAFs offered by non-profits, community and corporate foundations, and so on. The below is a primer of what donor-advised funds are and how donor-advised funds work.

What Are Donor Advised Funds?

DAFs are sponsored by 501(c)(3) non-profit organizations, donations:

  • are irrevocable
  • may be tax-deductible

However, DAFs are “donor-advised,” which means that donors may continue to direct:

  • investment decisions
  • grant recommendations
Source: ThoughtfulFinance.com

How Do Donor Advised Funds Work?

DAFs offer several important planning advantages.

Tax Benefits of DAFs

Donors receive an income tax deduction when assets are donated into the DAF, but may continue to “advise” the DAF on investments and grants. Effectively, this means that donors can still direct how the assets are invested and granted.

Timing Benefits of DAFs

The assets can remain in the DAF indefinitely before being granted out to the final 501(c)(3) non-profit. Thus, a donor can donate assets this year, but does not need to decide on the final non-profit recipient this year. The donor can decide where to direct the grant next year or in 10 years or beyond.

Other Benefits of DAFs

  • Many DAFs can accept complex assets (such as real estate or business interests) that smaller non-profits are unable to handle.
  • If anonymity is desired, grants can simply be reported under the DAF and not from the original donor.
  • Once donated, assets can be sold without incurring capital gains tax and/or any future growth is tax-free.

Flexibility of DAFs

Investment considerations and tax planning often determine how and when to maximize the tax value of donations. However, these factors may not align with the charities that one supports. For instance, what if a charity is unable to accept stock options? Or perhaps a charity could use more recurring monthly donations rather than yet-another-lump-sum donation in December? A DAF is a great vehicle that can solve for these and other challenges.

Donor-Advised Fund FAQs

Below are some common concerns that a DAF can help address.

I want to donate before the end of this year, but don’t know where to give (yet).

You can take a charitable contribution tax deduction in the year that you contribute assets into the DAF. Thus, you can contribute into a donor-advised fund (and take the tax deduction) this year, but donate from it in future years. The benefit is that you can give without rushing to decide exactly where it will all be going. The assets within the donor-advised fund can be invested in the meanwhile.

I want to sell an asset that has appreciated a lot, but do not want to get hit with capital gains tax.

If you plan on making charitable contributions, consider donating appreciated assets. When you donate a publicly-traded investment (like a stock, bond, or fund), you can deduct the market value of the donation on your tax return. Additionally, since you never sell it, you never realize any capital gains or associated tax liability. That is the main benefit of donating appreciated assets.

I’d like to donate appreciated assets, but I’m not sure if the organizations that I support accept donations of securities. 

Most donor-advised funds can accept non-cash contributions and many can even accept complex assets like real estate, business interests, and so on. If the organizations that you support do not accept securities or if its an onerous process to transfer them in, you can donate appreciated assets into the DAF, sell them inside the DAF, and then donate out to the organization in cash.

What DAF should I use?

This site does not provide recommendations, but here are some well-known DAFs:

  • Custodian -sponsored DAFs:
    • Vanguard Charitable
    • Schwab Charitable
    • Fidelity Charitable
  • Open architecture DAFs (which generally work with any custodians and allow for personalized investment management):
    • Renaissance Charitable Foundation
    • American Endowment Foundation
  • Niche DAFs:
    • Impact Assets (impact Investing)
    • Silicon Valley Community Foundation (geography-based)
    • National Christian Foundation (faith-based)

If you are thinking about making charitable contributions now or in the future, a donor-advised fund could be a valuable tool for you.

Additionality

Solar panels can drive additionality in a similar way to carbon offsets.

Additionality has been on my mind lately. Although the term is most commonly applied in the context of carbon emissions and offsets, I believe the concept is helpful in many domains.

Let’s start with the definition of additionality. Additionality occurs when a particular action will provide a benefit in “addition” to a “baseline” alternative of taking no action.

For example, let’s say that I invest in a solar energy project. I’ll pat myself on the back because I’m generating a financial return AND a positive environmental impact. However, if there were other investors competing to allocate to the project, then:

  • The project would’ve been built anyways, regardless of whether I invested.
  • If I didn’t invest in the project, another investor would have.
  • Taking action (investing in the solar project) would not have generated any more environmental impact than the baseline of not taking action (not investing in the solar project).
  • In this example, there would have been no additionality from my investment. However, the investment may still be aligned with my values (even if it did not result in additionality).

The above is a textbook example, but we find similar situations in both investing and philanthropy.

  • Within impact investing, the above example is a common situation that occurs when an impact strategy is capacity constrained or a fund is oversubscribed.
  • For portfolios of public companies/stocks, I believe the concept of additionality implies that ESG integration is more about alignment of values than effecting change. In aggregate, ESG investors may lower a responsible company’s cost of capital or vote proxies in a unique way, but even the largest investors are typically very small minority shareholders in most public companies. Thus, within public equities, the additionality of individual investor decisions is either theoretical or infinitesimally small.
  • Investors invest to generate financial returns (and some may consider additionality). Philanthropists donate to generate additionality. This creates a powerful incentive for non-profit organizations to promote the appearance of additionality even if it does not exist. Some organizations generate tons of additionality and some probably generate negative additionality, so caveat dator (Latin for “let the donor beware”).

Although this post is thematic and the examples are more illustrative than practical, I hope to write more detailed posts about how investors and donors can actually evaluate the balance of need, capital, and capacity in order to get a better sense of additionality.

The Story of the Mexican Fisherman

The story of the Mexican Fisherman is at least fifty years old, but it is a timeless tale that is both revealing and enlightening. Below is one version of the story of the Mexican fisherman:

An American investment banker was taking a much-needed vacation in a small coastal Mexican village when a small boat with just one fisherman docked. The boat had several large, fresh fish in it.

The investment banker was impressed by the quality of the fish and asked the Mexican how long it took to catch them. The Mexican replied, “Only a little while.” The banker then asked why he didn’t stay out longer and catch more fish?

The Mexican fisherman replied he had enough to support his family’s immediate needs.

The American then asked “But what do you do with the rest of your time?”

The Mexican fisherman replied, “I sleep late, fish a little, play with my children, take siesta with my wife, stroll into the village each evening where I sip wine and play guitar with my amigos: I have a full and busy life, señor.”

The investment banker scoffed, “I am an Ivy League MBA, and I could help you. You could spend more time fishing and with the proceeds buy a bigger boat, and with the proceeds from the bigger boat you could buy several boats until eventually you would have a whole fleet of fishing boats. Instead of selling your catch to the middleman you could sell directly to the processor, eventually opening your own cannery. You could control the product, processing and distribution.”

Then he added, “Of course, you would need to leave this small coastal fishing village and move to Mexico City where you would run your growing enterprise.”

The Mexican fisherman asked, “But señor, how long will this all take?”

To which the American replied, “15–20 years.”

“But what then?” asked the Mexican.

The American laughed and said, “That’s the best part. When the time is right you would announce an IPO and sell your company stock to the public and become very rich. You could make millions.”

“Millions, señor? Then what?”

To which the investment banker replied, “Then you would retire. You could move to a small coastal fishing village where you would sleep late, fish a little, play with your kids, take siesta with your wife, stroll to the village in the evenings where you could sip wine and play your guitar with your amigos.”

(This story of the Mexican fisherman was originally written by Heinrich Böll, although Tim Ferriss published the above adapted version which can be found across the internet.)

Scroll to Top