SCHD vs VYM: Which Dividend ETF is Better?

The Vanguard High Dividend Yield ETF (VYM) and the Schwab US Dividend Equity ETF (SCHD) are two of the largest dividend-oriented ETFs in the market. Even though both target stocks that pay higher-than-average dividends, the two funds use different criteria. Many investors compare SCHD vs VYM in order to determine which would the best fit for their portfolio.

A quick reminder that this site does NOT provide investment recommendations. Fund comparisons (such as this one) are not conducted to identify the “best” fund (since that will vary from investor to investor based on investor-specific factors). Rather, these fund comparison posts are designed to identify and distinguish between the fund details that matter versus the ones that don’t.

The Short Answer

SCHD and VYM use slightly different methodologies that has resulted in slight performance differences (especially since 2020). VYM is tilted more towards the value factor. Historical performance of SCHD vs VYM has been similar most years, but may depend on how the value and growth factors perform moving forward.

The Longer Answer

Historical Performance: SCHD vs VYM

Since the common inception date in 2011, performance has been relatively similar with an annualized difference of roughly 1.5%. This has compounded over time though and the cumulative performance differential is about 62%!

As the SCHD vs VYM chart of historical performance illustrates, the two funds performed similarly for a long time. However, SCHD has outperformed by a wide margin over the past several years.

Differences Between SCHD and VYM

The primary difference between these two funds is the methodology that they use to select which stocks are included.

SCHD first filters out any stocks that have not paid dividends for at least 10 years. The remaining stocks are then filtered based on fundamental criteria and then position and sector caps are instituted to keep the portfolio diversified.

VYM does share much about its methodology in its prospectus other than saying it will invest in stocks that pay higher than average dividends. Looking at the portfolio, this result in more of a value tilt and greater exposure to high-dividend low-growth sectors like utilities.

Geographic Exposure

Both SCHD and VYM hold essentially 100% US stocks, so I will not dig into country exposures or market classification here. For all intents and purposes, the two funds have identical country exposures.

Market Cap Exposure

Overall, the market cap exposures of SCHD and VYM are relatively similar.

SCHDVYM
Large Cap79%76%
Mid Cap18%18%
Small Cap3%5%
Source: ThoughtfulFinance.com, Morningstar (as of 8/3/2023)

Sector Weights

Sector weights are relatively similar with just a notable difference in utilities.

SCHDVYM
Basic Materials1.96%2.34%
Consumer Cyclical9.68%7.02%
Financial Services15.52%19.45%
Real Estate0.00%0.01%
Communication Services4.30%3.69%
Energy9.41%10.22%
Industrials18.34%12.16%
Technology12.23%9.62%
Consumer Defensive12.92%14.65%
Health Care15.34%13.63%
Utilities0.30%7.21%
Source: ThoughtfulFinance.com, Morningstar (as of 5/30/2023)

Expenses

Both SCHD and VYM only charge 6 basis points (or a .06% expense ratio).

Transaction Costs

ETFs are free to trade at many brokers and custodians, so both SCHD and VYM should be free to trade in most cases. Additionally, these funds are among the largest ETFs and are very liquid. The bid-ask spread of both SCHD and VYM is very low, so individual investor trades will not generally be large enough to “move” the market.

Tax Efficiency & Capital Gain Distributions

ETFs are typically more tax-efficient than mutual funds, due to their ability to avoid realizing capital gains through like-kind redemptions (a process that is beyond the scope of this post). Neither SCHD nor VYM has ever made a capital gains distribution (nor do I expect them to moving forward). Thus, these funds are about as tax-efficient as any fund can be and either fund is appropriate in taxable accounts, although the dividends do create a very slight tax drag.

Final Thoughts: SCHD vs VYM

Both funds are great ETFs that do what they are designed to do. I would not personally use dividend ETFs as the core of a portfolio, but that is a personal opinion and not necessarily the consensus. However, investors looking for a dividend-oriented fund could do a lot worse than using SCHD or VYM.

Frequently Asked Questions (FAQs)

QYLD ETF Review: Is QYLD a Good Investment?

The Global X Nasdaq 100 Covered Call ETF (symbol: QYLD) is one of the largest covered call exchange-traded funds (ETFs) in the market and is quite popular with retail investors. QYLD employs a covered call strategy, which attempts to generate income by selling the upside potential of its portfolio. While covered calls may make sense in certain situations, my observation is that individual investors do not typically fully understand the dynamics of the strategy or the trade-offs in terms of risk and return. Interestingly, QYLD overlays its strategy on the Nasdaq 100 index, rather than the S&P 500 (like its sibling XYLD). Hopefully, the below can help investors evaluate whether QYLD is a good investment for their portfolio.

A quick reminder that this site does NOT provide investment recommendations. Fund reviews (such as this one) are for educational purposes only and are not advice or recommendations.

The Short Answer

QYLD may be a good tool in rare specific situations, but QYLD is not a good investment for many other situations. Covered call strategies (including QYLD) carry a specific and well-known set of tradeoffs that many investors do not necessarily fully understand or consider the implications. I would not recommend QYLD to most investors.

QYLD Performance

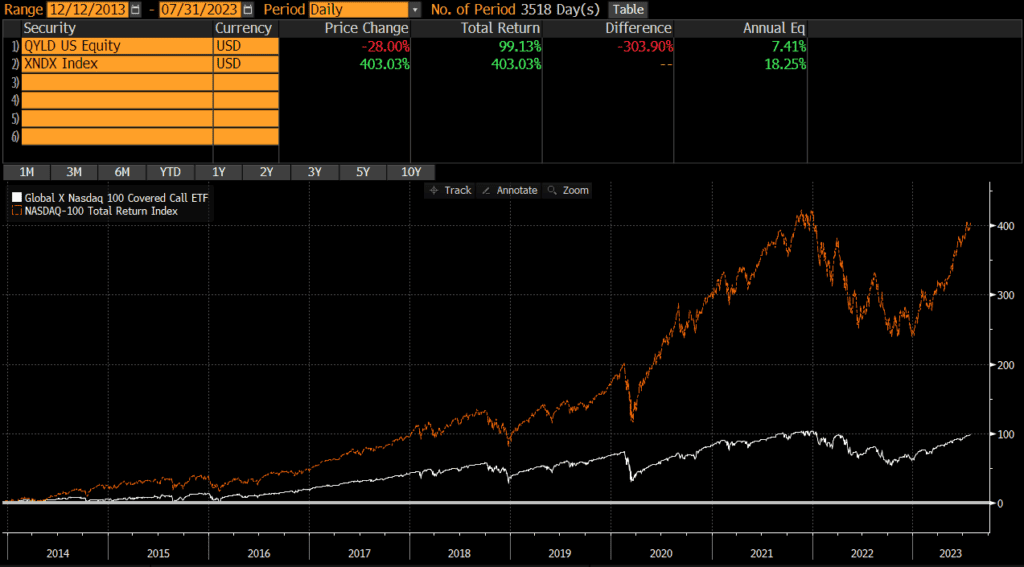
The first thing most investors want to know about is performance, so we will start there. According to Bloomberg, since the fund’s inception in late 2013, QYLD has returned 7.41% annualized which is below the Nasdaq 100 Index’s performance of 18.25% over the same time period. It is important to note that the Nasdaq 100 is different than the Nasdaq Composite Index.

Source: ThoughtfulFinance.com, Bloomberg

As the QYLD chart of historical performance below shows, QYLD has underperformed the Nasdaq 100 by a large amount (and even more so on an after-tax basis). This is not surprising and exactly what I would expect from a covered call fund as the strategy is to sell upside potential in exchange for cash which helps offset downside losses. So I would expect QYLD to underperform when equity markets are doing well, outperform when equities are volatile, and generally underperform over longer time horizons (especially on an after-tax basis).

Of course, covered call strategies tend to outperform during volatile periods, so 2022 was a bright spot for QYLD despite underperforming for a decade. That being said, it began underperforming again in the first half of 2023 and the total return between the two is essentially identical.

In terms of risk and drawdowns, QYLD’s downside has been slightly more limited (as has its upside though). The peak-to-trough decline of QYLD in 2022 was roughly -24% versus approximately 34% for the Nasdaq 100 during the same period.

QYLD Risks

QYLD owns stocks which are more volatile than cash or bonds. While the returns are higher than cash or bonds, investors need to be prepared to stomach volatility and be able to hold for the longer-term. QYLD was down over 24% at one point in 2022. This is not necessarily worse than other similar funds (over the same time period), but it is a characteristic of stocks that investors need to be aware of.

QYLD Portfolio

Fund performance is ultimately driven by a fund’s holdings and exposures, so our QYLD review will examine these items.

QYLD Holdings

QYLD (and its underlying index) is relatively well diversified in terms of number of holdings.

QYLDNASDAQ 100
Number of Stocks103100
Sources: ThoughtfulFinance.com, Morningstar (as of 7/27/2023)

QYLD Country Exposures

QYLD primarily owns US-based companies. Investors looking for international exposure may pair QYLD with international ETFs or simply hold a global ETF.

QYLD Market Cap Exposure

QYLD is primarily a large-cap fund which seeks to represent the largest US stocks listed on the Nasdaq. Even though the fund holds some mid-caps, performance is primarily driven by the large-cap exposure.

QYLD
Large-Cap91%
Mid-Cap10%
Small-Cap0%
Source: ThoughtfulFinance.com, Morningstar; data as of 7/27/2023

QYLD Sector Exposures

Similar to the underlying Nasdaq 100 index, QYLD is quite concentrated in terms of sectors.

QYLD
Basic Materials0.00%
Consumer Cyclical13.77%
Financial Services0.59%
Real Estate0.27%
Communication Services15.36%
Energy0.52%
Industrials4.88%
Technology49.64%
Consumer Defensive6.57%
Healthcare7.16%
Utilities1.23%
Source: ThoughtfulFinance.com, Morningstar; data as of 7/27/2023

Expenses

No review of QYLD would be complete without an in-depth look at the explicit and implicit costs of trading and holding QYLD.

QYLD Expense Ratio

QYLD’s expense ratio of .60% is quite a bit higher than most domestic index ETFs, but this is to be expected for a more active strategy.

QYLD Transaction Costs

ETFs are free to trade at many brokers and custodians, so QYLD should be free to trade in most cases. Additionally, it is among the largest ETFs and is very liquid. The bid-ask spread of QYLD is about .06%, so individual investor trades will not generally be large enough to impact or move the market.

QYLD Tax Efficiency

QYLD is not very tax-efficient as the premiums received from selling calls are taxed at ordinary income rates. While some investors may not mind receiving income in lieu of potential upside, this is akin to converting capital gains (from appreciation) into ordinary income. Of course, a covered call strategy will lose less money if the market declines, but covered call strategies (including QYLD) have a large tax drag.

ETFs are typically more tax-efficient than mutual funds, due to their ability to avoid realizing capital gains through like-kind redemptions (a process that is beyond the scope of this post). However, QYLD has made capital gains distributions and I would not necessarily say that the fund is tax efficient since covered call strategies essentially convert capital gains into ordinary income.

QYLD Premium Costs

Many retail investors focus on the premiums that are received from selling calls. However, investment returns need to calculated net of costs. If an investor sells a call for $3 and buys it back for $1, the return is $2 rather than $3. Of course, if the underlying stock goes up, an investor may have to buy the call back at $5 (as an example). Premium costs vary over time, so investors may want to evaluate total return rather than just premiums received.

QYLD Review: A Recap

The above review of QYLD illustrates that QYLD is a typical covered call strategy, but covered call strategies are not for everyone (including yours truly). I would not personally invest in QYLD nor would I recommend it to anyone else, unless they fully understand covered calls and the performance and tax implications.

FAQs

XYLD ETF Review: Is XYLD a Good Investment?

The Global X S&P 500 Covered Call ETF (symbol: XYLD) is one of the largest covered call exchange-traded funds (ETFs) in the market and is quite popular with retail investors. XYLD employs a covered call strategy, which attempts to generate income by selling the upside potential of its portfolio. While covered calls may make sense in certain situations, my observation is that individual investors do not typically fully understand the dynamics of the strategy or the trade-offs in terms of risk and return. Hopefully, the below can help investors evaluate whether XYLD is a good investment for their portfolio.

A quick reminder that this site does NOT provide investment recommendations. Fund reviews (such as this one) are for educational purposes only and are not advice or recommendations.

The Short Answer

XYLD may be a good tool in very specific situations, but XYLD is not a good investment for many other situations. Covered call strategies (including XYLD) carry a specific and well-known set of tradeoffs that many investors do not necessarily fully understand or consider the implications. I would not recommend XYLD to most investors.

XYLD Performance

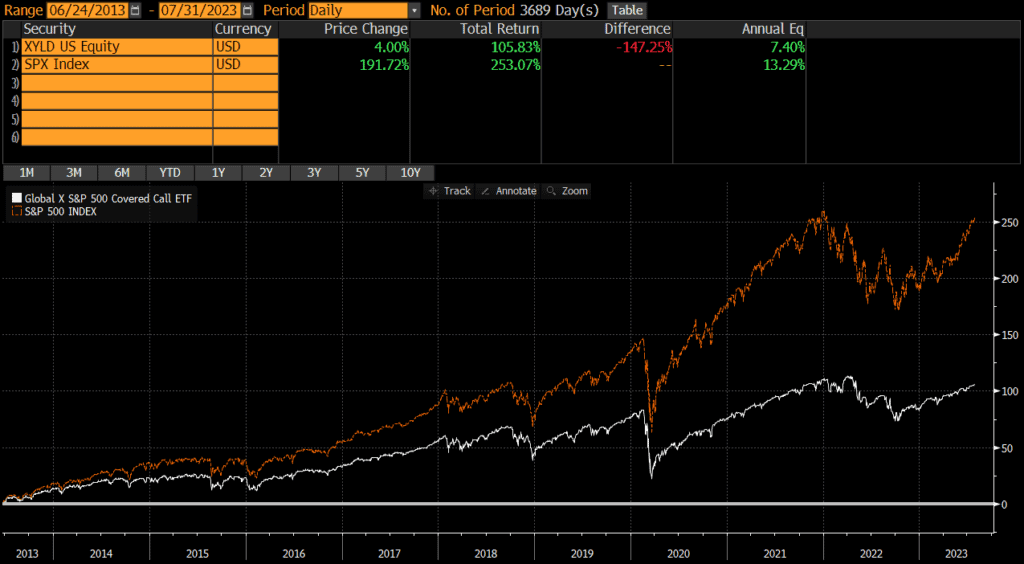
The first thing most investors want to know about is performance, so we will start there. According to Bloomberg, since the fund’s inception in mid 2013, XYLD has returned 7.40% per year which is WAY below the S&P 500’s performance of 13.29% over the same time period.

Source: ThoughtfulFinance.com, Bloomberg

As the XYLD chart of historical performance below shows, XYLD has dramatically underperformed the S&P 500 over time. XYLD outperformed in 2022, when equity markets experienced a lot of volatility, but began to underperform again in 2022. As of this writing, the total return of the two similar (although XYLD is much less tax-efficient). This is not surprising and exactly what I would expect from a covered call fund as the strategy is to sell upside potential in exchange for cash which helps offset downside losses. So I would expect XYLD to underperform when equity markets are doing well, outperform when equities are volatile, and generally underperform over longer time horizons (especially on an after-tax basis).

In terms of risk and drawdowns, XYLD’s downside has been more limited (as has its upside though). The peak-to-trough decline of the S&P 500 total return in 2022 was roughly 23% while XYLD’s total return was down “only” 17%. That being said, the S&P’s prior outperformance meant that it still performed much better even thought it had larger decline in 2022 (see first chart). My view is that writing covered calls does not provide that much (if any) downside protection because of the general underperformance relative to the underlying. This is not necessarily intrinsically good or bad, but investors should be aware.

XYLD Risks

XYLD owns stocks which are more volatile than cash or bonds. While the returns are higher than cash or bonds, investors need to be prepared to stomach volatility and be able to hold for the longer-term. XYLD was down over 17% at one point in 2022. This is not necessarily worse than other similar funds, but it is a characteristic of stocks that investors need to be aware of.

XYLD Portfolio

Fund performance is ultimately driven by a fund’s holdings and exposures, so our XYLD review will examine these items.

XYLD Holdings

XYLD (and its underlying index) is relatively well diversified, holding over 500 stocks. This represents the large-cap segment of the US stock market.

XYLDS&P 500
Number of Stocks506503
Sources: ThoughtfulFinance.com, Morningstar (as of 7/27/2023)

XYLD Country Exposures

XYLD only owns US-based companies. Investors looking for international exposure may pair XYLD with international ETFs or simply hold a global ETF.

XYLD Market Cap Exposure

XYLD is primarily a large-cap fund which seeks to represent the largest US stocks. Even though the fund holds some mid-caps, performance is primarily driven by the large-cap exposure.

XYLD
Large-Cap82%
Mid-Cap17%
Small-Cap0%
Source: ThoughtfulFinance.com, Morningstar; data as of 7/27/2023

XYLD Sector Exposures

XYLD is extremely diversified across sectors and mirrors the approximate weights of the broad US stock market.

XYLD
Basic Materials2.27%
Consumer Cyclical10.68%
Financial Services12.28%
Real Estate2.48%
Communication Services8.62%
Energy4.32%
Industrials8.37%
Technology28.53%
Consumer Defensive6.63%
Healthcare13.30%
Utilities2.53%
Source: ThoughtfulFinance.com, Morningstar; data as of 7/27/2023

Expenses

No review of XYLD would be complete without an in-depth look at the explicit and implicit costs of trading and holding XYLD.

XYLD Expense Ratio

XYLD’s expense ratio of .60% is quite a bit higher than most domestic index ETFs, but this is to be expected for a more active strategy.

XYLD Transaction Costs

ETFs are free to trade at many brokers and custodians, so XYLD should be free to trade in most cases. Additionally, it is among the largest ETFs and is very liquid. The bid-ask spread of XYLD is about .02%, so individual investor trades will not generally be large enough to impact or move the market.

XYLD Tax Efficiency

XYLD is not very tax-efficient as the premiums received from selling calls are taxed at ordinary income rates. While some investors may not mind receiving income in lieu of potential upside, this is akin to converting capital gains (from appreciation) into ordinary income. Of course, a covered call strategy will lose less money if the market declines, but covered call strategies (including XYLD) have a large tax drag.

ETFs are typically more tax-efficient than mutual funds, due to their ability to avoid realizing capital gains through like-kind redemptions (a process that is beyond the scope of this post). However XYLD has made capital gains distributions and I would not necessarily say that the fund is tax efficient since covered call strategies essentially convert capital gains into ordinary income.

XYLD Premium Costs

Many retail investors focus on the premiums that are received from selling calls. However, investment returns need to calculated net of costs. If an investor sells a call for $3 and buys it back for $1, the return is $2 rather than $3. Of course, if the underlying stock goes up, an investor may have to buy the call back at $5 (as an example). Premium costs vary over time, so investors may want to evaluate total return rather than just premiums received.

XYLD Review: A Recap

The above review of XYLD illustrates that XYLD is a typical covered call strategy. But covered call strategies are not for everyone (including yours truly). I would not personally invest in XYLD nor would I recommend it to anyone else, unless they fully understand covered calls and the performance and tax implications.

FAQs

DIVO ETF Review: Is DIVO a Good Investment?

The Amplify CWP Enhanced Dividend ETF (symbol: DIVO) is one of the larger covered call exchange-traded funds (ETFs) in the market and is quite popular with retail investors. DIVO employs a covered call strategy, which attempts to generate income by selling the upside potential of its portfolio. While covered calls may make sense in certain situations, my observation is that individual investors do not typically fully understand the dynamics of the strategy or the trade-offs in terms of risk and return. Hopefully, the below can help investors evaluate whether DIVO is a good investment for their portfolio.

A quick reminder that this site does NOT provide investment recommendations. Fund reviews (such as this one) are for educational purposes only and are not advice or recommendations.

The Short Answer

DIVO may be a good tool in very rare specific situations, but DIVO is not a good investment for many other situations. Covered call strategies (including DIVO) carry a specific and well-known set of tradeoffs that many investors do not necessarily fully understand or consider the implications. Even if I were to invest in a covered call strategy, I probably would not use DIVO.

DIVO Performance

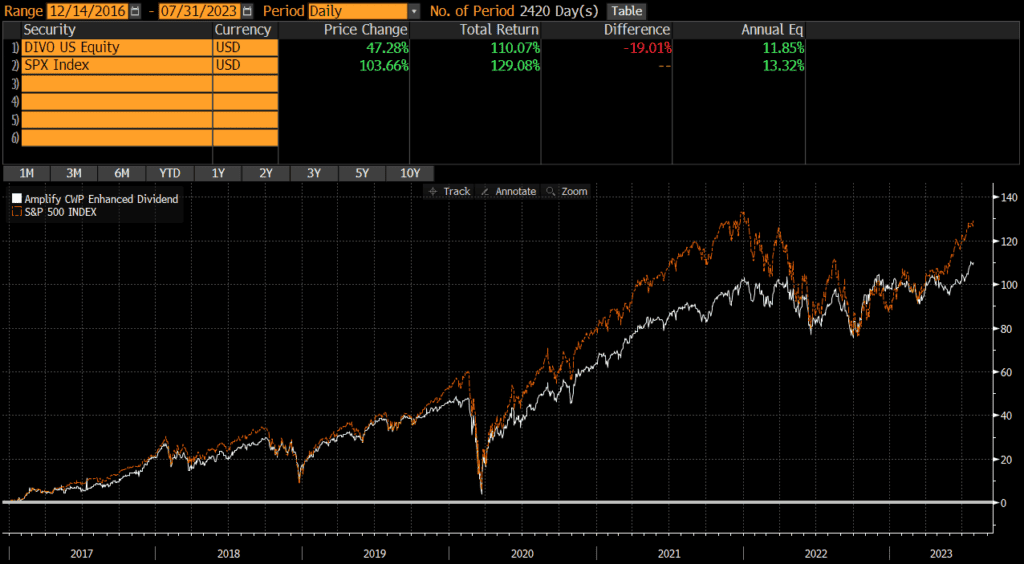
The first thing most investors want to know about is performance, so we will start there. According to Bloomberg, since the fund’s inception in late 2016, DIVO has returned 11.85% per year which is below the S&P 500’s performance of 13.32% over the same time period.

As the DIVO chart of historical performance below shows, DIVO has not materially outperformed in any year except 2022. DIVO outperformed in 2022, when equity markets experienced a lot of volatility, but began to underperform again in 2023. This is not surprising and exactly what I would expect from a covered call fund as the strategy is to sell upside potential in exchange for cash which helps offset downside losses. So I would expect DIVO to underperform when equity markets are doing well, outperform when equities are volatile, and generally underperform over longer time horizons (especially on an after-tax basis).

Source: ThoughtfulFinance.com, Bloomberg

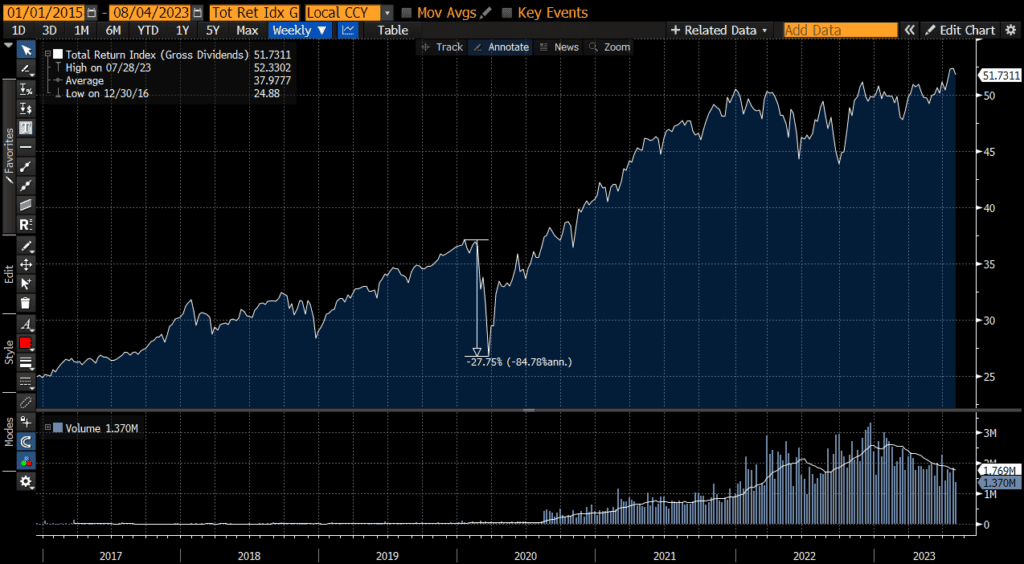
In terms of risk and drawdowns, DIVO’s downside has been slightly more limited (as has its upside though). The peak-to-trough decline of DIVO’s total return was down “only” 27.75% in 2020, while the S&P 500 was closer to 31.5%. That being said, the S&P’s prior outperformance meant that its larger decline only brought the total return down to DIVO’s level (rather than below it). My view is that writing covered calls does not provide that much (if any) downside protection because of the general underperformance relative to the underlying. This is not necessarily intrinsically good or bad, but investors should be aware.

Source: ThoughtfulFinance.com

DIVO Risks

DIVO owns stocks which are more volatile than cash or bonds. While the returns are higher than cash or bonds, investors need to be prepared to stomach volatility and be able to hold for the longer-term. DIVO was down nearly 28% at one point in 2020. This is not necessarily worse than other similar funds, but it is a characteristic of stocks that investors need to be aware of.

DIVO Portfolio

Fund performance is ultimately driven by a fund’s holdings and exposures, so our DIVO review will examine these items.

DIVO Holdings

DIVO (and its underlying index) is relatively concentrated and does not hold very many stocks. This represents the large-cap segment of the US stock market.

DIVOS&P 500
Number of Stocks24503
Sources: ThoughtfulFinance.com, Morningstar (as of 7/27/2023)

DIVO Country Exposures

DIVO only owns US-based companies. Investors looking for international exposure may pair DIVO with international ETFs or simply hold a global ETF.

DIVO Market Cap Exposure

DIVO is primarily a large-cap fund which seeks to represent the largest US stocks. Even though the fund holds some mid-caps, performance is primarily driven by the large-cap exposure.

DIVO
Large-Cap96%
Mid-Cap3%
Small-Cap0%
Source: ThoughtfulFinance.com, Morningstar; data as of 7/27/2023

DIVO Sector Exposures

DIVO is not very diversified across sectors nor does it mirror the approximate weights of the broad US stock market.

DIVO
Basic Materials1.18%
Consumer Cyclical11.76%
Financial Services17.40%
Real Estate0.00%
Communication Services1.86%
Energy10.96%
Industrials11.69%
Technology11.08%
Consumer Defensive14.81%
Healthcare15.95%
Utilities3.31%
Source: ThoughtfulFinance.com, Morningstar; data as of 7/27/2023

Expenses

No review of DIVO would be complete without an in-depth look at the explicit and implicit costs of trading and holding DIVO.

DIVO Expense Ratio

DIVO’s expense ratio of .55% is quite a bit higher than most domestic index ETFs, but this is not surprising for a more active strategy.

DIVO Transaction Costs

ETFs are free to trade at many brokers and custodians, so DIVO should be free to trade in most cases. Additionally, it is relatively liquid. The bid-ask spread of DIVO is about .1%, so individual investor trades will not generally be large enough to impact or move the market.

DIVO Tax Efficiency

DIVO is not very tax-efficient as the premiums received from selling calls are taxed at ordinary income rates. While some investors may not mind receiving income in lieu of potential upside, this is akin to converting capital gains (from appreciation) into ordinary income. Of course, a covered call strategy will lose less money if the market declines, but covered call strategies (including DIVO) have a large tax drag.

ETFs are typically more tax-efficient than mutual funds, due to their ability to avoid realizing capital gains through like-kind redemptions (a process that is beyond the scope of this post). However, DIVO has made capital gains distributions and I would not necessarily say that the fund is tax efficient since covered call strategies essentially convert capital gains into ordinary income.

DIVO Premium Costs

Many retail investors focus on the premiums that are received from selling calls. However, investment returns need to calculated net of costs. If an investor sells a call for $3 and buys it back for $1, the return is $2 rather than $3. Of course, if the underlying stock goes up, an investor may have to buy the call back at $5 (as an example). Premium costs vary over time, so investors may want to evaluate total return rather than just premiums received.

DIVO Review: A Recap

The above review of DIVO illustrates that DIVO is a typical covered call strategy. It gained quite a bit of popularity and assets during the bear market of 2022, but covered call strategies are not for everyone (including yours truly). I would not personally invest in DIVO nor would I recommend it to anyone else, unless they fully understand covered calls and the performance and tax implications.

FAQs

JEPQ ETF Review: Is JEPQ a Good Investment?

The JP Morgan Nasdaq Equity Premium ETF (symbol: JEPQ) is one of the largest covered call exchange-traded funds (ETFs) in the market and is quite popular with retail investors. JEPQ employs a covered call strategy, which attempts to generate income by selling the upside potential of its portfolio. While covered calls may make sense in certain situations, my observation is that individual investors do not typically fully understand the dynamics of the strategy or the trade-offs in terms of risk and return. Interestingly, JEPQ overlays its strategy on the Nasdaq 100 index, rather than the S&P 500 (like its big sibling JEPI). Hopefully, the below can help investors evaluate whether JEPQ is a good investment for their portfolio.

A quick reminder that this site does NOT provide investment recommendations. Fund reviews (such as this one) are for educational purposes only and are not advice or recommendations.

The Short Answer

JEPQ may be a good tool in rare specific situations, but JEPQ is not a good investment for many other situations. Covered call strategies (including JEPQ) carry a specific and well-known set of tradeoffs that many investors do not necessarily fully understand or consider the implications. I would not recommend JEPQ to most investors.

JEPQ Performance

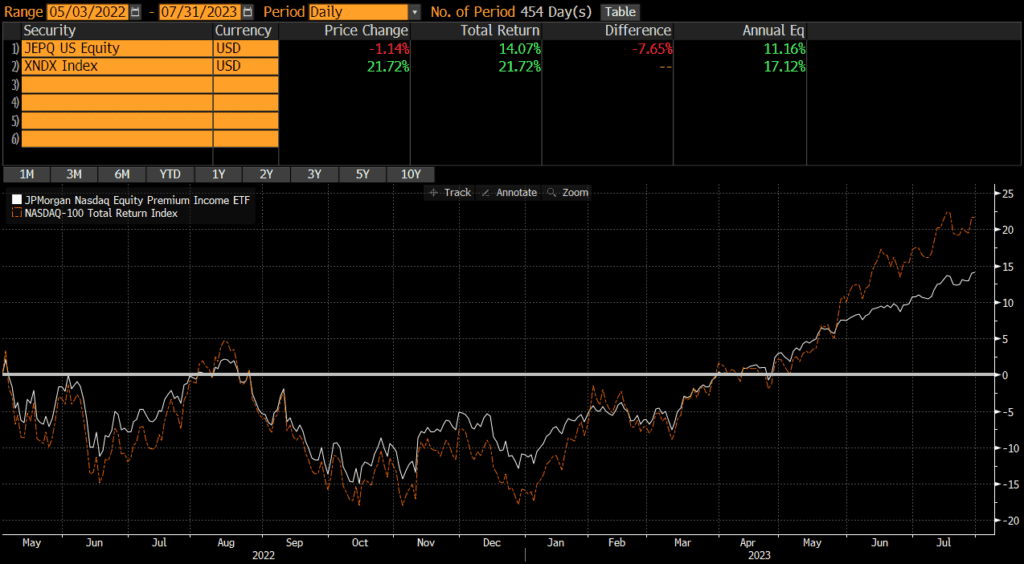
The first thing most investors want to know about is performance, so we will start there. According to Bloomberg, since the fund’s inception in mid 2022, JEPQ has returned 11.16% annualized which is below the Nasdaq 100 Index’s performance of 17.12% over the same time period. It is important to note that the Nasdaq 100 is different than the Nasdaq Composite Index.

As the JEPQ chart of historical performance below shows, JEPQ outperformed in ever so slightly in 2022 (when equity markets experienced a lot of volatility) and began to underperform in 2022 (as market rallied). This is not surprising and exactly what I would expect from a covered call fund as the strategy is to sell upside potential in exchange for cash which helps offset downside losses. So I would expect JEPQ to underperform when equity markets are doing well, outperform when equities are volatile, and generally underperform over longer time horizons (especially on an after-tax basis). I am a bit surprised that JEPQ did not perform better in 2022 given the volatility, but perhaps the fund was launched a bit too late. Overall, performance has not been impressive.

Source: ThoughtfulFinance.com, Bloomberg

In terms of risk and drawdowns, JEPQ’s downside has been slightly more limited (as has its upside though). The peak-to-trough decline of JEPQ in 2022 was roughly 15% versus approximately 18% for the Nasdaq 100 during the same period.

JEPQ Risks

JEPQ owns stocks which are more volatile than cash or bonds. While the returns are higher than cash or bonds, investors need to be prepared to stomach volatility and be able to hold for the longer-term. JEPQ was down over 16% at one point in 2022. Interestingly, QYLD (a similar strategy that launched before 2022) was down over 24% in 2022, so there definitely is risk. This is not necessarily worse than other similar funds (over the same time period), but it is a characteristic of stocks that investors need to be aware of.

JEPQ Portfolio

Fund performance is ultimately driven by a fund’s holdings and exposures, so our JEPQ review will examine these items.

JEPQ Holdings

JEPQ (and its underlying index) is relatively well diversified in terms of number of holdings.

JEPQNASDAQ 100
Number of Stocks88100
Sources: ThoughtfulFinance.com, Morningstar (as of 7/27/2023)

JEPQ Country Exposures

JEPQ primarily owns US-based companies. Investors looking for international exposure may pair JEPQ with international ETFs or simply hold a global ETF.

JEPQ Market Cap Exposure

JEPQ is primarily a large-cap fund which seeks to represent the largest US stocks listed on the Nasdaq. Even though the fund holds some mid-caps, performance is primarily driven by the large-cap exposure.

JEPQ
Large-Cap93%
Mid-Cap6%
Small-Cap0%
Source: ThoughtfulFinance.com, Morningstar; data as of 7/27/2023

JEPQ Sector Exposures

Similar to the underlying Nasdaq 100 index, JEPQ is quite concentrated in terms of sectors.

JEPQ
Basic Materials0.00%
Consumer Cyclical13.73%
Financial Services0.90%
Real Estate0.35%
Communication Services15.25%
Energy0.37%
Industrials4.24%
Technology49.92%
Consumer Defensive6.75%
Healthcare7.04%
Utilities1.44%
Source: ThoughtfulFinance.com, Morningstar; data as of 7/27/2023

Expenses

No review of JEPQ would be complete without an in-depth look at the explicit and implicit costs of trading and holding JEPQ.

JEPQ Expense Ratio

JEPQ’s expense ratio of .35% is quite a bit higher than most domestic index ETFs, but this is to be expected for a more active strategy. Also, although it’s 10x the cost of a plain vanilla index fund, its only 30-35 basis points.

JEPQ Transaction Costs

ETFs are free to trade at many brokers and custodians, so JEPQ should be free to trade in most cases. Additionally, it is among the largest ETFs and is very liquid. The bid-ask spread of JEPQ is about .02%, so individual investor trades will not generally be large enough to impact or move the market.

JEPQ Tax Efficiency

JEPQ is not very tax-efficient as the premiums received from selling calls are taxed at ordinary income rates. While some investors may not mind receiving income in lieu of potential upside, this is akin to converting capital gains (from appreciation) into ordinary income. Of course, a covered call strategy will lose less money if the market declines, but covered call strategies (including JEPQ) have a large tax drag.

ETFs are typically more tax-efficient than mutual funds, due to their ability to avoid realizing capital gains through like-kind redemptions (a process that is beyond the scope of this post). This is true of JEPQ as well, since it has not made any capital gains distributions to date. However, I would not necessarily say that the fund is tax efficient since covered call strategies essentially convert capital gains into ordinary income.

JEPQ Premium Costs

Many retail investors focus on the premiums that are received from selling calls. However, investment returns need to calculated net of costs. If an investor sells a call for $3 and buys it back for $1, the return is $2 rather than $3. Of course, if the underlying stock goes up, an investor may have to buy the call back at $5 (as an example). Premium costs vary over time, so investors may want to evaluate total return rather than just premiums received.

JEPQ Review: A Recap

The above review of JEPQ illustrates that JEPQ is a typical covered call strategy. It gained quite a bit of popularity and assets during the bear market of 2022, but covered call strategies are not for everyone (including yours truly). I would not personally invest in JEPQ nor would I recommend it to anyone else, unless they fully understand covered calls and the performance and tax implications.

FAQs

JEPI ETF Review: Is JEPI a Good Investment?

The JP Morgan Equity Premium ETF (symbol: JEPI) is one of the largest covered call exchange-traded funds (ETFs) in the market and is quite popular with retail investors. JEPI employs a covered call strategy, which attempts to generate income by selling the upside potential of its portfolio. While covered calls may make sense in certain situations, my observation is that individual investors do not typically fully understand the dynamics of the strategy or the trade-offs in terms of risk and return. Hopefully, the below can help investors evaluate whether JEPI is a good investment for their portfolio.

A quick reminder that this site does NOT provide investment recommendations. Fund reviews (such as this one) are for educational purposes only and are not advice or recommendations.

The Short Answer

JEPI may be a good tool in very specific situations, but JEPI is not a good investment for many other situations. Covered call strategies (including JEPI) carry a specific and well-known set of tradeoffs that many investors do not necessarily fully understand or consider the implications. I would not recommend JEPI to most investors.

JEPI Performance

The first thing most investors want to know about is performance, so we will start there. According to Bloomberg, since the fund’s inception in mid 2020, JEPI has returned 13.32% per year which is below the S&P 500’s performance of 16.65% over the same time period.

As the JEPI chart of historical performance below shows, JEPI underperformed the S&P 500 in 2020 and 2021. Then JEPI outperformed in 2022, when equity markets experienced a lot of volatility, but began to underperform again in 2022. This is not surprising and exactly what I would expect from a covered call fund as the strategy is to sell upside potential in exchange for cash which helps offset downside losses. So I would expect JEPI to underperform when equity markets are doing well, outperform when equities are volatile, and generally underperform over longer time horizons (especially on an after-tax basis).

Source: ThoughtfulFinance.com, Bloomberg

In terms of risk and drawdowns, JEPI’s downside has been more limited (as has its upside though). The peak-to-trough decline of the S&P 500 total return in 2022 was roughly 23% while JEPI’s total return was down only 13.6%. That being said, the S&P’s prior outperformance meant that its larger decline only brought the total return down to JEPI’s. My view is that writing covered calls does not provide that much (if any) downside protection because of the general underperformance relative to the underlying. This is not necessarily intrinsically good or bad, but investors should be aware.

Source: ThoughtfulFinance.com

JEPI Risks

JEPI owns stocks which are more volatile than cash or bonds. While the returns are higher than cash or bonds, investors need to be prepared to stomach volatility and be able to hold for the longer-term. JEPI was down over 13% at one point in 2022. This is not necessarily worse than other similar funds, but it is a characteristic of stocks that investors need to be aware of.

JEPI Portfolio

Fund performance is ultimately driven by a fund’s holdings and exposures, so our JEPI review will examine these items.

JEPI Holdings

JEPI (and its underlying index) is relatively well diversified, holding over 100 stocks. This represents the large-cap segment of the US stock market.

JEPIS&P 500
Number of Stocks136503
Sources: ThoughtfulFinance.com, Morningstar (as of 7/27/2023)

JEPI Country Exposures

JEPI only owns US-based companies. Investors looking for international exposure may pair JEPI with international ETFs or simply hold a global ETF.

JEPI Market Cap Exposure

JEPI is primarily a large-cap fund which seeks to represent the largest US stocks. Even though the fund holds some mid-caps, performance is primarily driven by the large-cap exposure.

JEPI
Large-Cap82%
Mid-Cap17%
Small-Cap0%
Source: ThoughtfulFinance.com, Morningstar; data as of 7/27/2023

JEPI Sector Exposures

JEPI is extremely diversified across sectors and mirrors the approximate weights of the broad US stock market.

JEPI
Basic Materials3.86%
Consumer Cyclical9.07%
Financial Services12.22%
Real Estate3.70%
Communication Services5.27%
Energy2.95%
Industrials13.58%
Technology17.57%
Consumer Defensive12.85%
Healthcare13.58%
Utilities5.36%
Source: ThoughtfulFinance.com, Morningstar; data as of 7/27/2023

Expenses

No review of JEPI would be complete without an in-depth look at the explicit and implicit costs of trading and holding JEPI.

JEPI Expense Ratio

JEPI’s expense ratio of .35% is quite a bit higher than most domestic index ETFs, but this is to be expected for a more active strategy. Also, although it’s 10x the cost of a plain vanilla index fund, its only 30-35 basis points.

JEPI Transaction Costs

ETFs are free to trade at many brokers and custodians, so JEPI should be free to trade in most cases. Additionally, it is among the largest ETFs and is very liquid. The bid-ask spread of JEPI is about .02%, so individual investor trades will not generally be large enough to impact or move the market.

JEPI Tax Efficiency

JEPI is not very tax-efficient as the premiums received from selling calls are taxed at ordinary income rates. While some investors may not mind receiving income in lieu of potential upside, this is akin to converting capital gains (from appreciation) into ordinary income. Of course, a covered call strategy will lose less money if the market declines, but covered call strategies (including JEPI) have a large tax drag.

ETFs are typically more tax-efficient than mutual funds, due to their ability to avoid realizing capital gains through like-kind redemptions (a process that is beyond the scope of this post). This is true of JEPI as well, since it has not made any capital gains distributions to date. However, I would not necessarily say that the fund is tax efficient since covered call strategies essentially convert capital gains into ordinary income.

JEPI Premium Costs

Many retail investors focus on the premiums that are received from selling calls. However, investment returns need to calculated net of costs. If an investor sells a call for $3 and buys it back for $1, the return is $2 rather than $3. Of course, if the underlying stock goes up, an investor may have to buy the call back at $5 (as an example). Premium costs vary over time, so investors may want to evaluate total return rather than just premiums received.

JEPI Review: A Recap

The above review of JEPI illustrates that JEPI is a typical covered call strategy. It gained quite a bit of popularity and assets during the bear market of 2022, but covered call strategies are not for everyone (including yours truly). I would not personally invest in JEPI nor would I recommend it to anyone else, unless they fully understand covered calls and the performance and tax implications.

FAQs

Direct indexing: a tool for ESG and philanthropy

Direct indexing has generated a tremendous amount of interest with advisors. A number of large firms, including Vanguard, have completed acquisitions of direct indexing firms, and major custodians have announced plans to offer direct indexing.

Let’s talk about what direct indexing is and whether it makes sense for your clients. Simply put, direct indexing is a move away from commingled funds to direct ownership of stocks in an investor’s account. The term refers to direct ownership and to the fact that the strategies are passive and track a broad index. Advances in technology allow index performance to be closely tracked with only a subset of constituents. Because the investor owns these stocks individually, they can customize this portfolio, including the expression of financial and environmental, social, and governance (ESG) preferences in ways not possible with mutual funds or ETFs.

Financially, there are several benefits to this approach, particularly tax-loss harvesting (because stocks are owned individually and realized losses can be used to reduce taxes) and the opportunity to tilt toward investment themes such as growth or value. Similarly, direct indexing offers an array of benefits for ESG investing.

Direct indexing for ESG?

There are already many ESG-themed funds and ETFs, so what does direct indexing have to offer investors? A surprising number of benefits: increased transparency, customization, the ability to address multiple ESG areas simultaneously, flexibility, and a choice on shareholder voting, to name but a few.

ESG funds tend to either target generalized ESG scores—which can be hard to understand in terms of impact—or to focus on one specific theme. For example, one fund might emphasize diversity in hiring, while another might emphasize environmental compliance. Choosing an ESG ETF means combing through different definitions, strategies, and implementations of ESG that can be hard to compare. An investor could have to split money between funds or choose a general ESG fund that doesn’t focus on the areas the investor wants to focus on. While tailoring solutions is doable, research and manager selection can be daunting for advisor or client.

Direct indexing can address these issues. Investors apply ESG screens (removing certain securities from their portfolio) or tilts (weighting ESG positive securities more heavily in their portfolio). The investor immediately sees how these tilts and screens affect portfolio characteristics. For example, an investor concerned about climate change and gender equality can screen fossil fuel-related companies and tilt toward companies with gender-diverse leadership. With direct indexing, customization becomes simple, easy, and transparent.

On the plus side, an investor can apply various ESG policy settings as they wish. However, more settings can increase tracking error and introduce deviation from the benchmark. Understanding these tradeoffs is an important job for advisors.

Also, issues in ESG transparency remain prominent. ESG data is a fast-evolving area, with well-documented differences in scores between data vendors, and it can be difficult to arrive at a consensus definition of ESG scores or issues. A best practice is to offer clients a wide range of ESG options that depend on direct ESG measures rather than evaluated scores. Measures like carbon emissions, percentage of women on boards, and revenue from alternative energy are often most tangible and actionable, although it is important to recognize that there will still be debate over which metrics are best. For instance, which specific emissions should be evaluated, and are a company’s actual emissions or its progress in reducing emissions more important? The answers vary from investor to investor, and this is where advisors can add value.

Investors even have a choice when it comes to shareholder advocacy. For funds and ETFs, the fund managers hold discretion over proxy voting. With direct indexing, an investor can choose to vote proxies or delegate to the direct indexing manager. In the latter case, they should feel empowered to provide proxy voting preferences for the manager to implement on their behalf.

Direct indexing for philanthropy

A primary benefit of direct indexing is the ability to harvest losses from individual stocks while still tracking an index. One criticism of direct indexing is that investors have fewer tax-loss harvesting opportunities as the years go by, and the portfolio has an increasing amount of unrealized capital gains. However, for philanthropic investors, direct indexing allows both the harvesting of losses each year and also the opportunity to donate stocks with gains. Donating allows investors to avoiding realizing capital gains, which removes the embedded tax liability of positions with unrealized gains and increases the tax alpha of the portfolio strategy. Donating stocks may be a much more tax-efficient way to rebalance the portfolio and reduce tracking error as well. Furthermore, if the stock donations are in lieu of cash donations, then investors may choose to redirect that cash to the portfolio and immediately repurchase more shares, which will increase the cost basis of the portfolio and create additional opportunities for future tax-loss harvesting.

In today’s quickly evolving investments landscape, direct indexing brings investors and their advisors new options to address specific investment needs, including ESG inclusion and tax-efficient giving. It’s a smart, flexible way of investing. No matter exactly what ESG or philanthropy is to an investor, from a general desire to do good to a specific impact strategy, it can be expressed through direct indexing with choice and transparency.

[This post originally appeared in the June 2022 issue of NAPFA Advisor magazine. Original can be found here: https://education.napfa.org/URL/Product/2b84f1fc-1604-4d06-8611-c8963b4037fe]

Covered Call Risks, Problems, and Myths

Selling covered calls is a popular options strategy pursued by many individual investors, who often believe it is a good strategy to generate additional income from their stock portfolio. While this is true in certain circumstances, individual investors often misunderstand aspects of covered calls strategies and/or ignore covered call risks.

In their paper “Covered Call Strategies: One Fact and Eight Myths”, Roni Israelov and Lars N. Nielsen provide valuable insights on these risks and debunk several common misconceptions about covered calls. Much of the below is a summary of their seminal paper. It is worth noting that Israelov and Nielsen were both Principals at AQR, one of the most esteemed quantitative asset managers.

I believe it is crucial for covered call investors to understand the underlying risks, differentiate between facts and myths, and assess the potential impact on their portfolios. With accurate information and a clear understanding of the strategy, investors can make informed decisions on whether to incorporate covered calls into their overall investment approach.

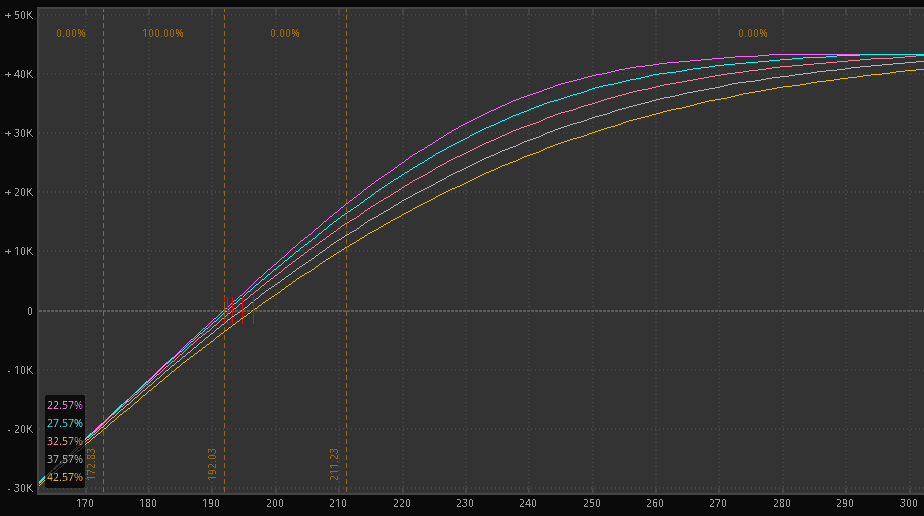
Risk Cannot Be Expressed in a Payoff Diagram

Many investors mistakenly believe that risk exposure in covered call strategies can be easily expressed in a payoff diagram. However, these payoff diagrams typically only represents the potential gains and losses from an options position at expiration. Although informative, these diagrams have limitations when it comes to illustrating the true risk exposure of covered call strategies.

As mentioned above, options values and strategies are path-dependent, so the point-in-time payoff diagrams are not necessarily that helpful. There is software and online tools that can model risk and generate payoff diagrams at different points in time though.

Covered call strategies also involve the interplay between the underlying stock and the written call option, which requires the simultaneous management of both the stock and the option. This relationship is dynamic, and risk exposure can change significantly as market conditions evolve. Payoff diagrams are unable to capture these intricacies and fluctuations in risk, although there is software that can model these relationships and diagrams at different levels of prices and volatilities.

While payoff diagrams are useful in understanding the basic structure of an options position, they cannot fully express the risk exposure in covered call strategies. Investors should be aware of these limitations and rely on more comprehensive tools and analysis to manage risk effectively in their portfolios.

Covered Calls Do Not Provide Downside Protection

One misconception regarding covered calls is that they provide investors with some downside risk. While that is technically true, the protection is limited to the premium received from selling the call option. If the stock’s price suffers a severe decline, the premium from the call option will likely not be enough to cover the losses incurred by the stock’s decline. Moreover, the call option seller would still be exposed to any further losses beyond the initial premium collected.

A primary benefit of a covered call strategy is the additional income generated by selling the call option contract. This income can act as a buffer against minor stock price fluctuations; in other words, this income is the same as the downside risk protection. However, this minimal amount of downside protection comes with a potential cost. The potential cost/risk is that covered calls may cap potential gains on the underlying stock. When an investor writes a call option, they agree to sell the stock at the strike price, even if the stock price soars beyond that. In such cases, the call option seller would miss out on the full extent of the stock’s growth potential.

It is important to remember that covered call strategies should be employed thoughtfully, as they marginally help in downside scenarios and can really hinder performance in upside scenarios.

Covered Calls Do Not Generate Income

Covered calls are a popular options strategy used by investors to generate income in the form of options premiums. However, there is a misconception that premium received is actually income.

Income is revenue minus cost, as Israelov and Nielsen note. The options premium received is revenue, not income. If and/or when the call is bought back, that cost must be subtracted from the revenue. If the underlying stock moves up in price, that the income is likely to decrease and may even flip to negative number. In those cases, the income is actually negative as costs exceed the original premium received.

Additionally, the tax implications of generating income from options premiums can be complex, further complicating the income generation aspect of this strategy.

While covered calls can be a useful tool for generating income, investors must recognize the inherent risks and limitations associated with this strategy. As noted, it is essential to approach covered calls with a comprehensive understanding of the strategy and its potential outcomes to maximize its benefits and minimize potential losses.

Covered Calls on High Volatility Stocks and Shorter-Dated Options Do Not Provide Higher Yields

Investors often assume that writing covered calls on high volatility stocks and opting for shorter-dated options result in higher yields. This is not always the case.

When trading covered calls on stocks with high volatility, investors may perceive higher premiums as attractive, but the risks associated with these stocks can negate the potential rewards. High volatility means that the stock price is more likely to experience larger price swings, leading to a greater probability of the option being exercised and the investor losing out on potential gains beyond the strike price. Additionally, a high volatility environment might incentivize investors to write options with higher strike prices in the hopes of retaining their stocks if they rally, but this limits income from the covered call strategy.

Shorter-dated options are often assumed to provide higher yields due to the faster rate of time decay (Theta) as the options approach expiration. While it’s true that options with shorter time to expiration generally have higher time decay, this does not always translate to higher overall yields. The lower premiums of shorter-dated options often outweighs the benefits of faster time decay, leading to lower overall yields compared to longer-dated options.

Another factor to consider is transaction costs. When writing shorter-dated covered calls, investors may find themselves undertaking more frequent transactions. This can lead to higher costs, including commission fees and potential bid-ask spread slippage, all of which can eat into the overall return from the covered call strategy.

While high volatility stocks and shorter-dated options might seem attractive to investors looking to earn more from their covered call strategy, the risks and potential downsides can outweigh the benefits. It’s essential for investors to look beyond the perceived high yields and consider other factors, such as stock price movements, implied volatility, and transaction costs, when implementing a covered call strategy.

Time Decay of Written Options Do Not Work In Investors Favor

In the world of options trading, time decay can be a significant factor that affects the returns of investors implementing covered call strategies. Time decay, also known as theta decay, is the measure of the rate of decline in the value of an options contract due to the passage of time. For investors who write covered calls, this can sometimes work against them.

There can be various factors that affect the rate of time decay in options contracts, such as implied volatility (IV) and the proximity of the strike price to the current stock price. For instance, when an option is in-the-money or close to being in-the-money, the rate of time decay may slow down. This may result in a smaller decrease in the option’s value, ultimately working against the investor who has written the covered call. Investors often believe that time decay will consistently work in their favor when writing covered calls. However, this is not always true; the rate of decay depends on the initial price among other factors and selling options at too low of a price is risky.

In short, while time decay is an essential concept in options trading and covered call writing, it does not always work in favor of investors who write covered calls. Careful consideration of other factors such as strike price, stock price movement, and implied volatility should be taken into account to optimize the covered call strategy and manage its risks.

Covered Calls Are Not Appropriate If You Have a Neutral to Moderately Bullish View

Covered calls are a popular options strategy, but there are certain situations where utilizing this strategy may not be appropriate or may limit an investor’s upside potential.

One concern with using a covered call strategy is that it may cap potential gains. When an investor writes a covered call, they are selling the right to buy their shares at a specified price, known as the strike price, before the option expires. If the underlying stock price rises significantly above the strike price, the investor will have to sell their shares at the strike price and miss out on the potential gains above that level. This limits the upside potential of the investment, which may not be desirable for those who have a bullish view on the stock.

It’s also important to consider the risk of share ownership. Because a covered call involves owning the underlying stock, the investor is exposed to any potential decline in the stock’s value. While the premium received from selling the call option can help offset some of this risk, it may not fully protect against a significant drop in the stock price (as noted above). Another factor to consider is the possibility of early assignment. When an investor writes a covered call, they run the risk of the option being exercised before its expiration date. In some cases, investors may benefit from considering alternative strategies. For instance, a neutral view may call for a short straddle strategy rather than a covered call strategy.

In conclusion, while covered calls can be an effective strategy for some investors, they may not be appropriate for those with a neutral or bullish outlook on a stock. It’s essential for investors to carefully assess their goals, risk tolerance, and investment outlook before implementing a covered call strategy.

Covered Calls Are a Contractual Obligation, Not A Plan

It is essential to understand that covered calls are a contractual obligation for the option seller, not merely a plan or intention of the investor. Options are called options because they give the BUYER an option. The seller does NOT have an option though!

When an investor enters into a covered call position, they agree to sell their asset to the call option buyer if the option is exercised. This means the investor is contractually bound to fulfill their obligation, regardless of any change in circumstances or the investor’s financial position. This means that when selling a covered call, investors should be prepared for the possibility of having to sell their underlying asset if their call options are assigned.

Some investors sell covered calls with the thought that “if the stock goes up and gets called at $x price, that’s what I would have done anyways.” This is not true though, as investors often change course, especially based on price. We already discussed forfeiting the upside and other problems, but many investors are not considering the full range of outcomes when selling calls.

When selling covered calls, investors must keep in mind that they are entering into a contractual obligation with potential risks and limitations. It’s essential to approach covered calls with a clear understanding of the responsibilities involved and the potential outcomes of engaging in this strategy.

Covered Calls Do Not Allow You to Buy a Stock at a Discounted Price

A common misconception is that covered calls allow you to buy the underlying stock at a discounted price. The logic is that the stock can be bought at the current price minus the option premium received. This is not necessarily the case, and investors should be aware of the risks and potential drawbacks this strategy entails.

Like many of the above points, the issue here is that stock and option prices move! If the stock moves down (more than the value of the premium received), then investors are getting the stock at a premium rather than a discount (to the current price). Therefore, buying both legs of a covered call is not a great way to enter the stock position.

While covered calls can be a useful strategy for generating income in certain situations, it is a stretch to say that investors can buy a stock at a discounted price using covered calls. As with any investment strategy, investors should approach covered calls with a clear understanding of the associated risks and rewards.

Is Warren Buffett Autistic?

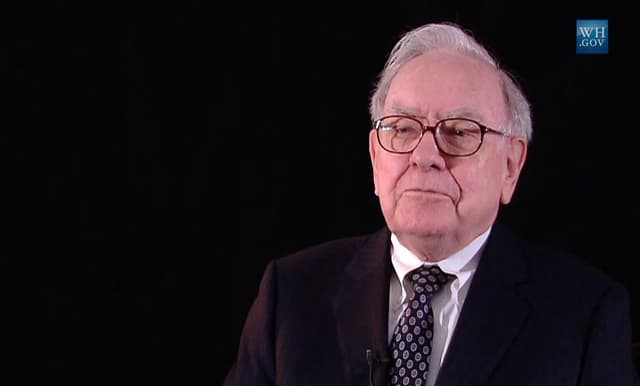
Warren Buffett has never disclosed a spectrum-related identification, but he is clearly autistic. This should be clear to anyone who is familiar with autism and has read his official biography Snowball or watched the HBO documentary Becoming Warren Buffett. For those not familiar with autism or who haven’t read/watched the aforementioned (and are asking “is Warren Buffett autistic?”), I’ve summarized by observations below.

I do not recommend identifying or diagnosing autism in others, although I make exceptions for well-known celebrities since we have exhaustive information about their life, relationships, and interviews with family and friends. Below are the reasons that I believe Buffett is autistic.

Emotions

Many autistics have limited emotion expression. For some, this may be a result of alexithymia. For others, it may be (essentially) a defense mechanism against overwhelming emotion. In any case, Buffett is famously even-keeled and is known to have difficulty with extreme emotions.

“Well it’s difficult to connect on an emotional level because I think that that’s not his basic mode of operation.” -Howard Buffett, Warren Buffett’s son

Prior to her marriage to Warren, Susie’s father (Buffett’s future father-in-law) told her what life would be like: “My dad, the psychologist, said to me, now you have to understand about him, he’s not — you’re not going to have discussions with him like you would with most normal people. He’s not going to talk about other people or small things, or — there will be a lot of things he won’t talk about, because he’s thinking big thoughts up here. So when he’s ready to talk about those, then you’ll have a conversation.” -Susie Buffett, Warren Buffett’s first wife

“If you’re emotional about investing, you’re not going to do well.” -Warren Buffett

“People sometimes speculate that he is emotionless, and I’m frequently asked if he is autistic. He’s certainly not emotionless, but his emotional pendulum swings in a very narrow arc except on those rare occasions when something personal has deeply upset him. While he does use rules to make decisions, it’s key that he’s detached and not temperamentally excitable to begin with.” -Alice Schroeder

Logic and Rationality

“Warren is probably the most rational person I’ve ever met. Charlie Munger would be a close rival, maybe…” -Carol Loomis, journalist who profiled Buffett for decades

“I think that part of Warren’s success comes from the fact that he does not have the same emotional currents affecting his business decisions that other people do.” -Carol Loomis

Consistency

Autistics often prefer routines, perhaps due the way that routines lower the mental load (especially for those with executive function issues). His son notes that his dad was consistent growing up, “like clockwork.” Many have probably heard the trope that autistics are like robots, which is inaccurate but they can be perceived that way.

Buffett is notorious for eating the same food over and over. In the film, Buffett mentions he has driven the same commute for nearly 60 years; he’s lived in the same house and worked in the same neighborhood for all that time, which wouldn’t be odd except he’s one of the richest people in the world and his company one of the largest in the world.

In the HBO documentary, Buffett shares that he eats a McDonald’s breakfast every day, but he only rotates between three items and he knows the exact price (to the penny) of each and has the exact change ready before he leaves the house.

“Well I thought he was a prodigy and I got a lot of criticism. My wife said why are you paying such enormous respect for a young man with a crewcut who won’t eat vegetables.” -Charlie Munger, Warren’s lifelong business partner

Neurodiverse: A Spiky Profile

Many neurodivergent people have “spiky profiles,” which is a way of saying that they are extremely good at some things and extremely weak at other things. “Neurotypical” people tend to operate at the same level in different domains, but the differences can be striking for neurodiverse people. In Buffett’s case, he is a genius in some areas and helpless in other seemingly easy areas.

“Focus has always been a strong part of my personality. If I get interested in something, I get really interested. And—and that was true about any subject. I mean my—if I get—if I get interested in a new subject, I wanna read about it, I wanna talk about it, you know I wanna meet people who are involved in it.” -Warren Buffett

Nearly everyone in the film mentions how he is a genius or prodigy, his encyclopedic memory or affinity for crunching numbers in his head. He graduated highschool at 16 and completed his undergrad in 3 years, yet his most cherished achievement is a certificate from a Dale Carnegie (of How to Win Friends and Influence People fame) course. Again, extreme talent and extreme weakness (in naturally connecting with others).

“He wandered aimlessly around the house, barely able to feed and clothe himself.” -Alice Schroeder, in Buffett’s biography Snowball, describing the time when his wife left him

“He can’t function” -Susie Buffett, Warren’s first wife

“He’s not very visual… He’s not visual at all. But… but that has its pluses. I could buy a horrible looking rug and he’d have his feet on it for three years and never know.” -Susie Buffett

Buffet himself acknowledges his neurology: “I was genetically blessed with a certain wiring that’s very useful in a highly developed market system…” -Warren Buffett

Honesty

Autistics are notorious for their brutal honesty. Again, Buffett fits the mold.

“He’s almost painfully honest at times. Yet some people I interviewed belabored his honesty beyond the point that made sense. They would belabor it to such a degree that you began to realize they held some specific concerns in this area. Eventually it became clearer that this had to do with the incidents in his life where he has been ruthless. I included some representative examples in The Snowball, but space allowed only a fraction to make it into the book.” – Alice Schroeder

Strengths and Weaknesses

It’s clear that Buffetts affinity for numbers, voracious reading, and ability to make connections paired with his extreme rationality explain huge amount of his financial success. His special interest was and continues to be compounding money and he’s become very successful at that. Buffett’s example proves that people on the spectrum can achieve success as a result of their autism.

At the same time, Buffett’s life serves as a warning. His wife and kids lamented at the amount of time he spent reading (alone, separate from the family) and while cool rationality is an investors strength being an “iceberg” husband who has difficulty with emotions can be a challenge in marriage. WSJ writer Jason Zweig fleshed this out in an article. His first wife left him (basically due to neglect because he was so interested in investing) and he admitted that it was the biggest mistake of his life.

“It was preventable. It shouldn’t have happened. It was my biggest mistake. Essentially, what I did in connection with Susie leaving would be the biggest mistake I ever made.” -Buffett, Snowball

Is India an Emerging Market?

The short answer is: yes, India is an emerging market. There is a much longer answer though.

India has been classified as an emerging market since the inception of the label. It is one of largest emerging markets regardless of what metric is used.

India is the world’s largest democracy, recently became the most populous country, has economically-favorable demographics, and it presents a unique opportunity for investors seeking to capitalize on its expanding economy. Over the past decades, the country has seen significant improvements in various sectors, including manufacturing, construction, and infrastructure, leading to increased investor interest in the region. However, it also faces many challenges and has a long ways to go before it can be classified as a developed market.

India’s Status as an Emerging Market

India is considered an emerging market and has experienced an impressive growth trajectory in the past several decades. Its enormous population, robust economic growth, and abundance of young and educated working professionals make it an attractive investment destination.

Comparison with BRICS Nations

The BRICS economies—Brazil, Russia, India, China, and South Africa—are known for their rapid pace of development and growth potential. Let’s take a quick look at some key indicators:

  • Economic growth: According to S&P Global Ratings, India stands out as a “star” among emerging market economies, with an estimated growth rate of 7.3% for the 2022-23 fiscal year. In contrast, China’s growth rate is both lower and declining, which occurs as economies grow and mature; countries like Brazil, Russia, and South Africa have faced varying levels of economic challenges.
  • Investment destination: India’s rapidly expanding middle class and ongoing economic reforms have attracted significant foreign investments in recent years, making it a bright spot among emerging markets. This is especially true since investment flows that might have been directed to other emerging markets such as China are increasingly making their way to India. Part of this stems from trade and political frictions between China and other countries, such as the US.
  • Workforce: One of India’s key advantages over other BRICS nations is its young and growing workforce. This demographic potential enables India to capitalize on the increased demand for skilled labor in various industries.

Despite these positive trends, India also faces many challenges. Like other emerging market economies, it must navigate global headwinds such as poverty, corruption, global monetary policy, slowing global growth, and elevated commodity prices.

While India still has some hurdles to overcome, it is truly emerging and its prospects for future growth remain promising (especially when compared to other BRICS nations).

Economic Drivers of India’s Growth

Several key factors have contributed to India’s growth, such as the expansion of the service sector, the investment cycle, and earnings. In this section, we will explore each of these factors in detail.

Services and Manufacturing

India’s economic growth is largely being driven by its strong services sector, which contributes over 60% to the country’s GDP now. This sector includes areas like information technology, telecommunications, and financial services. As a result, India has become a hub for outsourcing services and an attractive destination for global companies.

This is a positive shift away from overreliance on the manufacturing sector, which has driven India’s economy historically. The government has introduced several initiatives, such as the “Make in India” campaign, to boost domestic manufacturing and attract foreign investment.

Investment Cycle

The investment cycle in India has a significant impact on the nation’s economic growth. Factors such as infrastructure development, ease of doing business, and favorable regulations have all contributed to an increase in investments, both domestic and foreign, in the Indian economy. This, in turn, creates a virtuous circle of job creation, income growth, increased productivity, and higher demand, ultimately leading to further expansion of the economy. This strategy served China very well and it may work for India as well.

Household Income

Household income plays an essential role in India’s growth as its growth contributes to increased consumer spending, driving up domestic demand and fueling economic growth. With a growing middle class and a young population, the benefits of higher earnings should lead to increased consumption of goods and services.

Government Policies and Challenges

India is notorious for its bureaucracy, but regulations and corruption are both on the decline.

Regulation

The government of India has implemented various policies to boost the country’s economic growth. The introduction of the Insolvency and Bankruptcy Code has helped improve financial sector metrics over the past five years.

Indian businesses have thrived in part due to the support of government policies aimed at promoting growth and innovation. However, despite advancements in the regulatory environment, there are challenges that remain, including transparency and ease of doing business.

Infrastructure

Investing in infrastructure lies at the heart of India’s growth strategy. The government has outlined ambitious plans to enhance transportation infrastructure, which is vital for economic development. Major projects include the construction of highways, railways, and airports, which should facilitate both regional and international connectivity. As someone who has visited many times, the pace of development is dizzying.

Despite these strides, India faces significant infrastructure challenges that may hinder its progress as an emerging market. For instance, underdeveloped urban transportation systems and inadequate rural infrastructure can lead to unequal growth and limited access to opportunities. Additionally, the large-scale nature of these projects often results in ballooning costs and unforeseen delays.

Indian Stock Market

Indices and Valuations

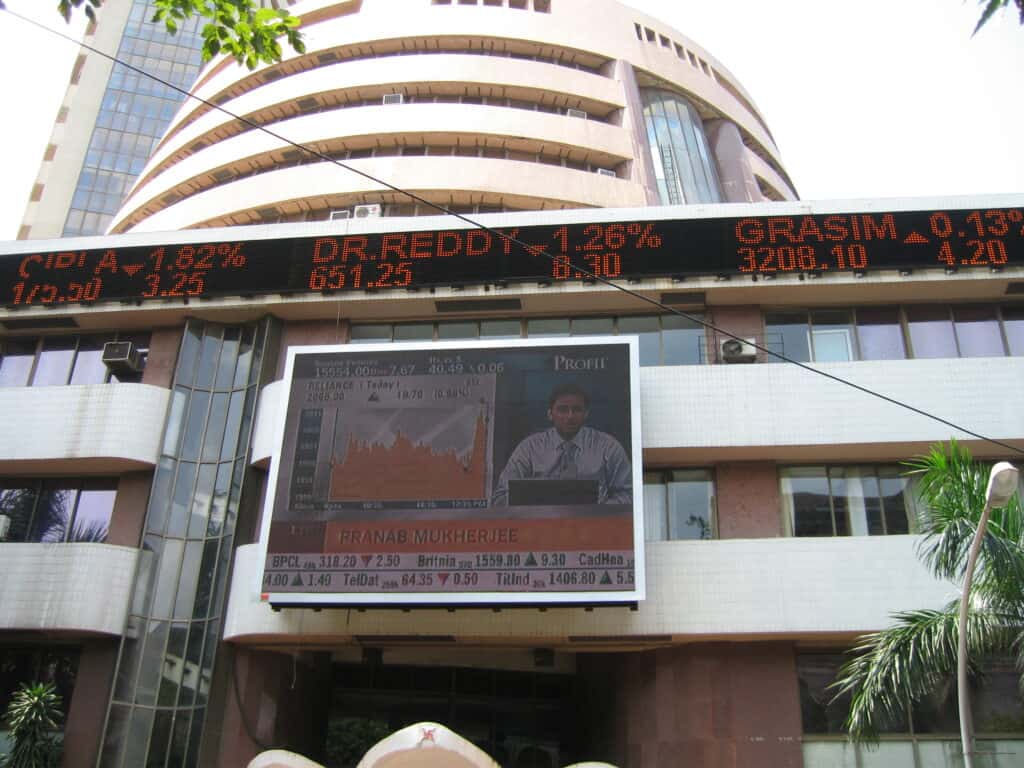
India has indeed been experiencing growth in its stock market, with key indices such as the Nifty and Sensex reflecting this positive trend. Indian equities have generally been a recipient of foreign investor flows. Thanks to a rising population, economic growth, and market-friendly reforms, India is frequently considered a bright spot among emerging markets1.

As investors have warmed to India, market indices have benefited and led to higher valuations for many companies. This growth has attracted various market participants, both individual and institutional, who seek to capitalize on the performance of Indian equities.

Footnotes

  1. India remains a bright spot among emerging markets

Impact of Covid-19 on India’s Economy

The Covid-19 pandemic had a significant effect on economies worldwide, and India was no exception. As an emerging market, India faced unique challenges during this extraordinary time. In the fourth quarter of the fiscal year 2020, India’s growth rate dropped to 3.1%, which was mainly attributed to the pandemic’s impact on the Indian economy. Despite the tough situation that India faced, the nation’s economy experienced a record rebound.

Foreign Investment in India

India has long attracted foreign direct investment (FDI), as it is considered an emerging market with a lot of potential for growth. The country’s relatively large domestic market and strong economic performance have made it a popular destination for investors worldwide.

Foreign investments have been pouring in through various channels such as exchange-traded funds (ETFs) and direct investments in sectors like coal, media, and civil aviation. In December 2020, India opened its coal mining sector for non-coal companies, allowing them to bid for coal mines, paving the way for more competition and investments in the industry.

Major financial institutions, such as the World Bank and the International Monetary Fund (IMF), have highlighted India’s potential and resilience in the face of global economic challenges. According to the World Bank, India is better positioned than other major emerging economies to navigate global headwinds due to its large domestic market and relatively low exposure to international trade. This makes India less susceptible to external economic shocks, as the local demand can cushion the impact. Economic history suggests that pivoting from an export-centric economy to one with more domestic consumption is critical to a nation’s economic development.

Technology and Environmental Factors

Digital Transformation

India is experiencing a rapid digital transformation, thanks to an increasing number of internet subscribers and the widespread availability of smartphones and high-speed connectivity. By September 2018, the country had over 560 million internet subscribers, making it the second-largest market for digital consumers. This trend is expected to continue through 2023 and beyond, providing a solid foundation for the growth of technology-driven industries and services. With a strong focus on digitization, India is making great strides in areas such as e-commerce, digital payments, online education, and telemedicine.

Embracing Green Energy

India is not only focused on technological advancements but also making conscious efforts to reduce its carbon emissions and embrace green energy solutions. Recognizing the environmental challenges and climate change impacts, the country aims to achieve a sustainable and inclusive future. India is aggressively working towards expanding its renewable energy capacities to reduce its dependence on fossil fuels and minimize emission levels. By 2030, the country plans to attain 40% of its energy from non-fossil fuel sources, thus actively contributing to global climate goals. The World Economic Forum has identified India as a key player in promoting green energy initiatives in comparison to other countries, such as Latin America and Africa. It may not all be altruistic though, as India is an energy importer and generating more energy at home will lower import costs.

Conclusion

India is firmly in the emerging market camp today, but who knows what the future holds as it is expected to be one of the top three economic powers in the world over the next 10-15 years. The growth forecast for India looks promising. The country’s economic security policy has evolved as India, Vietnam, and Indonesia seek to strike a balance between supply chain resilience and the risks posed by China. This approach allows India to harness the opportunities of global economic integration while safeguarding against potential threats. However, as the nation advances economically and becomes the third-largest consumer market by 2030, new challenges are expected to develop. Issues such as obesity, non-communicable diseases, and pollution will need to be addressed to ensure the well-being of India’s population. In short, India’s prospects are bright with positive growth forecasts and an increasing global presence. However, the nation must also navigate the challenges that come with rapid economic expansion, finding ways to foster development while ensuring a healthy and sustainable future for its citizens.

Frequently Asked Questions

Scroll to Top