MOIC vs IRR
IRR and MOIC are two popular performance metrics, especially within “alternative” investment asset classes such as real estate, private equity, and venture capital (where time-weighted returns are essentially meaningless). Both IRR and MOIC are important metrics, but neither should be used in isolation when comparing a fund’s performance; investors should always evaluate both within the context of the other (as well as expenses, since MOIC and IRR are often quoted on a gross basis).
IRR
IRR Definition
IRR stands for Internal Rate of Return. IRR is the discount rate one would need to use so that the net present value (NPV) of all future cash flows is zero. In other words, one would look at all the contributions into and distributions from an investment and then find the rate that discounts the sum to zero. IRR is not a perfect way to calculate returns, but it is one of the better metrics for many real estate, private equity, and venture capital assets (among others). IRR can be quoted on a gross or net of fees basis.
IRR Formula
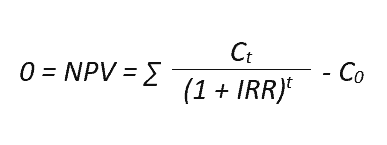
Mathematically, IRR is variable than enables the sum of the NPV of cashflows to equal zero. The bad news is that the equation below is the formula used to derive IRR. The good news is that many calculators, Microsoft Excel, and Google Sheets can calculate IRR.
IRR Example & IRR Calculation
The IRR calculation is complex, but a calculator can do it relatively quickly. If I’m in rush or want to get a ballpark estimate, I’ll simply google “IRR calculator.” Microsoft Excel and Google Sheets also have IRR (if periodic cashflows) and XIRR (if non-periodic cashflows) functions.
Using an online calculator, Excel, or Sheets, we can input the below hypothetical cash flows and determine that the IRR is 42%.
| Initial Investment | $100,000 |
| Year 1 Cash Flow | $125,000 |
| Year 2 Cash Flow | $10,000 |
| Year 3 Cash Flow (final distribution) | $20,000 |
| IRR | 42% |
IRR: Pros & Cons
Pros of IRR
- One the primary reasons that IRR is the default performance reporting metric for alternative investments is that it accounts for varying amounts of capital. Many alternative investments are funded over time and distributions are also made over time.
- IRR accounts for the time value of money, unlike MOIC which does not account for time at all.
- IRR is very sensitive to several factors that (within a fund context) encourage managers to only call capital when it is needed and to return capital to investors relatively quickly. As we will see later, this can also be a negative.
Cons of IRR
Despite the above pros, IRR is not necessarily sufficient to evaluate investment performance for a few reasons.
- As illustrated in our example and mentioned in the “pros” section above, IRR is sensitive to early cash flows and small (often inconsequential) distributions early on can elevate IRR for years.
- IRR calculations begin when capital is put to work. However, it does not account for the opportunity cost of uncalled capital. Uncalled capital is often generating low(er) returns since it needs to be relatively liquid.
- On the flip side, IRR does not account for the time after capital is returned to investors. In the above example, capital was returned relatively quickly (which could be a pro or con for the investor, depending on their opportunity set available).
- Lastly, IRR’s are based on cash flows and cash flows can be changed without impacting performance. In other words, IRR can be influenced (or manipulated) relatively easily.
- Subscription lines: Funds have increasingly used “subscription lines” to defer calling investor capital. The leverage allows funds to buy assets and generate returns early on. The funds can then distribute more capital back to investors earlier. Sounds great, except the leverage has a cost and is simply in lieu of called capital (rather than in addition to). This inflates the IRR while often reducing economic returns (due to interest and administrative expenses).
- Leverage & Dividend Recaps: Assume an investor buys a building for $10 million and it generates $2 million of cash flow in the first year. The IRR would be 20%. However, if the investor decides to borrow 90% of the buildings value and pocket the proceeds, the investor has now taken $11 million out of the investment ($2 million of cash flow and $9 million of cash out refinance proceeds). The IRR jumps from 20% to 200% without any difference in economic returns (the investor may actually be worse off, since they now have to pay interest on the loan).
- Performance fees (carry, promote, incentive, etc.) are often based on IRR, even though it is not necessarily representative of actual dollar returns.
- Similar to MOIC, IRR is simply an estimate at any point before all all returns have been realized.
- Since MOIC is generally quoted on a gross basis, gross IRRs can vary wildly from net IRRs. Investors should calculate net IRRs if needed.
MOIC
MOIC Definition
MOIC stands for Multiple On Invested Capital. It expresses returns as a multiple of investment. MOIC is typically quoted on a gross basis (so before expenses such as fees are deducted and taken into account).
MOIC Formula

MOIC Example
Let’s use the above numbers (from our IRR example above) to calculate MOIC. The initial investment is $100,000. The asset generates total proceeds of $155,000 through its life. In this case the MOIC is 1.55x.
MOIC Calculation
In the above example, we get 1.55x by adding $125,000 from Year 1, $10,000 from Year 2, and $20,000 from Year 3 and dividing by $100,000.
MOIC: Pros & Cons
Pros of MOIC
- MOIC is relatively easy to calculate (even in your head) and easily understood intuitively. Thus, a main benefit of MOIC is that conveys the actual dollar return (gross of fees, generally).
- In the above IRR example, the IRR is 42%. So a prospective investor may mistakenly extrapolate that the next (similar) investment will grow to approximately 286,000 over three years (assuming a 42% return compounded annually). However, the investment only grew to $155,000 over three years.
Cons of MOIC
- One of the downsides of MOIC is that it does not account for time value of money. MOICs can grow quite large by just holding assets for a long time, so MOIC must be evaluated within the context of time.
- As an example, is a 3x MOIC or a 4x MOIC better? Nobody can say unless they know what the time periods are. If the 3x MOIC was generated in two years and the 4x MOIC over 8 years, I’d say that the 3x investment was the better one.
- Another weakness of MOIC is that it does not account for varying amounts of capital. It is quite easy to understand if capital is all invested at once. But what if capital is called/invested over time?
- For instance, assume 10% of capital is invested in Year 1 and doubles in value. An additional 10% of capital is invested in Year 2 and then the asset value doubles again. Then 80% of capital is invested in Year 3 and there are no distributions or change in value through Year 5. The MOIC after five years is 1.6x. Is this good or bad return? The returns were great the first two years and terrible during the last three years (when the majority of capital was invested).
- Similar to IRR, MOIC is simply an estimate at any point before all capital has been returned to investors.
- MOIC is generally quoted on a gross basis. Investors should account for fees and expenses in these cases.
- MOIC is often a performance metric for individual fund assets, which can differ quite a bit from fund-level performance. For fund-level performance, investors may want to consider using TVPI rather than MOIC.
MOIC vs IRR
Similarities
MOIC and IRR are different but do have some similarities:
- Are preferable to time-weighted return (TWR) in many scenarios.
- Widely used in the (alternative) investment industry.
Differences
As readers can glean from the above, there are some important differences between MOIC and IRR:
- IRR represents the time value of money, but MOIC represents the multiple of money.
- IRR is relatively sensitive to inputs (and easier to engineer/manipulate); it is more difficult to do this with MOIC.
- IRRs are generally higher early in an investment’s life; MOIC is generally higher later in an investment’s life.
- MOIC is generally quoted on a gross basis, while IRR is quoted on a gross or net basis.
Using MOIC and IRR Together
Both MOIC and IRR have strengths and weaknesses, but neither should be used in isolation. Unfortunately, many investment managers and funds often advertise IRR or MOIC but not both. Investors wanting to understand performance should be evaluating both MOIC and IRR within the context of expenses and other factors such as leverage, pacing, etc.
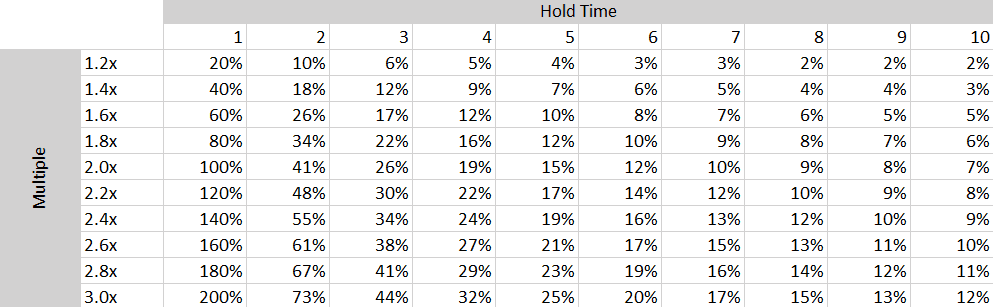
IRR MOIC Table
One resource that may be helpful is the below IRR MOIC table, which models the relationship between IRRs, multiples (such as MOIC), and hold time. Of course, each investment is unique with caveats and there is no standard MOIC to IRR formula or calculator (since the inputs can vary quite a bit especially for IRR). In the absence of a IRR to MOIC conversion formula, the below MOIC IRR table is a great resource (although it may or may not hold in each case depending on an investment’s details).
As an investor, one of the first things I do when evaluating a fund’s pitch or performance is to ensure that I have IRR and MOIC data as well as an understanding of the size/pacing of capital calls and distributions. If this information is not provided initially, I will ask for it and most managers can provide it relatively quickly. But I will not make an investment without looking at and understanding both IRR and MOIC.