FSKAX vs VTI

The Fidelity Total Stock Market Index fund (FSKAX) and the Vanguard Total Stock Market ETF (VTI) are two of the largest “total market” index funds in existence and easily two of the most popular among individual investors. VTI and FSKAX are the core of many investor portfolios and many investors compare FSKAX vs VTI in order to decide which should be the foundation of their portfolio.

A quick reminder that this site does NOT provide investment recommendations. Fund comparisons (such as this one) are not conducted to identify the “best” fund (since that will vary from investor to investor based on investor-specific factors). Rather, these fund comparison posts are designed to identify and distinguish between the fund details that matter versus the ones that don’t.

The Short Answer

There are very few differences between the two funds. In my view, the largest difference is that FSKAX is a mutual fund and VTI is an ETF. This difference in structure leads to differences in taxes, tradability, etc.

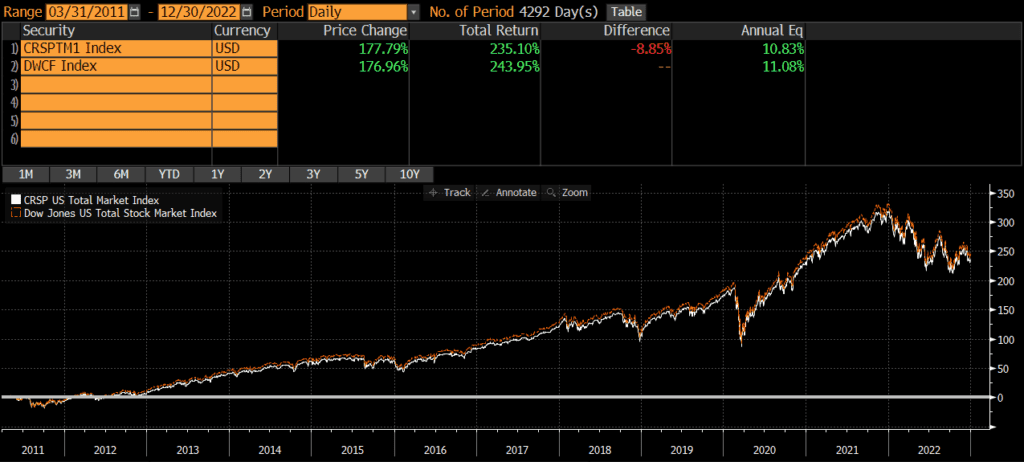
The underlying benchmark indices that these funds track are technically different (CRSP US Total Market vs Dow Jones US Total Market), but they are identical is most respects. Consequently, the risk and return of these funds is nearly identical and I consider these two funds equivalent and interchangeable.

The Longer Answer

These two funds are incredibly similar and leads some to question: is VTI the same as FSKAX?

Technically, VTI is a different fund with a different structure than FSKAX. But for many intents and purposes, VTI and FSKAX are identical. Both funds are broad-based indices that represent the US equity markets.

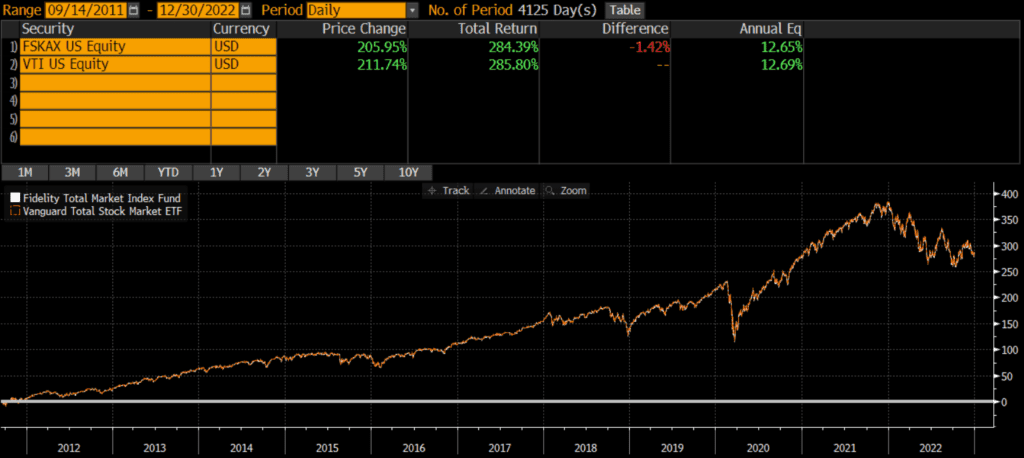
Historical Performance: FSKAX vs VTI

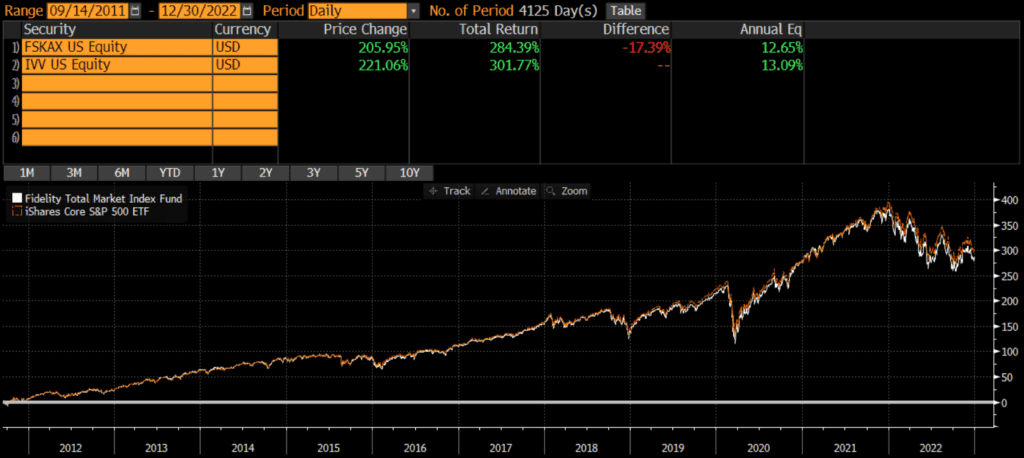
VTI was launched in 2001, while FSKAX was launched on September 7, 2011 (although other share classes of the Fidelity fund existed prior to this date). Since that time, the two funds have had identical performance: 12.65% vs 12.69% on an annualized basis. Over those 11 years, the cumulative performance differential has been less than 1.5%!

Differences Between FSKAX and VTI

Geography

Both the VTI and FSKAX only include stocks of US-domiciled companies.

Market Capitalization

The two funds have a similar number of holdings (as of 11/30/2022); VTI holds 4,026 stocks versus FSKAX’s 3,989 stocks. Perhaps not surprisingly, the market cap weighting of the funds are identical.

VTIFSKAX
Large Cap73%73%
Mid Cap19%19%
Small Cap9%9%
Source: ThoughtfulFinance.com, Morningstar.com (as of 11/30/2022)

Sector Weights

The sector weights of each fund are nearly identical, with many sector weights within .05% of each other!

VTIFSKAX
Basic Materials2.65%2.66%
Consumer Cyclical10.35%10.43%
Financial Services13.90%14.04%
Real Estate3.48%3.46%
Communication Services6.89%6.91%
Energy5.09%5.13%
Industrials9.80%9.58%
Technology23.04%23.18%
Consumer Defensive6.80%6.77%
Healthcare15.09%14.97%
Utilities2.91%2.87%
Source: ThoughtfulFinance.com, Morningstar.com (as of 11/30/2022)

Factors to Consider

Expenses

Some investors may point out that the expense ratios between FSKAX and VTI differ. This is true, but it is also reflected in the net performance chart above. At a certain level, differences in expense ratios do not matter. A small absolute difference (in basis points) is essentially meaningless (even if it appears large on a percentage basis). Since these portfolios are essentially identical, I would most likely lean towards VTI.

Transaction Costs

ETFs are free to trade at many brokers and custodians, although many still charge commissions and/or transaction fees to buy/sell mutual funds. To my knowledge, Fidelity does not participate in the pay-to-play arrangements that would allow their mutual funds to trade for free on many platforms. So if an investor account is at Fidelity, it is free to trade FSKAX or VTI. However, only VTI is free to trade in non-Fidelity accounts.

There is a bid-ask spread when trading ETFs, but this spread is typically less than .01% for VTI and individual investor trades will not generally be large enough to “move” the market. In the case of VTI, individual investors should not have a problem trading.

Tax Efficiency & Capital Gain Distributions

ETFs are typically more tax-efficient than mutual funds, due to their ability to avoid realizing capital gains through like-kind redemptions (a process that is beyond the scope of this post).

FSKAX routinely makes capital gains distributions, while VTI does not make capital gains distributions nor do I expect it to (since it is an ETF). FSKAX is relatively tax-efficient since it is an index fund, but VTI is even more tax-efficient.

Tax Loss Harvesting

My personal preference is to keep a portfolio entirely mutual funds or entirely ETFs, due to the mechanics of settlement during tax loss harvesting. If an ETF has declined in value and an investor sells it, the trade and cash proceeds will not settle for two business days (T+2). That investor may want to “replace” the sold ETF immediately and attempt to buy another ETF or mutual fund simultaneously.

However, mutual funds settle on T+1 basis, so cash for the mutual purchase would be due in one business day (which is one day earlier than the cash from the ETF sale is received). This can obviously cause problems and (even though this issue can be addressed with careful planning) I find it easier to keep accounts invested in similar vehicles. In this case, if a portfolio is all mutual funds, I might lean more towards FSKAX. If all ETFs, I might lean more towards VTI.

Investors looking for a mutual fund version of VTI may consider VTI’s mutual fund share class (VTSAX) and should read our comparison of FSKAX vs VTSAX.

Final Thoughts on FSKAX & VTI

Except for the fact that FSKAX is a mutual fund and VTI and ETF, these two funds are nearly identical. Personally, I would not spend too much time trying to divine which is “better” and would just choose whichever makes more sense for my portfolio based on the above factors.

CRSP US Total Market Index vs Dow Jones US Total Stock Market Index

The CRSP US Total Market Index and the Dow Jones US Total Stock Market Index are two of the most popular indices of US stocks. Many portfolios and investment vehicles are benchmarked to each index as both are representative of the US stock market.

The CRSP US Total Market Index and the Dow Jones US Total Stock Market Index are nearly identical in every way with very slight differences. The below performance chart of the CRSP US Total Market and the Dow Jones US Total Stock Market indices illustrates that the Dow Jones US Total Stock Market Index has outperformed the CRSP US Total Market Index since its inception. However, returns over the past 11 years have been nearly identical. This is extremely similar to the findings in my analysis of the Russell 1000 vs S&P 500 and MSCI USA Index vs the S&P 500 Index.

A quick note that investors cannot invest directly in an index. These unmanaged indexes do not reflect management fees and transaction costs that are associated with an investable vehicle, such as the Fidelity Total Market Index Fund (symbol: FSKAX) or the Vanguard Total Stock Market Index Fund ETF (symbol: VTI). A reminder that these are simply examples as this site does NOT provide investment recommendations.

Historical Performance: CRSP US Total Market Index vs Dow Jones US Total Stock Market Index

The Dow Jones US Total Stock Market Index was launched way back in 1987, while the CRSP US Total Market Index was launched nearly 25 years later on March 31, 2011. Since that time, the Dow Jones index has outperformed the CRSP index by .25% per year (11.08% vs 10.83%, respectively). The cumulative performance differential over that time period has been less than 9%.

Composition Differences: CRSP vs Dow Jones (US Total Stock Market Indices)

Both the CRSP US Total Market Index and the Dow Jones US Total Stock Market Index are broad-based indices that represent the US equity markets. As of 12/31/2022, the indices have identical geographic exposures, similar sector weights, and slightly different market cap exposures.

Geography

Both the CRSP US Total Market and the Dow Jones US Total Stock Market indices only include the stocks of US-domiciled companies.

Market Capitalization

The two indices have a similar number of constituent stocks (as of 9/30/2022); the CRSP US Total Stock Market Index has 4,027 constituents versus the Dow Jones US Total Stock Market’s 4,273 constituents. Using the Vanguard Total Stock Market Index Fund (which tracks the CRSP benchmark) and the Fidelity Total Stock Market Index Fund (which tracks the Dow Jones index) as proxies, we can infer the below market cap weights of each index. Perhaps not surprisingly, the weights are identical!

CRSP US Total Stock Market IndexDow Jones US Total Stock Market Index
Large Cap73%73%
Mid Cap19%19%
Small Cap9%9%
Source: ThoughtfulFinance.com, Morningstar.com (as of 11/30/2022)

Sector Weights

Again, using VTSAX and FSKAX as proxies, we can infer the index weights are approximately identical. Many sector weights are within .05% of each other!

CRSP US Total Stock Market IndexDow Jones US Total Stock Market Index
Basic Materials2.65%2.66%
Consumer Cyclical10.35%10.43%
Financial Services13.90%14.04%
Real Estate3.48%3.46%
Communication Services6.89%6.91%
Energy5.09%5.13%
Industrials9.80%9.58%
Technology23.04%23.18%
Consumer Defensive6.80%6.77%
Healthcare15.09%14.97%
Utilities2.91%2.87%
Source: ThoughtfulFinance.com, Morningstar.com (as of 11/30/2022)

Final Thoughts on CRSP vs Dow Jones (US Total Stock Market Indices)

Investors cannot invest in indices directly and should do their own research before deciding to invest in a fund that tracks either index. That being said, these two indices appear nearly identical in terms of geographic, market cap, and sector exposure. For all intents and purposes, I would argue that these two benchmarks are interchangeable, despite the small historical performance difference.

With such a small performance difference though, the costs of investable index strategies may be a larger consideration than which benchmark to select. Sometimes benchmark selection matters quite a bit, although that does not appear to be the case between these two indices.

FSKAX vs FXAIX

The Fidelity S&P 500 Index mutual fund (FXAIX) and the Fidelity Total Stock Market Index fund (FSKAX) are two of the largest mutual funds in existence. FXAIX and FSKAX are the core of many investor portfolios. Many investors compare FXAIX vs FSKAX in order to decide which should be the foundation of their portfolio.

A quick reminder that this site does NOT provide investment recommendations. Fund comparisons (such as this one) are not conducted to identify the “best” fund (since that will vary from investor to investor based on investor-specific factors). Rather, these fund comparison posts are designed to identify and distinguish between the fund details that matter versus the ones that don’t.

The Short Answer

The main difference between FXAIX and FSKAX is that FXAIX is a large- and mid-cap fund, while FSKAX is a total market fund. Despite these differences, the total return between these two funds is pretty close.

The Long Answer

Historical Performance: FXAIX vs FSKAX

FXAIX was launched back in 1988, while FSKAX was launched on September 8, 2011 (although other shares classes of the fund existed prior to that). Since then, FXAIX has outperformed by about a half percent annually. This is not a huge performance differential, but it does compound over time. The cumulative difference between the two funds since common inception is approximately 18%.

Of course, the outperformance of FXAIX is reflective of large-cap stocks’ dominance over the past decade. If mid-caps and/or small-caps lead, then I suspect FSKAX would outperform.

Differences between FXAIX vs FSKAX

The biggest difference between FXAIX and FSKAX is the market cap exposure of the funds. FXAIX tracks the S&P 500 index which includes mostly large-caps and some mid-caps, while FSKAX covers much more of the market by including more mid-caps and small-caps.

Geographic Exposure

Both FXAIX and FSKAX hold essentially 100% stocks, so I will not dig into country exposures or market classification here. For intents and purposes, the two funds have identical exposures.

Market Cap Exposure

FXAIX focuses on the S&P 500 index and so it mostly holds large-caps with a bit of mid-cap exposure. FSKAX tracks the broader Dow Jones U.S. Total Stock Market Index and so it owns many more mid-caps and small-caps (as of 11/30/2022). In other words, FXAIX is a large-cap vehicle, while FSKAX is a total market vehicle. That being said, due to market cap weighting, both funds are overwhelmingly influenced by the large-cap holdings.

FXAIXFSKAX
Large-Cap83%73%
Mid-Cap16%19%
Small-Cap0%9%
Source: ThoughtfulFinance.com, Morningstar

Sector Weights

The sector weights between FXAIX and FSKAX are nearly identical, as of 11/30/2022. The weights are within 1% for every single sector.

FXAIXFSKAX
Basic Materials2.40%2.68%
Consumer Cyclical10.16%10.43%
Financial Services13.80%14.04%
Real Estate2.77%3.46%
Communication Services7.46%6.91%
Energy5.12%5.13%
Industrials8.86%9.58%
Technology23.72%23.18%
Consumer Defensive7.40%6.77%
Healthcare15.31%14.97%
Utilities2.99%2.87%
Source: ThoughtfulFinance.com, Morningstar

Transaction Costs

Many brokers and custodians still charge commissions and/or transaction fees to buy/sell mutual funds. To my knowledge, Fidelity does not participate in the pay-to-play arrangements (with their competitor custodians) that would allow their mutual funds to trade for free on many platforms. So if an investor account is at Fidelity, it is generally free to trade FXAIX; other custodians will likely charge a fee to trade Fidelity mutual funds.

It is worth noting that neither fund has a minimum for initial or additional investments. That being said, investors looking for free trades may want to consider an a total market ETF or large-cap ETF, rather than FSKAX or FXAIX.

Expenses

The expense ratio for both funds is both the same and extremely low (.015%).

Tax Efficiency & Capital Gain Distributions

Both funds have made capital gains distributions in the past and will likely make them in the future. It is not possible to say which one will be more tax-efficient in the future. As index funds, the tax drag on both funds is very low. However, tax-sensitive taxable investors may want to consider using an ETF in lieu of either of these funds.

Final Thoughts: FXAIX vs FSKAX

Both FXAIX and FSKAX are large, core funds sponsored and managed by one of the largest asset managers in the world (Fidelity). Beyond market cap exposures, the funds appear and act very similar. Long-term performance has been nearly identical. I view these two funds as essentially interchangeable and would not spend too much energy splitting hairs to decide which one is “better.” Overall, these two funds are very similar and I wouldn’t worry too much about picking the “right” one.

FSKAX vs IVV

iShares Core S&P 500 ETF (IVV) and the Fidelity Total Stock Market Index fund (FSKAX) are two of the largest S&P 500 index funds in existence and easily two of the most popular among individual investors. IVV and FSKAX are the core of many investor portfolios and many investors compare FSKAX vs IVV in order to decide which should be the foundation of their portfolio.

A quick reminder that this site does NOT provide investment recommendations. Fund comparisons (such as this one) are not conducted to identify the “best” fund (since that will vary from investor to investor based on investor-specific factors). Rather, these fund comparison posts are designed to identify and distinguish between the fund details that matter versus the ones that don’t.

The Short Answer

The main difference between IVV and FSKAX is that IVV is a large- and mid-cap ETF, while FSKAX is a total market mutual fund. Despite these differences, the total return between these two funds is nearly identical and I consider them interchangeable for all intents and purposes.

The Long Answer

Historical Performance: FSKAX vs IVV

IVV was launched on May 15, 2000, while FSKAX was launched on September 9, 2011 (although other shares classes of the fund existed prior to that). Since then IVV has outperformed by nearly a half percent annually. Despite variations in the size factor performance over the decades, the long-term performance between these two funds is incredibly similar. The cumulative difference in performance is only about 17% over the past 11 years.

Of course, the outperformance of IVV is reflective of large-cap stocks’ dominance over the past decade. If mid-caps and/or small-caps lead, then I suspect FSKAX would outperform.

Differences between FSKAX vs IVV

The biggest difference between IVV and FSKAX is the market cap exposure of the funds. IVV tracks the S&P 500 index which includes mostly large-caps and some mid-caps, while FSKAX covers much more of the market by including more mid-caps and small-caps.

Geographic Exposure

Both IVV and FSKAX hold essentially 100% stocks, so I will not dig into country exposures or market classification here. For intents and purposes, the two funds have identical exposures.

Market Cap Exposure

IVV focuses on the S&P 500 index and so it mostly holds large-caps with a bit of mid-cap exposure. FSKAX tracks the broader Dow Jones U.S. Total Stock Market Index and so it owns many more mid-caps and small-caps (data as of 11/30/2022). In other words, IVV is a large-cap vehicle, while FSKAX is a total market vehicle. That being said, due to market cap weighting, both funds are overwhelmingly influenced by the large-cap holdings.

IVVFSKAX
Large-Cap84%73%
Mid-Cap16%19%
Small-Cap0%9%
Source: ThoughtfulFinance.com, Morningstar

Sector Weights

The sector weights between IVV and FSKAX are nearly identical (IVV data as of 1/6/2023, FSKAX data as of 11/30/2022).

IVVFSKAX
Basic Materials2.50%2.68%
Consumer Cyclical9.63%10.43%
Financial Services14.20%14.04%
Real Estate2.82%3.46%
Communication Services7.44%6.91%
Energy5.15%5.13%
Industrials9.11%9.58%
Technology22.62%23.18%
Consumer Defensive7.65%6.77%
Healthcare15.71%14.97%
Utilities3.16%2.87%
Source: ThoughtfulFinance.com, Morningstar

Factors To Consider

Transaction Costs

ETFs are free to trade at many brokers and custodians, including Fidelity. However, many brokers and custodians still charge commissions and/or transaction fees to buy/sell mutual funds. To my knowledge, Fidelity does not participate in the pay-to-play arrangements that would allow their mutual funds to trade for free on many platforms. So if an investor account is at Fidelity, it is free to trade FSKAX or IVV. However, only IVV is free to trade in non-Fidelity accounts.

There is a bid-ask spread when trading ETFs, but this spread is typically less than .01% for IVV and individual investor trades will not generally be large enough to “move” the market. In the case of IVV, individual investors should not have a problem trading.

Tax Efficiency

ETFs are typically more tax-efficient than mutual funds, due to their ability to avoid realizing capital gains through like-kind redemptions (a process that is beyond the scope of this post).

FSKAX does make capital gain distributions, while IVV has not made a capital gains distribution since 2000. IVV is the more tax-efficient option in this case.

Tax Loss Harvesting

My personal preference is to keep a portfolio entirely mutual funds or entirely ETFs, due to the mechanics of settlement during tax loss harvesting. If an ETF has declined in value and an investor sells it, the trade and cash proceeds will not settle for two business days (T+2). That investor may want to “replace” the sold ETF immediately and attempt to buy another ETF or mutual fund simultaneously.

However, mutual funds settle on T+1 basis, so cash for the mutual purchase would be due in one business day (which is one day earlier than the cash from the ETF sale is received). This can obviously cause problems and (even though this issue can be addressed with careful planning) I find it easier to keep accounts invested in similar vehicles. In this case, if a portfolio is all mutual funds, I might lean more towards FSKAX. If all ETFs, I might lean more towards IVV.

Tradability

FSKAX does not have a minimum for initial or additional purchases. The minimum purchase size for IVV is typically one share, although fractional shares are becoming more common.

Investors can trade ETFs intraday, as well as in the pre-market and after-hours trading sessions. Investors can only buy/sell mutual funds once per day. This is not necessarily a major factor for long-term investors however.

Final Thoughts: FSKAX vs IVV

Both IVV and FSKAX are large, core funds sponsored and managed by Blackrock/iShares and Fidelity respectively. Although IVV is more of a large-cap ETF and FSKAX is a total market mutual fund, performance has been pretty close. I view these two funds as essentially interchangeable and would not spend too much energy trying to decide which one is “better.” However, there are some situations that may call for one fund versus another.

FSKAX vs VOO

Vanguard’s S&P 500 ETF (VOO) and the Fidelity Total Stock Market Index fund (FSKAX) are two of the largest funds in existence and easily two of the most popular among individual investors. VOO and FSKAX are the core of many investor portfolios and many investors compare FSKAX vs VOO in order to decide which should be the foundation of their portfolio.

A quick reminder that this site does NOT provide investment recommendations. Fund comparisons (such as this one) are not conducted to identify the “best” fund (since that will vary from investor to investor based on investor-specific factors). Rather, these fund comparison posts are designed to identify and distinguish between the fund details that matter versus the ones that don’t.

The Short Answer

The main difference between VOO and FSKAX is that VOO is a large- and mid-cap ETF, while FSKAX is a total market mutual fund. Despite these differences, the total return between these two funds is nearly identical and I consider them interchangeable for all intents and purposes.

The Long Answer

Historical Performance: FSKAX vs VOO

VOO was launched on September 7, 2010, while FSKAX was launched a year later on September 9, 2011 (although other shares classes of the fund existed prior to that). Since then VOO has outperformed by just over a half percent annually. Despite variations in the size factor performance over the decades, the long-term performance between these two funds is incredibly similar. The cumulative difference in performance is only about 17% over the past 11 years.

Of course, the outperformance of VOO is reflective of large-cap stocks’ dominance over the past decade. If mid-caps and/or small-caps lead, then I suspect FSKAX would outperform.

Differences between FSKAX vs VOO

The biggest difference between VOO and FSKAX is the market cap exposure of the funds. VOO tracks the S&P 500 index which includes mostly large-caps and some mid-caps, while FSKAX covers much more of the market by including more mid-caps and small-caps.

Geographic Exposure

Both VOO and FSKAX hold essentially 100% stocks, so I will not dig into country exposures or market classification here. For intents and purposes, the two funds have identical exposures.

Market Cap Exposure

VOO focuses on the S&P 500 index and so it mostly holds large-caps with a bit of mid-cap exposure. FSKAX tracks the broader Dow Jones U.S. Total Stock Market Index and so it owns many more mid-caps and small-caps (VOO data as of 1/6/2023, FSKAX data as of 11/30/2022). In other words, VOO is a large-cap vehicle, while FSKAX is a total market vehicle. That being said, due to market cap weighting, both funds are overwhelmingly influenced by the large-cap holdings.

VOOFSKAX
Large-Cap83%73%
Mid-Cap16%19%
Small-Cap0%9%
Source: ThoughtfulFinance.com, Morningstar

Sector Weights

The sector weights between VOO and FSKAX are nearly identical (VOO data as of 1/6/2023, FSKAX data as of 11/30/2022).

VOOFSKAX
Basic Materials2.40%2.68%
Consumer Cyclical10.17%10.43%
Financial Services13.75%14.04%
Real Estate2.76%3.46%
Communication Services7.46%6.91%
Energy5.13%5.13%
Industrials8.86%9.58%
Technology23.74%23.18%
Consumer Defensive7.40%6.77%
Healthcare15.32%14.97%
Utilities3.00%2.87%
Source: ThoughtfulFinance.com, Morningstar

Factors To Consider

Transaction Costs

ETFs are free to trade at many brokers and custodians, including Fidelity. However, many brokers and custodians still charge commissions and/or transaction fees to buy/sell mutual funds. To my knowledge, Fidelity does not participate in the pay-to-play arrangements that would allow their mutual funds to trade for free on many platforms. So if an investor account is at Fidelity, it is free to trade FSKAX or VOO. However, only VOO is free to trade in non-Fidelity accounts.

There is a bid-ask spread when trading ETFs, but this spread is typically less than .01% for VOO and individual investor trades will not generally be large enough to “move” the market. In the case of VOO, individual investors should not have a problem trading.

Tax Efficiency

ETFs are typically more tax-efficient than mutual funds, due to their ability to avoid realizing capital gains through like-kind redemptions (a process that is beyond the scope of this post).

FSKAX does make capital gain distributions, while VOO has never made a capital gain distribution. VOO is the more tax-efficient option in this case.

Tax Loss Harvesting

My personal preference is to keep a portfolio entirely mutual funds or entirely ETFs, due to the mechanics of settlement during tax loss harvesting. If an ETF has declined in value and an investor sells it, the trade and cash proceeds will not settle for two business days (T+2). That investor may want to “replace” the sold ETF immediately and attempt to buy another ETF or mutual fund simultaneously.

However, mutual funds settle on T+1 basis, so cash for the mutual purchase would be due in one business day (which is one day earlier than the cash from the ETF sale is received). This can obviously cause problems and (even though this issue can be addressed with careful planning) I find it easier to keep accounts invested in similar vehicles. In this case, if a portfolio is all mutual funds, I might lean more towards FSKAX. If all ETFs, I might lean more towards VOO.

Tradability

FSKAX does not have a minimum for initial or additional purchases. The minimum purchase size for VOO is typically one share, although fractional shares are becoming more common.

Investors can trade ETFs intraday, as well as in the pre-market and after-hours trading sessions. Investors can only buy/sell mutual funds once per day. This is not necessarily a major factor for long-term investors however.

Final Thoughts: FSKAX vs VOO

Both VOO and FSKAX are large, core funds sponsored and managed by Vanguard and Fidelity respectively. Although VOO is more of a large-cap ETF and FSKAX is a total market mutual fund, performance has been pretty close. I view these two funds as essentially interchangeable and would not spend too much energy trying to decide which one is “better.” However, there are some situations that may call for one fund versus another.

FSKAX vs SPY

State Street’s SPDR S&P 500 ETF Trust (SPY) and the Fidelity Total Stock Market Index fund (FSKAX) are two of the largest funds in existence and easily two of the most popular among individual investors. SPY and FSKAX are the core of many investor portfolios and many investors compare FSKAX vs SPY in order to decide which should be the foundation of their portfolio.

A quick reminder that this site does NOT provide investment recommendations. Fund comparisons (such as this one) are not conducted to identify the “best” fund (since that will vary from investor to investor based on investor-specific factors). Rather, these fund comparison posts are designed to identify and distinguish between the fund details that matter versus the ones that don’t.

The Short Answer

The main difference between SPY and FSKAX is that SPY is a large- and mid-cap ETF, while FSKAX is a total market mutual fund. Despite these differences, the total return between these two funds is nearly identical and I consider them interchangeable for all intents and purposes.

The Long Answer

Historical Performance: FSKAX vs SPY

SPY was the first ETF ever launched in the US (January 1993), while FSKAX was launched on September 9, 2011 (although other shares classes of the fund existed prior to that). Since then SPY has outperformed by nearly a half percent annually. Despite variations in the size factor performance over the decades, the long-term performance between these two funds is incredibly similar. The cumulative difference in performance is only about 15% over the past 11 years.

Of course, the outperformance of SPY is reflective of large-cap stocks’ dominance over the past decade. If mid-caps and/or small-caps lead, then I suspect FSKAX would outperform.

Differences between FSKAX vs SPY

The biggest difference between SPY and FSKAX is the market cap exposure of the funds. SPY tracks the S&P 500 index which includes mostly large-caps and some mid-caps, while FSKAX covers much more of the market by including more mid-caps and small-caps.

Geographic Exposure

Both SPY and FSKAX hold essentially 100% stocks, so I will not dig into country exposures or market classification here. For intents and purposes, the two funds have identical exposures.

Market Cap Exposure

SPY focuses on the S&P 500 index and so it mostly holds large-caps with a bit of mid-cap exposure. FSKAX tracks the broader Dow Jones U.S. Total Stock Market Index and so it owns many more mid-caps and small-caps (SPY data as of 1/6/2023, FSKAX data as of 11/30/2022). In other words, SPY is a large-cap vehicle, while FSKAX is a total market vehicle. That being said, due to market cap weighting, both funds are overwhelmingly influenced by the large-cap holdings.

SPYFSKAX
Large-Cap84%73%
Mid-Cap16%19%
Small-Cap0%9%
Source: ThoughtfulFinance.com, Morningstar

Sector Weights

The sector weights between SPY and FSKAX are nearly identical (SPY data as of 1/6/2023, FSKAX data as of 11/30/2022).

SPYFSKAX
Basic Materials2.51%2.68%
Consumer Cyclical9.64%10.43%
Financial Services14.20%14.04%
Real Estate2.81%3.46%
Communication Services7.44%6.91%
Energy5.16%5.13%
Industrials9.11%9.58%
Technology22.62%23.18%
Consumer Defensive7.65%6.77%
Healthcare15.72%14.97%
Utilities3.15%2.87%
Source: ThoughtfulFinance.com, Morningstar

Factors To Consider

Transaction Costs

ETFs are free to trade at many brokers and custodians, including Fidelity. However, many brokers and custodians still charge commissions and/or transaction fees to buy/sell mutual funds. To my knowledge, Fidelity does not participate in the pay-to-play arrangements that would allow their mutual funds to trade for free on many platforms. So if an investor account is at Fidelity, it is free to trade FSKAX or SPY. However, only SPY is free to trade in non-Fidelity accounts.

There is a bid-ask spread when trading ETFs, but this spread is typically less than .01% for SPY and individual investor trades will not generally be large enough to “move” the market. In the case of SPY, individual investors should not have a problem trading.

Tax Efficiency

ETFs are typically more tax-efficient than mutual funds, due to their ability to avoid realizing capital gains through like-kind redemptions (a process that is beyond the scope of this post).

FSKAX does make capital gain distributions, while SPY has not made a capital gain distribution since 1996. SPY is the more tax-efficient option in this case.

Tax Loss Harvesting

My personal preference is to keep a portfolio entirely mutual funds or entirely ETFs, due to the mechanics of settlement during tax loss harvesting. If an ETF has declined in value and an investor sells it, the trade and cash proceeds will not settle for two business days (T+2). That investor may want to “replace” the sold ETF immediately and attempt to buy another ETF or mutual fund simultaneously.

However, mutual funds settle on T+1 basis, so cash for the mutual purchase would be due in one business day (which is one day earlier than the cash from the ETF sale is received). This can obviously cause problems and (even though this issue can be addressed with careful planning) I find it easier to keep accounts invested in similar vehicles. In this case, if a portfolio is all mutual funds, I might lean more towards FSKAX. If all ETFs, I might lean more towards SPY.

Tradability

FSKAX does not have a minimum for initial or additional purchases. The minimum purchase size for SPY is typically one share, although fractional shares are becoming more common.

Investors can trade ETFs intraday, as well as in the pre-market and after-hours trading sessions. Investors can only buy/sell mutual funds once per day. This is not necessarily a major factor for long-term investors however.

Final Thoughts: FSKAX vs SPY

Both SPY and FSKAX are large, core funds sponsored and managed by State Street and Fidelity respectively. Although SPY is more of a large-cap ETF and FSKAX is a total market mutual fund, performance has been pretty close. I view these two funds as essentially interchangeable and would not spend too much energy trying to decide which one is “better.” However, there are some situations that may call for one fund versus another.

FSKAX vs SWPPX

The Schwab S&P 500 Index mutual fund (SWPPX) and the Fidelity Total Stock Market Index fund (FSKAX) are two of the largest mutual funds in existence. SWPPX and FSKAX are the core of many investor portfolios. Many investors compare SWPPX vs FSKAX in order to decide which should be the foundation of their portfolio.

A quick reminder that this site does NOT provide investment recommendations. Fund comparisons (such as this one) are not conducted to identify the “best” fund (since that will vary from investor to investor based on investor-specific factors). Rather, these fund comparison posts are designed to identify and distinguish between the fund details that matter versus the ones that don’t.

The Short Answer

The main difference between SWPPX and FSKAX is that SWPPX is a large- and mid-cap fund, while FSKAX is a total market fund. Despite these differences, the total return between these two funds is pretty close.

The Long Answer

Historical Performance: SWPPX vs FSKAX

SWPPX was launched on May 19, 1997, while FSKAX was launched a year later on September 8, 2011 (although other shares classes of the fund existed prior to that). Since then, SWPPX has outperformed by about a half percent annually. This is not a huge performance differential, but it does compound over time. The cumulative difference between the two funds since common inception is just over 16%.

Of course, the outperformance of SWPPX is reflective of large-cap stocks’ dominance over the past decade. If mid-caps and/or small-caps lead, then I suspect FSKAX would outperform.

Differences between SWPPX vs FSKAX

The biggest difference between SWPPX and FSKAX is the market cap exposure of the funds. SWPPX tracks the S&P 500 index which includes mostly large-caps and some mid-caps, while FSKAX covers much more of the market by including more mid-caps and small-caps.

Geographic Exposure

Both SWPPX and FSKAX hold essentially 100% stocks, so I will not dig into country exposures or market classification here. For intents and purposes, the two funds have identical exposures.

Market Cap Exposure

SWPPX focuses on the S&P 500 index and so it mostly holds large-caps with a bit of mid-cap exposure. FSKAX tracks the broader Dow Jones U.S. Total Stock Market Index and so it owns many more mid-caps and small-caps (as of 11/30/2022). In other words, SWPPX is a large-cap vehicle, while FSKAX is a total market vehicle. That being said, due to market cap weighting, both funds are overwhelmingly influenced by the large-cap holdings.

SWPPXFSKAX
Large-Cap83%73%
Mid-Cap16%19%
Small-Cap0%9%
Source: ThoughtfulFinance.com, Morningstar

Sector Weights

The sector weights between SWPPX and FSKAX are nearly identical, as of 11/30/2022. The weights are within 1% for every single sector.

SWPPXFSKAX
Basic Materials2.40%2.68%
Consumer Cyclical10.16%10.43%
Financial Services13.80%14.04%
Real Estate2.77%3.46%
Communication Services7.46%6.91%
Energy5.12%5.13%
Industrials8.86%9.58%
Technology23.72%23.18%
Consumer Defensive7.40%6.77%
Healthcare15.31%14.97%
Utilities2.99%2.87%
Source: ThoughtfulFinance.com, Morningstar

Transaction Costs

Many brokers and custodians still charge commissions and/or transaction fees to buy/sell mutual funds. To my knowledge, neither Fidelity nor Schwab participates in the pay-to-play arrangements (with their competitor custodians) that would allow their mutual funds to trade for free on many platforms. So if an investor account is at Fidelity, it is generally free to trade FXAIX; similarly, SWPPX is generally free to trade at Schwab.

It is worth noting that neither fund has a minimum for initial or additional investments. That being said, investors looking for free trades may want to consider an a total market ETF or large-cap ETF, rather than FSKAX or SWPPX.

Expenses

Some investors may point out that the expense ratios between FSKAX and SWPPX differ. This is true, but it is also reflected in the net performance chart above. At a certain level, differences in expense ratio do not matter that much. In this case, the difference in expenses is fractions of a hundredth of a percent, so no need to compare or split hairs.

Tax Efficiency & Capital Gain Distributions

Both funds have made capital gains distributions in the past and will likely make them in the future. It is not possible to say which one will be more tax-efficient in the future. As index funds, the tax drag on both funds is very low. However, tax-sensitive taxable investors may want to consider using an ETF in lieu of either of these funds.

Final Thoughts: SWPPX vs FSKAX

Both SWPPX and FSKAX are large, core funds sponsored and managed by some of the largest asset managers in the world (Schwab and Fidelity). Beyond market cap exposures, the funds appear and act very similar. Long-term performance has been nearly identical. I view these two funds as essentially interchangeable and would not spend too much energy splitting hairs to decide which one is “better.”

One consideration that might tip the scales is where the investors’ account is. Unlike ETFs, many mutual funds are still subject to trading fees and/or short-term redemption fees. So if my accounts were at Schwab, I might lean more towards SWPPX. If my accounts were at Fidelity, I might favor FSKAX. But overall, these two funds are very similar and I wouldn’t worry too much about picking the “right” one.

FXAIX vs VFIAX

The Fidelity S&P 500 Index Fund (FXAIX) and the Vanguard S&P 500 Index Fund (VFIAX) are two of the largest S&P 500 index mutual funds in existence and easily two of the most popular among individual investors. Both FXAIX and VFIAX track the well-known S&P 500 index and form the core of many investor portfolios. Many investors compare FXAIX vs VFIAX in order to decide which should be the foundation of their portfolio.

A quick reminder that this site does NOT provide investment recommendations. Fund comparisons (such as this one) are not conducted to identify the “best” fund (since that will vary from investor to investor based on investor-specific factors). Rather, these fund comparison posts are designed to identify and distinguish between the fund details that matter versus the ones that don’t.

The Short Answer

There are not many differences between FXAIX and VFIAX. Therefore, investors should consider factors beyond the underlying portfolios (which are essentially identical) in order to decide which fund is best for them.

The Long Answer

Historical Performance: FXAIX vs VFIAX

FXAIX was launched on February 17, 1988, while VFIAX was launched on November 13, 2000. Since then the two funds have performed identically, with a difference of just .03% annually! The cumulative performance difference between these two funds has been less than 2% (over a two decade timeframe)! Thus, from a performance perspective, I would consider these two funds interchangeable.

Differences between FXAIX vs VFIAX

Both FXAIX and VFIAX track the S&P 500, so I will not delve into differences in geographic exposures, sector weights, or market cap coverage. For all intents and purposes, the portfolios are identical with 504 stocks each. The S&P 500 has more than 500 stocks because of the index constituents have multiple share classes of stock (such as GOOG and GOOGL).

Factors to Consider

Expenses

Some investors may point out that the expense ratios between FXAIX and VFIAX differ. This is true, but it is also reflected in the net performance chart above. At a certain level, differences in expense ratio do not matter that much. In this case, the difference in annualized performance is equal to the difference in expense ratio. Since these funds are identical, I would most likely lean towards VFIAX although getting the allocation is more important than selecting the “right” fund.

Transaction Costs

Many brokers and custodians still charge commissions and/or transaction fees to buy/sell mutual funds. To my knowledge, Fidelity does not participate in the pay-to-play arrangements (with their competitor custodians) that would allow their mutual funds to trade for free on many platforms. So if an investor account is at Fidelity, it is generally free to trade FXAIX.

Similarly, Vanguard does not participate in pay-to-play arrangements, so VFIAX trades are likely to incur a fee at any custodian besides Vanguard.

Investors looking for free trades may want to consider an S&P 500 ETF, such as VOO, SPY, SPLG, or IVV.

Tax Efficiency & Capital Gain Distributions

FXAIX has made capital gains distributions in the past and I would expect this to continue in future. VFIAX has not made a capital gain distribution since 2000 and I do not expect it to in the future due to the way that Vanguard structures its ETFs. Thus, tax-sensitive investors may favor VFIAX or an S&P 500 ETF.

Tax Loss Harvesting

Investors may want to avoid using these two funds as tax loss harvesting substitutes for one another since they could be considered “substantially identical.”

Tradability

FXAIX does not have a stated minimum for purchases, although some brokerages (especially competitors of Fidelity) impose minimums. The minimum purchase size for VFIAX is $3,000, regardless of where it is bought or sold.

Final Thoughts: FXAIX vs VFIAX

Both FXAIX and VFIAX are large, core funds sponsored and managed by Fidelity and Vanguard respectively. Performance has been nearly identical. I view these two funds as essentially interchangeable and would not spend too much energy trying to decide which one is “better.”

However, there are some situations that may call for one fund versus another. So I might select FXAIX or VFIAX solely based on where my account is held and whether I’m investing taxable vs retirement dollars. Despite these considerations, these two funds are very similar for all intents and purposes.

VFINX vs VFIAX

The Vanguard 500 Index Fund (Admiral Shares) (symbol VFIAX) and the Vanguard 500 Index Fund (Investor Shares) (symbol VFINX) are two of the largest and most popular S&P 500 index funds. Some compare VFIAX vs VFINX not realizing that they are just two different share classes of the same portfolio.

A quick reminder that this site does NOT provide investment recommendations. Fund comparisons (such as this one) are not conducted to identify the “best” fund (since that will vary from investor to investor based on investor-specific factors). Rather, these fund comparison posts are designed to identify and distinguish between the fund details that matter versus the ones that don’t.

The Short Answer

VFIAX and VFINX are different share classes of the same portfolio. VFINX is closed to new investors, so it is not possible to buy unless you already own VFINX.

If you already own VFINX and are considering buying more, the decision to buy VFINX or VFIAX depends on investor-specific factors (some of which are listed below). Additionally, Vanguard allows owners of many Investor Shares to convert their shares to Admiral Shares or ETF shares.

If you do not own VFINX, then both VFIAX and VOO (the ETF share class) are options.

The Longer Answer

Vanguard offers multiple shares classes for many funds. The Investor Shares are being phased out and Vanguard is pushing the Admiral Shares and the ETFs now. In other words, VFIAX and VFINX are not two funds pursuing an identical strategy; they are the same fund!

Historical Performance: VFIAX vs VFINX

VFINX was launched back 1976, while VFIAX was launched on November 13, 2000. Since that time, performance has been nearly identical: 6.74 vs 6.85% annually. Despite changes in fees and expenses over the past 22 years, the cumulative difference in performance over that time period is only 9%! Looking at the chart of VFIAX vs VFINX below, it is obvious that they are identical.

Differences Between VFIAX and VFINX

Since the two funds are actually two share classes of the same fund, I will skip the usual comparisons here. The geographic exposures, sector weights, market cap coverage so on is identical because the two funds are shares in the same portfolio. There are some resources on the internet indicating differences, but that is incorrect because they are the same fund!

Factors to Consider

Expenses

Some investors may point out that the expense ratios between Vanguard’s Admiral Shares and Vanguard’s Investor Shares differ. This is true, but it is also reflected in the net performance chart above. At a certain level, differences in expense ratio do not matter that much. In this case, the difference in annualized performance is equal to the difference in expense ratio. Since these funds are identical, I would most likely lean towards VFIAX although getting the allocation is more important than selecting the “right” fund.

Transaction Costs

Neither fund charges purchase or redemption fees, so they should be free to trade at Vanguard. To my knowledge, Vanguard does not participate in the pay-to-play arrangements that would allow their mutual funds to trade for free on many platforms. So if an investor account is at Vanguard, it is free to trade VFIAX or VFINX. However, there will likely be a cost to buy or sell on other platforms.

Investors planning smaller allocations or expecting a lot of transactions may want to consider VOO, the ETF share class of this strategy.

Tax Efficiency & Capital Gain Distributions

ETFs are typically more tax-efficient than mutual funds, due to their ability to avoid realizing capital gains through like-kind redemptions (a process that is beyond the scope of this post). However, since Vanguard ETFs are a share class of their mutual funds, the mutual funds are able to benefit from this feature of the ETF. In other words, both VFIAX and VFINX benefit from VOO’s tax-efficient mechanisms.

Both VFINX and VFIAX made capital gains distributions prior to VFIAX’s launch in 2000, although it has not made a capital gains distributions since then (and VFIAX has never made a cap gains distribution)! In other words, VFINX and VFIAX are equivalent in terms of tax efficiency.

Tax Loss Harvesting

Investors should probably avoid using these two funds as tax loss harvesting substitutes for one another since they would likely be considered “substantially identical.”

Tradability

As mentioned above, VFINX is closed to new investors. So unless you already own VFINX, you may want to consider VFIAX or VOO.

VFIAX does have a stated minimum initial purchase of $3,000, so that may be a factor for some investors looking to initiate a position.

The minimum purchase size for VOO is typically one share, although fractional shares are becoming more common. Investors can trade ETFs intraday, as well as in the pre-market and after-hours trading sessions. Investors can only buy/sell mutual funds once per day. This is not necessarily a major factor for long-term investors however.

Final Thoughts: VFIAX vs VFINX

VFIAX and VFINX are literally the same. However, investors should consider the above factors when deciding which one is best for them (if they are able to buy VFINX at all).

VFINX vs VOO

The Vanguard 500 Index Fund (Investor Shares) (symbol VFINX) and the Vanguard S&P 500 ETF (symbol VOO) are two of the largest and most popular S&P 500 index funds. Some compare VFINX vs VOO not realizing that they are just two different share classes of the same portfolio; you can think of VOO as the VFINX ETF equivalent.

A quick reminder that this site does NOT provide investment recommendations. Fund comparisons (such as this one) are not conducted to identify the “best” fund (since that will vary from investor to investor based on investor-specific factors). Rather, these fund comparison posts are designed to identify and distinguish between the fund details that matter versus the ones that don’t.

The Short Answer

VFINX and VOO are different share classes of the same portfolio, which is made possible by Vanguard’s ETF share class structure. The decision to buy one or the other depends on investor-specific factors (some of which are listed below).

VFINX is closed to new investors, so it is not possible to buy unless you already own VFINX. Those who do not own VFINX already may want to read our review of VFIAX vs VOO (the Admiral and ETF share classes respectively).

If you already own VFINX and are considering buying more, the decision to buy VFINX or VOO depends on investor-specific factors. Additionally, Vanguard allows owners of many Investor Shares to convert their shares to Admiral Shares or ETF shares.

The Longer Answer

Vanguard ETFs are structured as share classes of their mutual funds. This is a patented structure that is scheduled to expire in 2023, so we may see this structure more frequently in the near future. In other words, VFINX and VOO are not two funds pursuing an identical strategy; they are the same fund!

Historical Performance: VFINX vs VOO

VFINX was launched in 1976 and VOO was launched on September 7, 2010. Since that time, performance has been nearly identical: 12.69% vs 12.81% annually. Despite changes in fees and expenses over the past dozen years, the cumulative difference in performance over that time period is only about 6%! Looking at the chart of VFINX vs VOO below, it is obvious that they are identical.

Differences Between VFINX and VOO

Since the two funds are actually two share classes of the same fund, I will skip the usual comparisons here. The geographic exposures, sector weights, market cap coverage so on is identical because the two funds are shares in the same portfolio. There are some resources on the internet indicating differences, but that is incorrect because they are the same fund!

Factors to Consider

Expenses

Some investors may point out that the expense ratios between Vanguard’s Investor Shares and Vanguard’s ETFs differ. This is true, but it is also reflected in the net performance chart above. At a certain level, differences in expense ration do not matter. A small absolute difference (in basis points) is essentially meaningless (even if it appears large on a percentage basis) and is often smaller than the bid-ask spread (see transaction costs below). Since these funds are identical, I would most likely lean towards VOO although getting the allocation is more important than selecting the “right” fund.

Transaction Costs

ETFs are free to trade at many brokers and custodians, including Vanguard. However, many brokers and custodians still charge commissions and/or transaction fees to buy/sell mutual funds. To my knowledge, Vanguard does not participate in the pay-to-play arrangements that would allow their mutual funds to trade for free on many platforms. So if an investor account is at Vanguard, it is free to trade VFINX or VOO. However, only VOO is free to trade in non-Vanguard accounts.

There is a bid-ask spread when trading ETFs, but this spread is typically less than .01% for VOO and individual investor trades will not generally be large enough to “move” the market. In the case of VOO, individual investors should not have a problem trading.

Tax Efficiency & Capital Gain Distributions

ETFs are typically more tax-efficient than mutual funds, due to their ability to avoid realizing capital gains through like-kind redemptions (a process that is beyond the scope of this post). However, since Vanguard ETFs are a share class of their mutual funds, the mutual funds are able to benefit from this feature of the ETF. In other words, VOO is able to extend its tax benefits to VFINX.

VFINX last paid out a capital gain distribution at the end of 1999, the year before VFIAX (the Admiral share class) was launched. VFINX has not paid any capital gain distributions since then. I noticed some posts on the internet saying that VOO is more tax-efficient than VFINX, but this incorrect as VFINX has not paid out a cap gain distribution in 20+ years.

Tax Loss Harvesting

My personal preference is to keep a portfolio entirely mutual funds or entirely ETFs, due to the mechanics of settlement during tax loss harvesting. If an ETF has declined in value and an investor sells it, the trade and cash proceeds will not settle for two business days (T+2). That investor may want to “replace” the sold ETF immediately and attempt to buy another ETF or mutual fund simultaneously.

However, mutual funds settle on T+1 basis, so cash for the mutual purchase would be due in one business day (which is one day earlier than the cash from the ETF sale is received). This can obviously cause problems and (even though this issue can be addressed with careful planning) I find it easier to keep accounts invested in similar vehicles. In this case, if a portfolio is all mutual funds, I might lean more towards VFINX. If all ETFs, I might lean more towards VOO.

On this topic, investors should probably avoid using these two funds as tax loss harvesting substitutes for one another since they would likely be considered “substantially identical.”

Tradability

As mentioned above, VFINX is closed to new investors. So unless you already own VFINX, you may want to consider VFIAX or VOO.

VFIAX has a stated minimum initial purchase of $3,000, so that may be a factor for some investors looking to initiate a position. The minimum purchase size for VOO is typically one share, although fractional shares are becoming more common. Investors can trade ETFs intraday, as well as in the pre-market and after-hours trading sessions. Investors can only buy/sell mutual funds once per day. This is not necessarily a major factor for long-term investors however.

Final Thoughts: VFINX vs VOO

VFINX and VOO are literally the same. However, investors should consider the above factors when deciding which one is best for them.

Scroll to Top