VOOG vs VOO

The Vanguard S&P 500 ETF (VOO) is one of the largest ETFs and is a core holding of many portfolios, while the Vanguard S&P 500 Growth ETF is a popular “factor” ETF. In this context, factors are quantitative characteristics that index providers assign to stocks. In this case, VOOG targets growth stocks (as they are defined by the index provider). Even though VOO and VOOG play different roles in a portfolio, many investors compare the two funds in order to determine whether they should tilt their portfolio towards a factor or to benchmark a factor’s performance.

A quick reminder that this site does NOT provide investment recommendations. Fund comparisons (such as this one) are not conducted to identify the “best” fund (since that will vary from investor to investor based on investor-specific factors). Rather, these fund comparison posts are designed to identify and distinguish between the fund details that matter versus the ones that don’t.

The Short Answer

VOOG essentially owns the subset of VOO’s holdings that are considered growth stocks. VOO owns a more diverse portfolio including growth stocks. Historical performance has been similar, but will depend on how the growth factor performs moving forward.

The Long Answer

Historical Performance: VOOG vs VOO

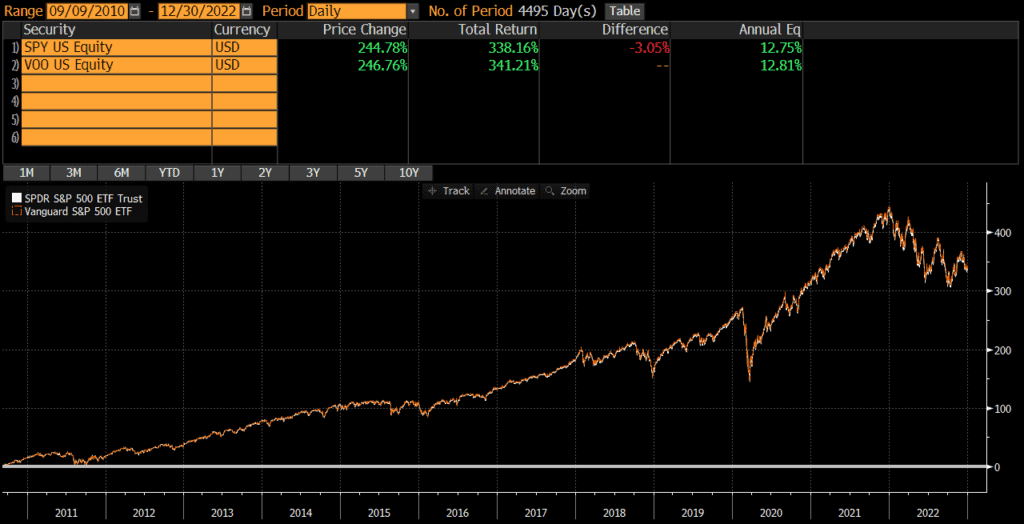
Both VOO and VOOG were launched in September 2010. Since then, performance has been relatively similar with an annualized difference of only .94%. This has compounded over time though and the cumulative performance differential is about 47%.

As the VOOG vs VOO chart shows, the growth factor has really outperformed the broader market since their common inception. However, this did change in 2022 as lines begin to converge again. It is anyone’s guess whether growth or value will perform better in the future.

Differences Between VOOG and VOO

The primary difference between these two funds is that VOOG tracks a growth-oriented index, while VOO tracks a broader index.

Geographic Exposure

Both VOOG and VOO hold essentially 100% US stocks, so I will not dig into country exposures or market classification here. For all intents and purposes, the two funds have identical country exposures.

Market Cap Exposure

Overall, the market cap exposures of VOOG and VOO are relatively similar.

VOOGVOO
Large Cap91%85%
Mid Cap9%16%
Small Cap0%0%
Source: ThoughtfulFinance.com, Morningstar (as of 1/31/2023)

Sector Weights

There are some significant differences in sector weights, which makes sense based on the fact that VOOG is targeting the growth factor and some sectors meet the growth factor criteria more easily.

VOOGVOO
Basic Materials2.42%2.52%
Consumer Cyclical9.87%10.38%
Financial Services7.56%13.99%
Real Estate1.07%2.88%
Communication Services7.00%7.83%
Energy8.22%5.06%
Industrials5.25%8.76%
Technology31.06%23.76%
Consumer Defensive7.19%7.13%
Health Care19.82%14.75%
Utilities0.54%2.94%
Source: ThoughtfulFinance.com, Morningstar (as of 1/31/2023)

Expenses

VOOG’s expense ratio is .10%, while VOO’s expense ratio is .03%. Yes, VOOG is 3x+ more expensive than VOO, but we’re talking about 7 basis points! This in an non-issue in my opinion. Those looking for a lower expense vehicle, may want to consider Vanguard’s Growth ETF VUG (read my comparison of VUG vs VOO or VOOG vs VUG).

Transaction Costs

ETFs are free to trade at many brokers and custodians, so both VOOG and VOO should be free to trade in most cases. Additionally, these funds are among the largest ETFs and are very liquid. The bid-ask spread of both VOOG and VOO is very low, so individual investor trades will not generally be large enough to “move” the market.

Tax Efficiency & Capital Gain Distributions

ETFs are typically more tax-efficient than mutual funds, due to their ability to avoid realizing capital gains through like-kind redemptions (a process that is beyond the scope of this post). Neither VOOG nor VOO has ever made a capital gains distribution (nor do I expect them to moving forward). Thus, these funds are about as tax-efficient as any fund can be and either fund is appropriate in taxable accounts.

Final Thoughts: VOOG vs VOO

Both funds are great ETFs that do what they are designed to do. Generally speaking, I do not think factor ETFs should be the core of a portfolio. For a core position, I would personally choose VOO every time. However, investors looking for a satellite position in order to tilt their portfolio towards growth could do a lot worse than using VOOG. At the end of the day, these two funds are not necessarily comparable because they play very different roles in a portfolio.

Investors interested in evaluating an ETF like VOOG, but with a value tilt should check out our comparison of VOO vs VTV. Readers may also be interested in reading about VOOG vs QQQ.

VTV vs VOO

The Vanguard S&P 500 ETF (VOO) is one of the largest ETFs and is a core holding of many portfolios, while the Vanguard Value ETF is a popular “factor” ETF. In this context, factors are quantitative characteristics that index providers assign to stocks. In this case, VTV targets value stocks (as they are defined by the index provider). Even though VOO and VTV play different roles in a portfolio, many investors compare the two funds in order to determine whether they should tilt their portfolio towards a factor or to benchmark a factor’s performance.

A quick reminder that this site does NOT provide investment recommendations. Fund comparisons (such as this one) are not conducted to identify the “best” fund (since that will vary from investor to investor based on investor-specific factors). Rather, these fund comparison posts are designed to identify and distinguish between the fund details that matter versus the ones that don’t.

The Short Answer

VTV essentially owns the subset of VOO’s holdings that are considered value stocks. VOO owns a more diverse portfolio including growth stocks. Historical performance has been similar, but will depend on how the value factor performs moving forward.

The Long Answer

Historical Performance: VTV vs VOO

VTV was launched in 2004, while VOO was launched in September 2010. Since then, performance has been relatively similar with an annualized difference of only .80%. This has compounded over time though and the cumulative performance differential is about 37%.

As the VTV vs VOO chart shows, the value factor has really lagged the broader market since VOO’s inception. However, this did change in 2022 as lines begin to converge again. It is anyone’s guess whether value or growth will perform better in the future.

Differences Between VTV and VOO

The primary difference between these two funds is that VTV tracks a value-oriented index, while VOO tracks a broader index.

Geographic Exposure

Both VTV and VOO hold essentially 100% US stocks, so I will not dig into country exposures or market classification here. For all intents and purposes, the two funds have identical country exposures.

Market Cap Exposure

Overall, the market cap exposures of VTV and VOO are relatively similar.

VTVVOO
Large Cap79%85%
Mid Cap21%16%
Small Cap0%0%
Source: ThoughtfulFinance.com, Morningstar (as of 1/31/2023)

Sector Weights

There are some significant differences in sector weights, which makes sense based on the fact that VTV is targeting the value factor and some sectors meet the value factor criteria more easily.

VTVVOO
Basic Materials2.92%2.52%
Consumer Cyclical2.51%10.38%
Financial Services20.63%13.99%
Real Estate3.22%2.88%
Communication Services4.44%7.83%
Energy8.18%5.06%
Industrials12.51%8.76%
Technology8.48%23.76%
Consumer Defensive10.93%7.13%
Health Care20.58%14.75%
Utilities5.61%2.94%
Source: ThoughtfulFinance.com, Morningstar (as of 1/31/2023)

Expenses

VTV’s expense ratio is .04%, while VOO’s expense ratio is .03%. Yes, VTV is 25% more expensive than VOO, but we’re talking about 1 basis point! This in an non-issue in my opinion.

Transaction Costs

ETFs are free to trade at many brokers and custodians, so both VTV and VOO should be free to trade in most cases. Additionally, these funds are among the largest ETFs and are very liquid. The bid-ask spread of both VTV and VOO is very low, so individual investor trades will not generally be large enough to “move” the market.

Tax Efficiency & Capital Gain Distributions

ETFs are typically more tax-efficient than mutual funds, due to their ability to avoid realizing capital gains through like-kind redemptions (a process that is beyond the scope of this post). Neither VTV nor VOO has ever made a capital gains distribution (nor do I expect them to moving forward). Thus, these funds are about as tax-efficient as any fund can be and either fund is appropriate in taxable accounts.

Final Thoughts: VTV vs VOO

Both funds are great ETFs that do what they are designed to do. Generally speaking, I do not think factor ETFs should be the core of a portfolio. For a core position, I would personally choose VOO every time. However, investors looking for a satellite position in order to tilt their portfolio towards value could do a lot worse than using VTV. At the end of the day, these two funds are not necessarily comparable because they play very different roles in a portfolio.

Exchange Funds

Not many individual investors are familiar with exchange funds (even though it’s a well-known tool among advisors) and whether they make sense for investors with low-basis stock. Every investor situation is different and there are multiple exchange funds in existence, so the below should not be considered advice or relied upon to make an investment decision. However, I am familiar with exchange funds and can provide some education around the topic.

What is an Exchange Fund?

To start, I should note that an “exchange fund” is not an “exchange-traded fund” (ETF). Exchange funds are private funds and typically organized as a 3(c)7 fund, which means that they are only available to “qualified purchasers.” To qualify as an qualified purchaser, individuals must own at least $5 million of investments (or $25 million if the investor is an entity) (see my post on the topic here). Minimum investments are often set in the $500,000 to $1,000,000 range. Fund purchases and redemptions are typically made “in-kind,” which means that investors contribute shares (instead of cash) to buy the fund and receive shares of stock (instead of cash) to exit the fund.

How Does An Exchange Fund Work?

Exchange funds represent a diversification strategy where an investor can exchange shares of a single stock for shares of the exchange fund. In other words, an investor can exchange an individual stock for a basket of stocks. Investors who stay invested for at least seven years can generally elect to receive a diversified basket of stocks when they redeem from the fund (holding periods of less than seven years are often redeemed with the same stock that was contributed, although the dollar value of the redemption may be less favorable).

Why Would An Investor Use An Exchange Fund?

Assume an investor owns $100 of a stock with a cost basis of $20. Rather than selling the stock, realizing $80 of capital gains, paying tax on the capital gains, and then re-investing the post-tax proceeds, an exchange fund investor could contribute the $100 of stock to the fund and receive $100 of fund shares. Rather than selling stock (and paying tax) in order to raise cash and then diversify, the exchange fund investor is able to diversify without creating a taxable event.

Why Wouldn’t an Investor Use an Exchange Fund?

I should note that exchange funds are not a good solution for every situation. Below are just a few situations where an exchange fund would not make sense:

  • Investors who need cash and/or liquidity should not invest in an exchange fund, as the investor is simply trading one investment for another (with the maximum benefit realized after seven years). Exchange funds are diversification strategy, but cannot help with unlocking liquidity.
  • Although exchange funds represent a way to defer tax, the capital gain remains embedded in the investments. The capital gain and tax liability is “transferred” from the single stock to the exchange fund and possibly to the redemption basket of stocks (if/when the investor exits). Thus, those who want to diversify and defer taxes may find value in an exchange fund. However, the funds do have expenses and costs, so these must be weighed against the benefits of the tax deferral.
  • Lastly, there is the issue of ability to invest. Typically, investors must be “qualified purchasers” and able to deliver at least $500,000 to $1 million of stock. Generally only “large cap” stocks can be contributed and the fund must have capacity for that specific stock.

Exchange funds can be a good solution for investors whose wealth is concentrated in low-basis stock positions. Nonetheless, I encourage investors to work with their advisor, accountant, and attorney in order to determine if an exchange fund is an appropriate strategy.

IVV vs VOO: An Expert’s Opinion

The Vanguard S&P 500 ETF (VOO) and the iShares Core S&P 500 ETF (IVV) are two of the largest S&P 500 ETFs and are sponsored by Vanguard and Blackrock respectively. VOO and IVV are a core holding of many investor portfolios and many investors compare VOO vs IVV in order to decide which should be the foundation of their portfolio.

The Short Answer

VOO and IVV identical in nearly every way and risk/return between these two funds is nearly identical and I consider them interchangeable.

A quick reminder that this site does NOT provide investment recommendations. Fund comparisons (such as this one) are not conducted to identify the “best” fund (since that will vary from investor to investor based on investor-specific factors). Rather, these fund comparison posts are designed to identify and distinguish between the fund details that matter versus the ones that don’t.

The Long Answer

Historical Performance: IVV vs VOO

IVV was launched back in 2000, while IVV was launched a decade later in September 2010. Since then, performance has been identical with VOO outperforming by .02% annually. The cumulative performance differential over the past decade plus is less than 1%!

Differences between IVV vs VOO

These two funds track the same S&P 500 index and so there are almost no differences between the funds.

Geographic Exposure

Both VOO and IVV hold essentially 100% US stocks, so I will not dig into country exposures or market classification here. For all intents and purposes, the two funds have identical exposures.

Market Cap Exposure

Again, I won’t dig into market cap exposures since they are identical for IVV and VOO.

Sector Weights

VOO and IVV sector weights are also identical.

Expenses

Both funds have an expense ratio of .03%, which is extremely low.

Transaction Costs

ETFs are free to trade at many brokers and custodians, so both VOO and IVV should be free to trade in most cases. Additionally, these funds are among the largest ETFs and are very liquid. The bid-ask spread of both VOO and IVV is about .01%, so individual investor trades will not generally be large enough to “move” the market.

Tax Efficiency & Capital Gain Distributions

ETFs are typically more tax-efficient than mutual funds, due to their ability to avoid realizing capital gains through like-kind redemptions (a process that is beyond the scope of this post). VOO has never made a capital gains distribution and IVV has not made a capital gains distribution since 1996 (and I do not expect it to moving forward). Thus, these funds are about as tax-efficient as any fund can be and either fund is appropriate in taxable accounts.

Options Strategies

Neither VOO nor IVV has a great options market, despite their enormous AUM. Investors looking to integrate options strategies into their S&P 500 exposure may want to look at SPY. It is more expensive than VOO or IVV, but it has the most liquid options of any ETF. Those interested should read my reviews of IVV vs SPY or VOO vs SPY.

Final Thoughts: IVV vs VOO

Both VOO and IVV are large, core funds sponsored and managed by two of the largest investment sponsors in the world. I view these two funds as essentially interchangeable and would not spend too much energy splitting hairs to decide which one is “better.” In my opinion, both funds are among the best S&P 500 ETFs out there and investors cannot really go wrong with either.

IVV vs SPY: Review by an expert

The SPDR S&P 500 ETF Trust (SPY) and the iShares Core S&P 500 Index ETF (IVV) are two of the largest S&P 500 ETFs and are sponsored by State Street and Blackrock respectively. SPY and IVV are a core holding of many investor portfolios and many investors compare SPY vs IVV in order to decide which should be the foundation of their portfolio.

The Short Answer

SPY and IVV identical in nearly every way, except SPY is a higher cost vehicle than IVV. Despite these differences, the risk and return between these two funds is nearly identical and I consider them interchangeable.

A quick reminder that this site does NOT provide investment recommendations. Fund comparisons (such as this one) are not conducted to identify the “best” fund (since that will vary from investor to investor based on investor-specific factors). Rather, these fund comparison posts are designed to identify and distinguish between the fund details that matter versus the ones that don’t.

The Long Answer

Historical Performance: IVV vs SPY

SPY was the first ever ETF and launched 1993, while IVV was launched a few years later in September 2000. Since then, performance has been nearly identical with IVV outperforming by .02% annually. The cumulative performance differential over the past decade plus is less than 2%. As the SPY vs IVV chart below indicates, the two funds are identical.

Differences between IVV vs SPY

These two funds track the same S&P 500 index and so there are almost no differences between the funds.

Geographic Exposure

Both SPY and IVV hold essentially 100% US stocks, so I will not dig into country exposures or market classification here. For all intents and purposes, the two funds have identical exposures.

Market Cap Exposure

Again, I won’t dig into market cap exposures since they are identical for IVV and SPY.

Sector Weights

SPY and IVV sector weights are also identical.

Expenses

As the first mover, SPY was able to capture market share early which has led to higher trading volumes and so on. As a result, SPY has been able to charge a premium relative to its competitors (like IVV). SPY’s expense ratio is .0945%, while IVV’s is less than a third of that at .03%. Although SPY is 3x more expensive than IVV, we are only talking about .06% which is immaterial in my opinion.

Transaction Costs

ETFs are free to trade at many brokers and custodians, so both SPY and IVV should be free to trade in most cases. Additionally, these funds are among the largest ETFs and are very liquid. The bid-ask spread of both SPY and IVV is about .01%, so individual investor trades will not generally be large enough to “move” the market.

Tax Efficiency & Capital Gain Distributions

ETFs are typically more tax-efficient than mutual funds, due to their ability to avoid realizing capital gains through like-kind redemptions (a process that is beyond the scope of this post). IVV has never made a capital gains distribution and SPY has not made a capital gains distribution since 1996 (and I do not expect it to moving forward). Thus, these funds are about as tax-efficient as any fund can be and either fund is appropriate in taxable accounts.

Options Strategies

The one situation where I would recommend SPY rather than IVV is if an investor plans to integrate covered calls or other options strategies since SPY options are WAY more liquid than IVV. Or someone might want to use IVV to avoid triggering wash sales with their SPY options. It is just something to keep in mind.

Final Thoughts: IVV vs SPY

Both SPY and IVV are large, core funds sponsored and managed by two of the largest investment sponsors in the world. Although SPY is more expensive than IVV, performance has been extremely similar.

I view these two funds as essentially interchangeable and would not spend too much energy splitting hairs to decide which one is “better.” In my opinion, both funds are among the best ETFs out there and investors cannot really go wrong with either.

VOO vs SPY: Identical, except for very slight differences

The SPDR S&P 500 ETF Trust (SPY) and the Vanguard S&P 500 ETF (VOO) are two of the largest S&P 500 ETFs and are sponsored by State Street and Vanguard respectively. SPY and VOO are a core holding of many investor portfolios and many investors compare SPY vs VOO in order to decide which should be the foundation of their portfolio.

The Short Answer

SPY and VOO identical in nearly every way, except SPY is a higher cost vehicle than VOO. Despite these differences, the risk and return between these two funds is nearly identical and I consider them interchangeable.

A quick reminder that this site does NOT provide investment recommendations. Fund comparisons (such as this one) are not conducted to identify the “best” fund (since that will vary from investor to investor based on investor-specific factors). Rather, these fund comparison posts are designed to identify and distinguish between the fund details that matter versus the ones that don’t.

The Long Answer

Historical Performance: VOO vs SPY

SPY was the first ever ETF and launched 1993, while VOO was launched a year later in September 2010. Since then, performance has been nearly identical with VOO outperforming by .06% annually. The cumulative performance differential over the past decade plus is about 3%.

Differences between VOO vs SPY

These two funds track the same S&P 500 index and so there are almost no differences between the funds.

Geographic Exposure

Both SPY and VOO hold essentially 100% US stocks, so I will not dig into country exposures or market classification here. For all intents and purposes, the two funds have identical exposures.

Market Cap Exposure

Again, I won’t dig into market cap exposures since they are identical for VOO and SPY.

Sector Weights

SPY and VOO sector weights are also identical.

Expenses

As the first mover, SPY was able to capture market share early which has led to higher trading volumes and so on. As a result, SPY has been able to charge a premium relative to its competitors (like VOO). SPY’s expense ratio is .0945%, while VOO’s is less than a third of that at .03%. Although SPY is 3x more expensive than VOO, we are only talking about .06%. Perhaps not surprisingly, this is the amount by which VOO has outperformed SPY on an annualized basis. See above.

Transaction Costs

ETFs are free to trade at many brokers and custodians, so both SPY and VOO should be free to trade in most cases. Additionally, these funds are among the largest ETFs and are very liquid. The bid-ask spread of both SPY and VOO is about .01%, so individual investor trades will not generally be large enough to “move” the market.

Tax Efficiency & Capital Gain Distributions

ETFs are typically more tax-efficient than mutual funds, due to their ability to avoid realizing capital gains through like-kind redemptions (a process that is beyond the scope of this post). VOO has never made a capital gains distribution and SPY has not made a capital gains distribution since 1996 (and I do not expect it to moving forward). Thus, these funds are about as tax-efficient as any fund can be and either fund is appropriate in taxable accounts.

Options Strategies

The one situation where I would recommend SPY rather than VOO is if an investor plans to integrate covered calls or other options strategies since SPY options are WAY more liquid than VOO. Or someone might want to use VOO to avoid triggering wash sales with their SPY options. It is just something to keep in mind.

Final Thoughts: VOO vs SPY

Both SPY and VOO are large, core funds sponsored and managed by two of the largest investment sponsors in the world. Although SPY is more expensive than VOO, performance has been extremely similar.

I view these two funds as essentially interchangeable and would not spend too much energy splitting hairs to decide which one is “better.” In my opinion, both funds are among the best ETFs out there and investors cannot really go wrong with either.

VTI vs SPY: Similar, with one slight difference

The SPDR S&P 500 ETF Trust (SPY) and the Vanguard Total Stock Market ETF (VTI) are two of the largest ETFs and are sponsored by State Street and Vanguard respectively. SPY and VTI are a core holding of many investor portfolios and many investors compare SPY vs VTI in order to decide which should be the foundation of their portfolio.

The Short Answer

The biggest difference is that SPY hold mostly large-cap stocks, while VTI is a “total market fund” and includes more mid-caps and small-caps. Despite these differences, the risk and return between these two funds is nearly identical and I consider them interchangeable.

A quick reminder that this site does NOT provide investment recommendations. Fund comparisons (such as this one) are not conducted to identify the “best” fund (since that will vary from investor to investor based on investor-specific factors). Rather, these fund comparison posts are designed to identify and distinguish between the fund details that matter versus the ones that don’t.

The Long Answer

Historical Performance: VTI vs SPY

SPY was the first ETF ever and was launched back in 1993, while VTI was launched a few years later in May 2000. Since then, VTI has outperformed by .39% annually. That being said, the performance between these two funds is extremely close and shows that modest differences in market cap exposure does not impact total returns that much. The cumulative performance differential over the past two decades is about 36%.

Differences between VTI vs SPY

The biggest difference between SPY and VTI is the market cap exposure of the funds. SPY tracks the S&P 500 index which includes mostly large-caps and some mid-caps. VTI tracks the CRSP US Total Market Index which covers much more of the market by including more mid-caps and small-caps.

Geographic Exposure

Both SPY and VTI hold essentially 100% US stocks, so I will not dig into country exposures or market classification here. For all intents and purposes, the two funds have identical exposures.

Market Cap Exposure

SPY tracks the S&P 500 index and so it mostly holds large-caps with a bit of mid-cap exposure. VTI tracks the broader CRSP US Total Market Index and so it owns many more mid-caps and small-caps. In other words, SPY is a large-cap vehicle and VTI is a total market vehicle. That being said, due to market cap weighting, both funds are overwhelmingly influenced by the large-cap holdings.

SPYVTI
Large-Cap84%73%
Mid-Cap16%19%
Small-Cap0%8%
Source: ThoughtfulFinance.com, Morningstar; data as of 12/31/2022

Sector Weights

The sector weights between SPY and VTI are nearly identical.

SPYVTI
Basic Materials2.51%2.65%
Consumer Cyclical9.64%9.77%
Financial Services14.20%13.93%
Real Estate2.81%3.51%
Communication Services7.44%6.71%
Energy5.16%5.15%
Industrials9.11%10.07%
Technology22.62%22.48%
Consumer Defensive7.65%6.98%
Healthcare15.71%15.69%
Utilities3.15%3.07%
Source: ThoughtfulFinance.com, Morningstar; data as of 12/31/2022

Expenses

The expense ratio for VTI funds is .03%, while SPY’s is .0945%. On the one hand, SPY is 3x more expensive than VTI. One the other hand, its only a 6.5 basis point difference and not material in my opinion. Investors looking for a lower cost S&P 500 ETF may want to consider IVV or VOO. Read my comparison of VOO vs VTI or VTI vs IVV.

Transaction Costs

ETFs are free to trade at many brokers and custodians, so both SPY and VTI should be free to trade in most cases. Additionally, these funds are among the largest ETFs and are very liquid. The bid-ask spread of both SPY and VTI is about .01%, so individual investor trades will not generally be large enough to “move” the market.

Tax Efficiency & Capital Gain Distributions

ETFs are typically more tax-efficient than mutual funds, due to their ability to avoid realizing capital gains through like-kind redemptions (a process that is beyond the scope of this post). VTI has never made a capital gains distribution and SPY has not made a capital gains distribution since 1996 (and I do not expect it to moving forward). Thus, these funds are about as tax-efficient as any fund can be and either fund is appropriate in taxable accounts.

Options Strategies

The one situation where I would recommend SPY rather than VTI is when an investor plans to integrate covered calls or other options strategies since SPY options are WAY more liquid than VTI. Or someone might want to use VTI to avoid triggering wash sales with their SPY options. It is just something to keep in mind.

Final Thoughts: VTI vs SPY

Both SPY and VTI are large, core funds sponsored and managed by two of the largest investment sponsors in the world. Although SPY is more of a large-cap ETF and VTI is a total market ETF, performance has been extremely similar.

I view these two funds as essentially interchangeable and would not spend too much energy splitting hairs to decide which one is “better” (unless one has a clear view on whether larger caps or smaller caps will perform better in the future and even then the difference won’t be much)! In my opinion, both funds are among the best ETFs out there and investors cannot really go wrong with either.

IVV vs VTI: Comparison by an expert

The iShares Core S&P 500 Index ETF (IVV) and the Vanguard Total Stock Market ETF (VTI) are two of the largest ETFs and are sponsored by Blackrock and Vanguard respectively. IVV and VTI are a core holding of many investor portfolios and many investors compare IVV vs VTI in order to decide which should be the foundation of their portfolio.

The Short Answer

The biggest difference is that IVV hold mostly large-cap stocks, while VTI is a “total market fund” and includes more mid-caps and small-caps. Despite these differences, the risk and return between these two funds is nearly identical and I consider them interchangeable.

A quick reminder that this site does NOT provide investment recommendations. Fund comparisons (such as this one) are not conducted to identify the “best” fund (since that will vary from investor to investor based on investor-specific factors). Rather, these fund comparison posts are designed to identify and distinguish between the fund details that matter versus the ones that don’t.

The Long Answer

Historical Performance: VTI vs IVV

IVV was launched in May 2000, while IVV was launched a year later in May 2001. Since then, VTI has outperformed by .35% annually. That being said, the performance between these two funds is extremely close and shows that modest differences in market cap exposure does not impact total returns that much. The cumulative performance differential over the past two decades is about 32%.

Differences between VTI vs IVV

The biggest difference between IVV and VTI is the market cap exposure of the funds. IVV tracks the S&P 500 index which includes mostly large-caps and some mid-caps. VTI tracks the CRSP US Total Market Index which covers much more of the market by including more mid-caps and small-caps.

Geographic Exposure

Both IVV and VTI hold essentially 100% US stocks, so I will not dig into country exposures or market classification here. For all intents and purposes, the two funds have identical exposures.

Market Cap Exposure

IVV tracks the S&P 500 index and so it mostly holds large-caps with a bit of mid-cap exposure. VTI tracks the broader CRSP US Total Market Index and so it owns many more mid-caps and small-caps. In other words, IVV is a large-cap vehicle and VTI is a total market vehicle. That being said, due to market cap weighting, both funds are overwhelmingly influenced by the large-cap holdings.

IVVVTI
Large-Cap84%73%
Mid-Cap16%19%
Small-Cap0%8%
Source: ThoughtfulFinance.com, Morningstar; data as of 12/31/2022

Sector Weights

The sector weights between IVV and VTI are nearly identical.

IVVVTI
Basic Materials2.50%2.65%
Consumer Cyclical9.63%9.77%
Financial Services14.20%13.93%
Real Estate2.82%3.51%
Communication Services7.44%6.71%
Energy5.15%5.15%
Industrials9.11%10.07%
Technology22.62%22.48%
Consumer Defensive7.65%6.98%
Healthcare15.71%15.69%
Utilities3.16%3.07%
Source: ThoughtfulFinance.com, Morningstar; data as of 12/31/2022

Expenses

The expense ratio for both funds is .03%, which extremely low.

Transaction Costs

ETFs are free to trade at many brokers and custodians, so both IVV and VTI should be free to trade in most cases. Additionally, these funds are among the largest ETFs and are very liquid. The bid-ask spread of both IVV and VTI is about .01%, so individual investor trades will not generally be large enough to “move” the market.

Tax Efficiency & Capital Gain Distributions

ETFs are typically more tax-efficient than mutual funds, due to their ability to avoid realizing capital gains through like-kind redemptions (a process that is beyond the scope of this post). VTI has never made a capital gains distribution and IVV has not made a capital gains distribution in 20+ years (and I do not expect it to moving forward). Thus, these funds are about as tax-efficient as any fund can be and either fund is appropriate in taxable accounts.

Final Thoughts: VTI vs IVV

Both IVV and VTI are large, core funds sponsored and managed by two of the largest investment sponsors in the world. Although IVV is more of a large-cap ETF and VTI is a total market ETF, performance has been extremely similar.

I view these two funds as essentially interchangeable and would not spend too much energy splitting hairs to decide which one is “better” (unless one has a clear view on whether larger caps or smaller caps will perform better in the future and even then the difference won’t be much)! In my opinion, both funds are among the best ETFs out there and investors cannot really go wrong with either.

CDs vs Treasuries: Comparison & A Clear Choice

CDs and Treasuries are two popular vehicles for investors to maximize returns without taking much (if any) credit risk. The average American is probably more familiar with CDs even though Treasuries are a better vehicle for most people. Learn why below:

CD stands for certificate of deposit and are issued by banks. There are two main types of CDs. Traditional CDs are typically advertised to a bank’s clients and potential clients. Brokered CDs are distributed through brokerages and investors can purchase them at issuance or trade them. Read more about brokered CDs vs bank CDs.

Treasuries are refer to bonds issued by the US Treasury. Treasury bonds, notes, and bills are all the same thing and the different words are used to denote the term of the bond at issuance (bonds are long-term, notes are intermediate, and bills are short-term). This article focuses on shorter-term maturities since CD are generally shorter-term.

Safety

CDs

Both CDs and Treasuries offer government guarantees, although the terms and entities are slightly different.

CDs and other types of bank accounts are typically insured by the Federal Depot Insurance Corporation (FDIC), which insures up to “per depositor at each insured bank and savings association.” Those with more than $250,000 can use multiple registrations and/or multiple banks to obtain a higher amount of protection (in aggregate).

The FDIC is essentially an insurance plan that banks pay into to protect their customers in case the bank fails. If there were massive numbers of bank failures that overwhelmed the FDIC’s ability to make depositors whole, the FDIC’s website states two contingency plans:

  • Plan A would be to draw on a line of credit with the US Treasury. Essentially get a loan from the Treasury.
  • Plan B is that the FDIC is backed by the full faith and credit of the US government (which is another way of saying the Treasury would cover any shortfall). This is probably true, but I imagine it would require congressional approval which could be politically fraught.

However, no FDIC insured deposits have been lost due to bank failure since the FDIC was established in 1933.

Treasuries

Treasuries are not insured in any way. So there is no dollar limit, since there is no insurance in the first place.

The US Treasury says it will pay back principal and interest and people accept that (although it gets a little dicey every time there is a debt-ceiling standoff in the US). That being said, I would argue that Treasuries are theoretically safer than CDs since the Treasury backs the FDIC. Of course, you should not park money in Treasuries if there’s a chance that the US will sanction you, as Russia learned in 2022 (the US simply confiscated their Treasuries, which are of course just digital assets sitting on ledgers in the Treasury computer system).

I suppose there is a scenario where the US government defaults (due to a debt ceiling battle or something else) and Treasury payments don’t get made while banks still honor CD payments. This seems unlikely to me, but I suppose it is theoretically possible.

Liquidity

Treasuries are generally accepted to be the most liquid asset in the world. It is generally very easy and low cost to buy or sell Treasuries.

CDs are a slightly different story. CDs offered by banks directly to consumers are generally illiquid. Investors typically buy a CD for a certain term directly from the bank and there is often an early withdrawal penalty. Brokered CDs are issued by banks through brokerages and investors can buy them at issue or trade them on a secondary market. So brokered CDs are relatively liquid, but not to the same extent as Treasuries. I would personally never buy a CD from a bank, although I would consider a brokered CD.

Rates

This does not always hold true, but Treasuries generally yield the most, followed by brokered CDs with traditional CDs generally yielding the lowest. Of course there is a range, so the highest yielding brokered CD may exceed Treasury rates (as an example). One thing to look out for with traditional CDs are limits on how much can be deposited. The rate may be higher for the first $10,000 (as an example) and lower on any additional amounts.

Taxes

Treasuries have much more favorable tax treatment than CDs. Both Treasuries and CDs generate interest income, which is taxed at ordinary income tax rates. However, Treasuries are exempt from state and local tax, which can be quite high in places like California or New York City. For residents in high tax states or cities, using Treasuries over CDs is probably a no-brainer for taxable accounts.

Other Considerations

i have recommended CDs to some people in the past if their state tax rate is low, don’t need the liquidity, and are older and just more comfortable with CDs. Sometimes it is better to keep retirees in their comfort zone than push them outside their comfort zone, in my opinion. I’m a big proponent of only investing in things that one understands. However, I recommend Treasuries much more frequently than CDs.

Total Value to Paid-In Capital (TVPI): The Basics (and common shortcomings)

TVPI is a common metric in performance reporting for private equity, venture capital, real estate, and other private investments. It is a valuable tool, but it is insufficient in and of itself. It is important to understand how the TVPI figure is generated as well as look at other return metrics such as IRR, CoC, MOIC, and so on.

TVPI Definition

TVPI stands for Total Value to Paid In. It expressed return as a multiple of “paid-in capital.” Paid-in capital is the money that an investor invests (regardless of how much is actually invested), so TVPI is often used to measure the performance of private equity fund investments. TVPI can be quoted on a gross or net of fees basis.

TVPI Formula

TVPI Example

Let’s assume an investor buys into a private equity fund. The investor contributes $11 million. $1 million dollars goes towards fund expenses and fees. The investor receives $1.5 million of distributions and expects to receive a final distribution of $12.5 million at the end of the fund’s life (after all expenses and fees are paid). In this case, the TVPI is 1.27x.

TVPI Calculation

In the above example, we get 1.27x by adding $1.5 million and $12.5 million and then dividing by $11 million.

Shortfalls of TVPI

TVPI is an immensely useful metric for evaluating private equity investments. However, TVPI does have some limitations as well.

TVPI Does Not Consider Time

The first major problem with TVPI is that it does not consider time. We do not know whether an investment with a 2x TVPI is good or bad. It the investment was 2 years ago, the 2x TVPI is great performance. If the investment was made 15 years ago, the 2x TVPI looks rather low.

TVPI Does Not Consider Time Value of Money

Even if two private equity funds are identical in terms of TVPI and time invested, there can be major differences in return. Consider two different five-year funds, Fund A and Fund B. Both funds have generated a 1.6x TVPI. Yet, this is insufficient to know which fund performed better.

Lets assume Fund A called 100% of capital immediately. After two years, it returned 130% of that amount back to investors and an additional 30% at the end of the five year period. This is a 1.6x TVPI.

Alternatively, consider Fund B which also called 100% of capital immediately. It made no distributions for five years and then returned 160% of capital back to investors. This is also a 1.6x TVPI.

Even though the two private equity funds have the same TVPI, Fund A clearly performed better than Fund B. Investors could have taken the initial distribution from Fund A and reinvested it for the remaining years, whereas investors in Fund B had a total return of 1.6x.

While TVPI is important, time matters and the time value of money matters. This is why investors should never only look at TVPI. They should also look at IRR and/or understand the timing of the cashflows that generated the TVPI figure. Read my summary on TVPI vs IRR.

TVPI May Not Represent Cash on Cash Returns

The PI in TVPI stands for Paid-In capital, which technically means capital that meets a capital call. But what if capital is met by distributions that have been made? In these cases, the cash-on-cash may be higher than TVPI and more representative of the investor’s experience.

Impact of Recycling on TVPI

A private equity fund will commonly be receiving distributions from the assets that it owns at the same time that it is calling capital from investors. Consider a $100 million fund that receives a $5 million distribution and simultaneously needs to make a $5 million investment. A popular tactic is to use the proceeds to fund the capital call (rather than distributing the $5 million and then issuing a capital call for them to send it back). In this case, the Total Value (numerator) is increasing and the Paid-In capital (denominator) is increasing, but the investor has not contributed any more cash. So the Cash-on-Cash (CoC) return is higher than what the TVPI indicates. Many funds market their “Max Out Of Pocket” exposure, which is another way of saying what percent of an investor’s commitment they end up actually contributing (once recycling is accounted for).

Recallable Distributions (and other shenanigans)

Some private equity funds may distribute capital back to investors very early and classify it as a recallable distribution, meaning that it can be called again. The impact on TVPI is that it reduces the denominator, so TVPI numbers increase. Funds may also make distributions early on (even if they are going to recall it again) because it can permanently increase the IRR metrics. I’m not a huge fan of these recallable distributions, but they are out there and it is important to understand how they can impact TVPI and other performance metrics. The main point here is that fund can play (what I consider) games by re-classifying cash flows.

Scroll to Top