Fund Comparison

VTI vs SPY: Similar, with one slight difference

The SPDR S&P 500 ETF Trust (SPY) and the Vanguard Total Stock Market ETF (VTI) are two of the largest ETFs and are sponsored by State Street and Vanguard respectively. SPY and VTI are a core holding of many investor portfolios and many investors compare SPY vs VTI in order to decide which should be the foundation of their portfolio.

The Short Answer

The biggest difference is that SPY hold mostly large-cap stocks, while VTI is a “total market fund” and includes more mid-caps and small-caps. Despite these differences, the risk and return between these two funds is nearly identical and I consider them interchangeable.

A quick reminder that this site does NOT provide investment recommendations. Fund comparisons (such as this one) are not conducted to identify the “best” fund (since that will vary from investor to investor based on investor-specific factors). Rather, these fund comparison posts are designed to identify and distinguish between the fund details that matter versus the ones that don’t.

The Long Answer

Historical Performance: VTI vs SPY

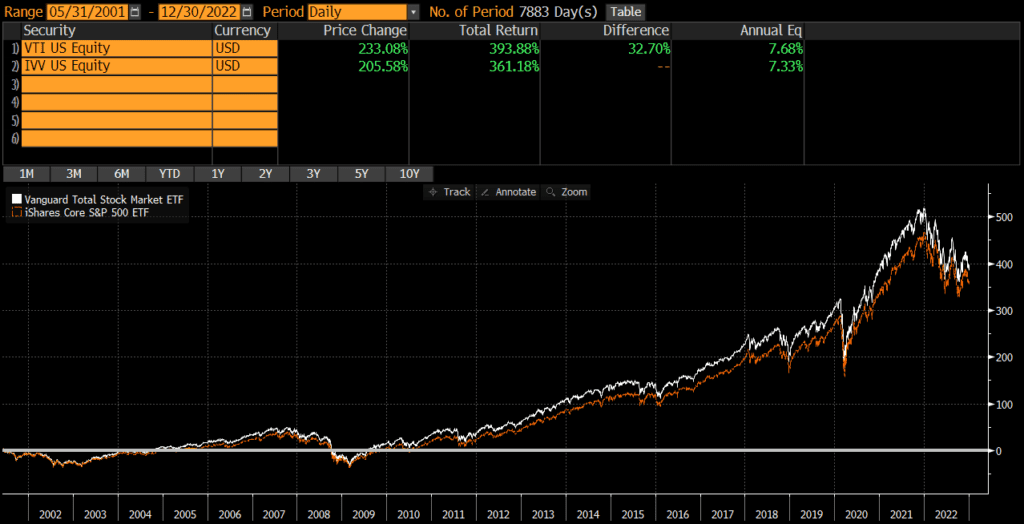
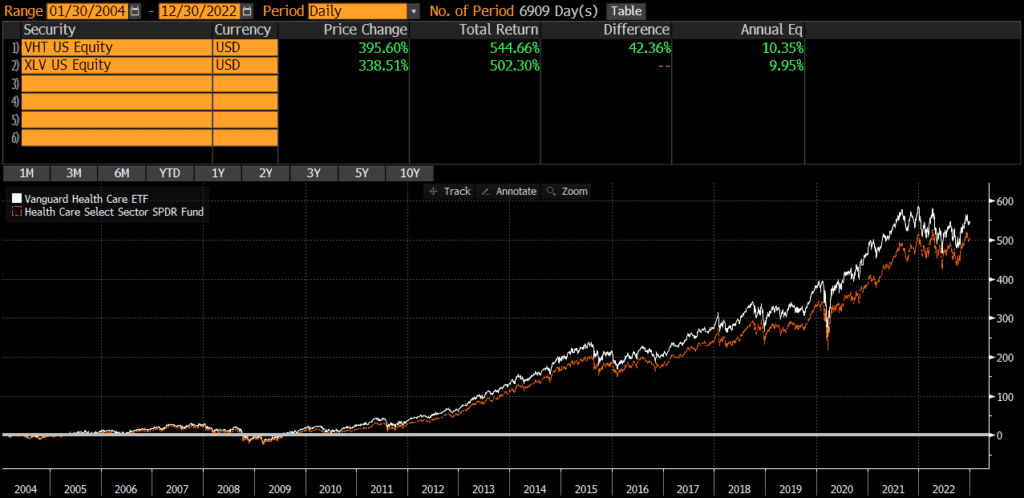
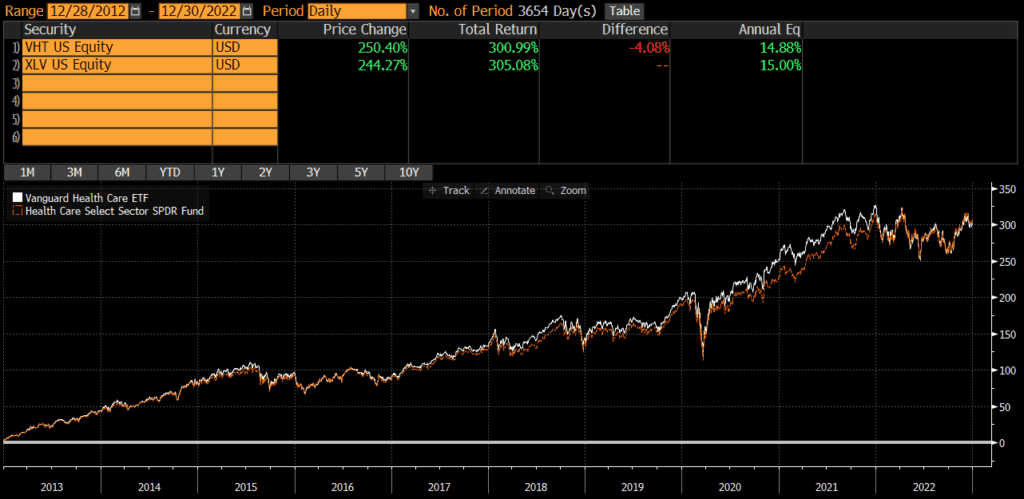
SPY was the first ETF ever and was launched back in 1993, while VTI was launched a few years later in May 2000. Since then, VTI has outperformed by .39% annually. That being said, the performance between these two funds is extremely close and shows that modest differences in market cap exposure does not impact total returns that much. The cumulative performance differential over the past two decades is about 36%.

Differences between VTI vs SPY

The biggest difference between SPY and VTI is the market cap exposure of the funds. SPY tracks the S&P 500 index which includes mostly large-caps and some mid-caps. VTI tracks the CRSP US Total Market Index which covers much more of the market by including more mid-caps and small-caps.

Geographic Exposure

Both SPY and VTI hold essentially 100% US stocks, so I will not dig into country exposures or market classification here. For all intents and purposes, the two funds have identical exposures.

Market Cap Exposure

SPY tracks the S&P 500 index and so it mostly holds large-caps with a bit of mid-cap exposure. VTI tracks the broader CRSP US Total Market Index and so it owns many more mid-caps and small-caps. In other words, SPY is a large-cap vehicle and VTI is a total market vehicle. That being said, due to market cap weighting, both funds are overwhelmingly influenced by the large-cap holdings.

SPYVTI
Large-Cap84%73%
Mid-Cap16%19%
Small-Cap0%8%
Source: ThoughtfulFinance.com, Morningstar; data as of 12/31/2022

Sector Weights

The sector weights between SPY and VTI are nearly identical.

SPYVTI
Basic Materials2.51%2.65%
Consumer Cyclical9.64%9.77%
Financial Services14.20%13.93%
Real Estate2.81%3.51%
Communication Services7.44%6.71%
Energy5.16%5.15%
Industrials9.11%10.07%
Technology22.62%22.48%
Consumer Defensive7.65%6.98%
Healthcare15.71%15.69%
Utilities3.15%3.07%
Source: ThoughtfulFinance.com, Morningstar; data as of 12/31/2022

Expenses

The expense ratio for VTI funds is .03%, while SPY’s is .0945%. On the one hand, SPY is 3x more expensive than VTI. One the other hand, its only a 6.5 basis point difference and not material in my opinion. Investors looking for a lower cost S&P 500 ETF may want to consider IVV or VOO. Read my comparison of VOO vs VTI or VTI vs IVV.

Transaction Costs

ETFs are free to trade at many brokers and custodians, so both SPY and VTI should be free to trade in most cases. Additionally, these funds are among the largest ETFs and are very liquid. The bid-ask spread of both SPY and VTI is about .01%, so individual investor trades will not generally be large enough to “move” the market.

Tax Efficiency & Capital Gain Distributions

ETFs are typically more tax-efficient than mutual funds, due to their ability to avoid realizing capital gains through like-kind redemptions (a process that is beyond the scope of this post). VTI has never made a capital gains distribution and SPY has not made a capital gains distribution since 1996 (and I do not expect it to moving forward). Thus, these funds are about as tax-efficient as any fund can be and either fund is appropriate in taxable accounts.

Options Strategies

The one situation where I would recommend SPY rather than VTI is when an investor plans to integrate covered calls or other options strategies since SPY options are WAY more liquid than VTI. Or someone might want to use VTI to avoid triggering wash sales with their SPY options. It is just something to keep in mind.

Final Thoughts: VTI vs SPY

Both SPY and VTI are large, core funds sponsored and managed by two of the largest investment sponsors in the world. Although SPY is more of a large-cap ETF and VTI is a total market ETF, performance has been extremely similar.

I view these two funds as essentially interchangeable and would not spend too much energy splitting hairs to decide which one is “better” (unless one has a clear view on whether larger caps or smaller caps will perform better in the future and even then the difference won’t be much)! In my opinion, both funds are among the best ETFs out there and investors cannot really go wrong with either.

IVV vs VTI: Comparison by an expert

The iShares Core S&P 500 Index ETF (IVV) and the Vanguard Total Stock Market ETF (VTI) are two of the largest ETFs and are sponsored by Blackrock and Vanguard respectively. IVV and VTI are a core holding of many investor portfolios and many investors compare IVV vs VTI in order to decide which should be the foundation of their portfolio.

The Short Answer

The biggest difference is that IVV hold mostly large-cap stocks, while VTI is a “total market fund” and includes more mid-caps and small-caps. Despite these differences, the risk and return between these two funds is nearly identical and I consider them interchangeable.

A quick reminder that this site does NOT provide investment recommendations. Fund comparisons (such as this one) are not conducted to identify the “best” fund (since that will vary from investor to investor based on investor-specific factors). Rather, these fund comparison posts are designed to identify and distinguish between the fund details that matter versus the ones that don’t.

The Long Answer

Historical Performance: VTI vs IVV

IVV was launched in May 2000, while IVV was launched a year later in May 2001. Since then, VTI has outperformed by .35% annually. That being said, the performance between these two funds is extremely close and shows that modest differences in market cap exposure does not impact total returns that much. The cumulative performance differential over the past two decades is about 32%.

Differences between VTI vs IVV

The biggest difference between IVV and VTI is the market cap exposure of the funds. IVV tracks the S&P 500 index which includes mostly large-caps and some mid-caps. VTI tracks the CRSP US Total Market Index which covers much more of the market by including more mid-caps and small-caps.

Geographic Exposure

Both IVV and VTI hold essentially 100% US stocks, so I will not dig into country exposures or market classification here. For all intents and purposes, the two funds have identical exposures.

Market Cap Exposure

IVV tracks the S&P 500 index and so it mostly holds large-caps with a bit of mid-cap exposure. VTI tracks the broader CRSP US Total Market Index and so it owns many more mid-caps and small-caps. In other words, IVV is a large-cap vehicle and VTI is a total market vehicle. That being said, due to market cap weighting, both funds are overwhelmingly influenced by the large-cap holdings.

IVVVTI
Large-Cap84%73%
Mid-Cap16%19%
Small-Cap0%8%
Source: ThoughtfulFinance.com, Morningstar; data as of 12/31/2022

Sector Weights

The sector weights between IVV and VTI are nearly identical.

IVVVTI
Basic Materials2.50%2.65%
Consumer Cyclical9.63%9.77%
Financial Services14.20%13.93%
Real Estate2.82%3.51%
Communication Services7.44%6.71%
Energy5.15%5.15%
Industrials9.11%10.07%
Technology22.62%22.48%
Consumer Defensive7.65%6.98%
Healthcare15.71%15.69%
Utilities3.16%3.07%
Source: ThoughtfulFinance.com, Morningstar; data as of 12/31/2022

Expenses

The expense ratio for both funds is .03%, which extremely low.

Transaction Costs

ETFs are free to trade at many brokers and custodians, so both IVV and VTI should be free to trade in most cases. Additionally, these funds are among the largest ETFs and are very liquid. The bid-ask spread of both IVV and VTI is about .01%, so individual investor trades will not generally be large enough to “move” the market.

Tax Efficiency & Capital Gain Distributions

ETFs are typically more tax-efficient than mutual funds, due to their ability to avoid realizing capital gains through like-kind redemptions (a process that is beyond the scope of this post). VTI has never made a capital gains distribution and IVV has not made a capital gains distribution in 20+ years (and I do not expect it to moving forward). Thus, these funds are about as tax-efficient as any fund can be and either fund is appropriate in taxable accounts.

Final Thoughts: VTI vs IVV

Both IVV and VTI are large, core funds sponsored and managed by two of the largest investment sponsors in the world. Although IVV is more of a large-cap ETF and VTI is a total market ETF, performance has been extremely similar.

I view these two funds as essentially interchangeable and would not spend too much energy splitting hairs to decide which one is “better” (unless one has a clear view on whether larger caps or smaller caps will perform better in the future and even then the difference won’t be much)! In my opinion, both funds are among the best ETFs out there and investors cannot really go wrong with either.

FTEC vs XLK

The Fidelity MSCI Information Technology Index ETF (FTEC) and State Street’s The Technology Select Sector SPDR Fund (XLK) are two of the largest information technology sector ETFs and two of the most popular among individual investors. Many investors compare FTEC vs XLK because they are so similar. The funds are quite similar with one important difference.

A quick reminder that this site does NOT provide investment recommendations. Fund comparisons (such as this one) are not conducted to identify the “best” fund (since that will vary from investor to investor based on investor-specific factors). Rather, these fund comparison posts are designed to identify and distinguish between the fund details that matter versus the ones that don’t.

The Short Answer

The primary difference between the funds is that XLK is a large-cap fund, while FTEC includes mid-caps and small-caps. Despite this difference, risk and return has been nearly identical and I consider these two funds identical and interchangeable.

The Longer Answer

Historical Performance: FTEC vs XLK

XLK was launched back in 1998, while FTEC was launched in 2013. Since the FTEC’s launch, the two funds have performed incredibly similarly, with an annualized difference of .28%. The cumulative performance differential over that timeframe is roughly 9%.

Portfolio Exposures: FTEC vs XLK

XLK tracks the Technology Select Sector Index, which is essentially a sub-index of the S&P 500 (which is predominantly composed of large-caps). It has changed over the years, but the index that FTEC currently tracks is includes more mid-caps and small-caps (even though it is also predominantly large-caps).

Geographic Exposure

Both FTEC and XLK hold essentially 100% stocks, so I will not dig into country exposures or market classification here. For all intents and purposes, the two funds have identical geographic exposures.

Market Cap Exposure

As the below data illustrates, XLK primarily holds large-caps, while FTEC is a bit more diversified in terms of market cap. Despite this difference, both funds are market-cap weighted and risk/return is overwhelmingly driven by the large-cap exposure.

XLKFTEC
Large Cap93%83%
Mid Cap5%12%
Small Cap0%5%
Source: ThoughtfulFinance.com, Morningstar (data as of 2/10/2023)

Sector Exposure

FTEC and XLK are information technology ETFs and so their holdings are 100% information technology stocks.

Practical Factors: FTEC vs XLK

Transaction Costs

As ETFs, both XLK and FTEC are free to trade on many platforms. Bid-ask spreads for both FTEC and XLK are extremely low and volume is sufficient to prevent most individual investors from “moving the market.”

Expenses

XLK’s expense ration is .10%, while FTEC’s is .085%. At these low levels of expense ratios, small differences in expense ratios does not typically matter anyways. Something to keep in mind if one fund or the other decides to reduce fees.

Tax Efficiency & Capital Gain Distributions

Neither FTEC nor XLK has ever made a capital gains distribution and I do not expect them to make any moving forward. In my opinion, these two funds are equally tax-efficient.

Options Strategies

The one factor that may sway someone towards XLK is if they are managing some type of option strategy, such as covered calls. The options market for XLK is much more active than for FTEC. Of course, if someone wants to trade options without triggering tax consequences in another part of their portfolio, perhaps FTEC is the better pick for the non-option holding.

Bottom Line: FTEC vs XLK

FTEC and XLK are identical in nearly every way and I would not spend any time comparing them or trying to decide which is better. I believe investors’ time is better spent evaluating and thinking through more material decisions.

XLK vs QQQ: An Expert’s Opinion

State Street’s Technology Select Sector SPDR Fund (XLK) and the Invesco QQQ ETF (QQQ) are two of the largest and oldest ETFs. XLK is a tech sector ETF, while QQQ is a core holding of many investor portfolios. Both are oriented towards tech, although XLK only holds tech while QQQ is a bit more diversified sector-wise.

A quick reminder that this site does NOT provide investment recommendations. Fund comparisons (such as this one) are not conducted to identify the “best” fund (since that will vary from investor to investor based on investor-specific factors). Rather, these fund comparison posts are designed to identify and distinguish between the fund details that matter versus the ones that don’t.

The Short Answer

The primary difference between the funds is that XLK only holds tech stocks, while QQQ includes others sectors.

The Long Answer

Historical Performance: QQQ vs XLK

XLK was launched in 1998, while QQQ was launched in 1999. Since QQQ’s launch, it has outperformed XLK by 1.21% annually. The cumulative performance differential over that time period is about 143%.

However, much of that difference was caused by the dot com crash of 2000. If start the comparison in 2005, the annual performance difference is only .01%!

Differences between QQQ vs XLK

The two main differences between XLK and QQQ are their sector exposures. XLK tracks the tech-only The Technology Select Sector Index. QQQ tracks the Nasdaq 100 Index which covers many sectors (even though it is heavily weighted towards tech).

Geographic Exposure

Both XLK and QQQ hold essentially 100% stocks, so I will not dig into country exposures or market classification here. For all intents and purposes, the two funds have identical exposures.

Market Cap Exposure

XLK and QQQ have identical market cap exposures. Due to market cap weighting, both funds are overwhelmingly influenced by the large-cap holdings though.

XLKQQQ
Large-Cap93%93%
Mid-Cap7%7%
Small-Cap0%0%
Source: ThoughtfulFinance.com, Morningstar; data as of 2/10/2023

Sector Weights

The sector weights between XLK and QQQ are quite different.

XLKQQQ
Basic Materials0.00%0.00%
Consumer Cyclical0.00%15.54%
Financial Services8.48%0.75%
Real Estate0.00%0.24%
Communication Services0.00%16.18%
Energy0.00%0.48%
Industrials0.00%4.20%
Technology89.25%48.56%
Consumer Defensive0.00%6.02%
Healthcare0.00%6.76%
Utilities0.00%1.25%
Source: ThoughtfulFinance.com, Morningstar; data as of 2/10/2023

Expenses

The expense ratio for XLK is .10%, while QQQ’s expense ratio is .20%. Although QQQ’s expense ratio is 100% higher than XLK’s, its only 10 basis points in absolute terms.

Transaction Costs

ETFs are free to trade at many brokers and custodians, so both XLK and QQQ should be free to trade in most cases. Additionally, these funds are among the largest ETFs and are very liquid. The bid-ask spread of both XLK and QQQ is about .01%, so individual investor trades will not generally be large enough to “move” the market.

Tax Efficiency & Capital Gain Distributions

ETFs are typically more tax-efficient than mutual funds, due to their ability to avoid realizing capital gains through like-kind redemptions (a process that is beyond the scope of this post). As expected, neither QQQ nor XLK has ever made a capital gains distribution (nor do I expect them to). Thus, these funds are about as tax-efficient as any fund can be and either fund is appropriate in taxable accounts.

Final Thoughts: QQQ vs XLK

Both XLK and QQQ are large, popular funds sponsored and managed by two of the largest asset managers in the world. XLK and QQQ are quite different, but performance has been extremely similar. Although QQQ is a bit more diversified, it’s still a concentrated fund.

Neither fund should be a core holding, but either can play a role in a portfolio. Investors just need to decide which sectors they want exposure to for that role when deciding between XLK and QQQ.

VGT vs QQQ: Comparison by an expert

The Vanguard Information Technology ETF (VGT) and the Invesco QQQ ETF (QQQ) are two of the largest and oldest ETFs. VGT is a tech sector ETF, while QQQ is a core holding of many investor portfolios. Each is diversified in a different way; QQQ by sector and VGT by market-cap.

A quick reminder that this site does NOT provide investment recommendations. Fund comparisons (such as this one) are not conducted to identify the “best” fund (since that will vary from investor to investor based on investor-specific factors). Rather, these fund comparison posts are designed to identify and distinguish between the fund details that matter versus the ones that don’t.

The Short Answer

The main differences between the funds is that QQQ is a tech-oriented large-cap fund, while VGT is 100% tech stocks (of all market caps).

The Long Answer

Historical Performance: QQQ vs VGT

QQQ was launched on in 1999, while VGT was launched in January 2004. Since then, QQQ has outperformed by .46% annually. The cumulative performance differential over that time period is about 62%. That being said, the performance between these two funds is extremely close, which is somewhat surprising given their differences.

Differences between QQQ vs VGT

The two main differences between VGT and QQQ are their sector exposures and market cap exposures. VGT tracks the tech-only MSCI US Investable Market Information Technology 25/50 Index which includes tech stocks of all market caps. QQQ tracks the Nasdaq 100 Index which is primarily large caps, but covers many sectors (even though it is heavily weighted towards tech).

Geographic Exposure

Both VGT and QQQ hold essentially 100% stocks, so I will not dig into country exposures or market classification here. For all intents and purposes, the two funds have identical exposures.

Market Cap Exposure

QQQ is essentially a large cap fund, while VGT is more of an all cap fund. Due to market cap weighting, both funds are overwhelmingly influenced by the large-cap holdings though.

VGTQQQ
Large-Cap84%93%
Mid-Cap12%7%
Small-Cap5%0%
Source: ThoughtfulFinance.com, Morningstar; data as of 1/31/2023 for VGT and 2/10/2023 for QQQ

Sector Weights

The sector weights between VGT and QQQ are nearly identical.

VGTQQQ
Basic Materials0.01%0.00%
Consumer Cyclical0.03%15.54%
Financial Services7.52%0.75%
Real Estate0.00%0.24%
Communication Services0.13%16.18%
Energy0.00%0.48%
Industrials2.24%4.20%
Technology90.06%48.56%
Consumer Defensive0.00%6.02%
Healthcare0.00%6.76%
Utilities0.00%1.25%
Source: ThoughtfulFinance.com, Morningstar; data as of 1/31/2023 for VGT and 2/10/2023 for QQQ

Expenses

The expense ratio for VGT is .10%, while QQQ’s expense ratio is .20%. Although QQQ’s expense ratio is 100% higher than VGT’s, its only 10 basis points in absolute terms.

Transaction Costs

ETFs are free to trade at many brokers and custodians, so both VGT and QQQ should be free to trade in most cases. Additionally, these funds are among the largest ETFs and are very liquid. The bid-ask spread of both VGT and QQQ is about .01%, so individual investor trades will not generally be large enough to “move” the market.

Tax Efficiency & Capital Gain Distributions

ETFs are typically more tax-efficient than mutual funds, due to their ability to avoid realizing capital gains through like-kind redemptions (a process that is beyond the scope of this post). As expected, neither QQQ nor VGT has ever made a capital gains distribution (nor do I expect them to). Thus, these funds are about as tax-efficient as any fund can be and either fund is appropriate in taxable accounts.

Final Thoughts: QQQ vs VGT

Both VGT and QQQ are large, popular funds sponsored and managed by two of the largest asset managers in the world. Although VGT and QQQ are quite different, performance has been extremely similar. Although each fund is diversified in a different way, neither fund is really diversified. Either fund can be a piece of a portfolio rather than core holding. Investors just need to decide sectors and market caps they want exposure to when deciding between VGT and QQQ.

VAW vs XLB

The Vanguard Materials Index Fund ETF (VAW) and State Street’s The Materials Select Sector SPDR Fund (XLB) are two of the largest Materials sector ETFs and two of the most popular among individual investors. Many investors compare VAW vs XLB because they are so similar. The funds are nearly identical and I consider them interchangeable for most intents and purposes.

A quick reminder that this site does NOT provide investment recommendations. Fund comparisons (such as this one) are not conducted to identify the “best” fund (since that will vary from investor to investor based on investor-specific factors). Rather, these fund comparison posts are designed to identify and distinguish between the fund details that matter versus the ones that don’t.

The Short Answer

The primary difference between the funds is that XLB is a large-cap fund, while VAW includes mid-caps and small-caps.

The Longer Answer

Historical Performance: VAW vs XLB

XLB was launched back in 1998, while VAW was launched in 2004. Since the VAW’s launch, the two funds have performed similarly, with an annualized difference of only .41%. The cumulative performance differential over that timeframe has compounded to roughly 35% though.

Interestingly, if we look at performance from 2008 through early 2022, we find that the annualized performance difference is only .04%! Thus, for the past ~15 years, performance has been nearly identical.

Portfolio Exposures: VAW vs XLB

XLB tracks the Materials Select Sector Index, which is essentially a sub-index of the S&P 500 (which is predominantly composed of large-caps). It has changed over the years, but the index that VAW currently tracks is includes more mid-caps and small-caps (even though it is also predominantly large-caps).

Geographic Exposure

Both VAW and XLB hold essentially 100% stocks, so I will not dig into country exposures or market classification here. For all intents and purposes, the two funds have identical geographic exposures.

Market Cap Exposure

As the below data illustrates, XLB primarily holds large-caps, while VAW is a bit more diversified in terms of market cap. Despite this difference, both funds are market-cap weighted and risk/return is overwhelmingly driven by the large-cap exposure.

XLBVAW
Large Cap61%48%
Mid Cap40%39%
Small Cap0%13%
Source: ThoughtfulFinance.com, Morningstar (data as of 1/31/2023 for VAW & 2/10/2023 for XLB)

Sector Exposure

VAW and XLB are materials ETFs and so their holdings are 100% materials stocks.

Practical Factors: VAW vs XLB

Transaction Costs

As ETFs, both XLB and VAW are free to trade on many platforms. Bid-ask spreads for both VAW and XLB are extremely low and volume is sufficient to prevent most individual investors from “moving the market.”

Expenses

The expense ratio for both XLB and VAW is .10%. At these low levels of expense ratios, small differences in expense ratios does not typically matter anyways. Something to keep in mind if one fund or the other decides to reduce fees.

Tax Efficiency & Capital Gain Distributions

VAW has never made a capital gain distribution and XLB has not made one since 2000. I do not expect either fund to make capital gains distributions moving forward (since they are ETFs). In my opinion, these two funds are equally tax-efficient.

Options Strategies

The one factor that may sway someone towards XLB is if they are managing some type of option strategy, such as covered calls. The options market for XLB is much more active than for VAW. Of course, if someone wants to trade options without triggering tax consequences in another part of their portfolio, perhaps VAW is the better pick for the non-option holding.

Bottom Line: VAW vs XLB

VAW and XLB are nearly identical in most ways and I personally consider them identical and interchangeable (the period from 2004 through 2007 notwithstanding). I believe investors’ time is better spent evaluating and thinking through more material decisions.

VHT vs XLV

The Vanguard Health Care Index Fund ETF (VHT) and State Street’s The Health Care Select Sector SPDR Fund (XLV) are two of the largest health care sector ETFs and two of the most popular among individual investors. Many investors compare VHT vs XLV because they are so similar. The funds are nearly identical, especially if we focus on the past 15 years.

A quick reminder that this site does NOT provide investment recommendations. Fund comparisons (such as this one) are not conducted to identify the “best” fund (since that will vary from investor to investor based on investor-specific factors). Rather, these fund comparison posts are designed to identify and distinguish between the fund details that matter versus the ones that don’t.

The Short Answer

The primary difference between the funds is that XLV is a large-cap fund, while VHT includes mid-caps and small-caps.

The Longer Answer

Historical Performance: VHT vs XLV

XLV was launched back in 1998, while VHT was launched in 2004. Since the VHT’s launch, the two funds have performed similarly, with an annualized difference of only .40%. The cumulative performance differential over that timeframe has compounded to roughly 42% though.

Interestingly, if we look at performance over the past 10 years (from 2013 through 2022), we find that the annualized performance difference is only .12%! There appears to be some deviation during the pandemic, but that gap has closed and the overall performance is nearly identical.

Portfolio Exposures: VHT vs XLV

XLV tracks the Health Care Select Sector Index, which is essentially a sub-index of the S&P 500 (which is predominantly composed of large-caps). It has changed over the years, but the index that VHT currently tracks is includes more mid-caps and small-caps (even though it is also predominantly large-caps).

Geographic Exposure

Both VHT and XLV hold essentially 100% stocks, so I will not dig into country exposures or market classification here. For all intents and purposes, the two funds have identical geographic exposures.

Market Cap Exposure

As the below data illustrates, XLV primarily holds large-caps, while VHT is a bit more diversified in terms of market cap. Despite this difference, both funds are market-cap weighted and risk/return is overwhelmingly driven by the large-cap exposure.

XLVVHT
Large Cap90%77%
Mid Cap11%14%
Small Cap0%8%
Source: ThoughtfulFinance.com, Morningstar (data as of 1/31/2023 for VHT & 2/10/2023 for XLV)

Sector Exposure

VHT and XLV are health care ETFs and so their holdings are 100% health care stocks.

Practical Factors: VHT vs XLV

Transaction Costs

As ETFs, both XLV and VHT are free to trade on many platforms. Bid-ask spreads for both VHT and XLV are extremely low and volume is sufficient to prevent most individual investors from “moving the market.” Investors looking for a mutual fund version of VHT should consider VHCIX and read my comparison of VHT and VHCIX.

Expenses

The expense ratio for both XLV and VHT is .10%. At these low levels of expense ratios, small differences in expense ratios does not typically matter anyways. Something to keep in mind if one fund or the other decides to reduce fees.

Tax Efficiency & Capital Gain Distributions

VHT has never made a capital gain distribution and XLV has not made one since 2000. I do not expect either fund to make capital gains distributions moving forward (since they are ETFs). In my opinion, these two funds are equally tax-efficient.

Options Strategies

The one factor that may sway someone towards XLV is if they are managing some type of option strategy, such as covered calls. The options market for XLV is much more active than for VHT. Of course, if someone wants to trade options without triggering tax consequences in another part of their portfolio, perhaps VHT is the better pick for the non-option holding.

Bottom Line: VHT vs XLV

VHT and XLV are nearly identical in most ways and the decision to use versus the other depends on an investor’s preference for small-caps vs large-caps. I believe investors’ time is better spent evaluating and thinking through more material decisions.

Investors looking for other health care ETFs may want to read my comparison of VHT and FHLC (Fidelity’s health care ETF).

VDC vs XLP: Comparison (of these nearly identical funds)

The Vanguard Consumer Staples Index Fund ETF (VDC) and State Street’s The Consumer Staples Select Sector SPDR Fund (XLP) are two of the largest consumer staples sector ETFs and two of the most popular among individual investors. Many investors compare VDC vs XLP because they are so similar. The funds are nearly identical, especially if we focus on the past 15 years.

A quick reminder that this site does NOT provide investment recommendations. Fund comparisons (such as this one) are not conducted to identify the “best” fund (since that will vary from investor to investor based on investor-specific factors). Rather, these fund comparison posts are designed to identify and distinguish between the fund details that matter versus the ones that don’t.

The Short Answer

The primary difference between the funds is that XLP is a large-cap fund, while VDC includes mid-caps and small-caps.

The Longer Answer

Historical Performance: VDC vs XLP

XLP was launched back in 1998, while VDC was launched in 2004. Since the VDC’s launch, the two funds have performed similarly, with an annualized difference of only .28%. The cumulative performance differential over that timeframe has compounded to nearly 28% though.

Interestingly, if we look at performance from 2007 through early 2022, we find that the annualized performance difference is only .06%! Thus, for the past 15 years, performance has been nearly identical.

Portfolio Exposures: VDC vs XLP

XLP tracks the Consumer Staples Select Sector Index, which is essentially a sub-index of the S&P 500 (which is predominantly composed of large-caps). It has changed over the years, but the index that VDC currently tracks is includes more mid-caps and small-caps (even though it is also predominantly large-caps).

Geographic Exposure

Both VDC and XLP hold essentially 100% stocks, so I will not dig into country exposures or market classification here. For all intents and purposes, the two funds have identical geographic exposures.

Market Cap Exposure

As the below data illustrates, XLP primarily holds large-caps, while VDC is a bit more diversified in terms of market cap. Despite this difference, both funds are market-cap weighted and risk/return is overwhelmingly driven by the large-cap exposure.

XLPVDC
Large Cap88%77%
Mid Cap13%15%
Small Cap0%9%
Source: ThoughtfulFinance.com, Morningstar (data as of 1/31/2023 for VDC & 2/10/2023 for XLP)

Sector Exposure

VDC and XLP are consumer staples ETFs and so their holdings are 100% consumer staples stocks.

Practical Factors: VDC vs XLP

Transaction Costs

As ETFs, both XLP and VDC are free to trade on many platforms. Bid-ask spreads for both VDC and XLP are extremely low and volume is sufficient to prevent most individual investors from “moving the market.” Investors interested in a mutual fund should read about VDC vs VCSAX (VDC’s mutual fund share class).

Expenses

The expense ratio for both XLP and VDC is .10%. At these low levels of expense ratios, small differences in expense ratios does not typically matter anyways. Something to keep in mind if one fund or the other decides to reduce fees.

Tax Efficiency & Capital Gain Distributions

XLP has never made a capital gain distribution and VDC has not made one since 2004. I do not expect either fund to make capital gains distributions moving forward (since they are ETFs). In my opinion, these two funds are equally tax-efficient.

Options Strategies

The one factor that may sway someone towards XLP is if they are managing some type of option strategy, such as covered calls. The options market for XLP is much more active than for VDC. Of course, if someone wants to trade options without triggering tax consequences in another part of their portfolio, perhaps VDC is the better pick for the non-option holding.

Bottom Line: VDC vs XLP

VDC and XLP are nearly identical in most ways and I personally consider them identical and interchangeable (the period from 2004 through 2006 notwithstanding). I believe investors’ time is better spent evaluating and thinking through more material decisions.

Investors interested in a third consumer staple ETF should check out my post on VDC vs FSTA (Fidelity’s consumer staple ETF).

VDE vs XLE: Similar, with one major difference

The Vanguard Energy Index Fund ETF (VDE) and State Street’s The Energy Select Sector SPDR Fund (XLE) are two of the largest Energy sector ETFs and two of the most popular among individual investors. Many investors compare VDE vs XLE because they are so similar. The funds are quite similar in many respects, but performance deviated a bit in the “twenty teens.”

A quick reminder that this site does NOT provide investment recommendations. Fund comparisons (such as this one) are not conducted to identify the “best” fund (since that will vary from investor to investor based on investor-specific factors). Rather, these fund comparison posts are designed to identify and distinguish between the fund details that matter versus the ones that don’t.

The Short Answer

The primary difference between the funds is that XLE is a large-cap fund, while VDE includes mid-caps and small-caps.

The Longer Answer

Historical Performance: VDE vs XLE

XLE was launched back in 1998, while VDE was launched in 2004. Since the VDE’s launch, the two funds have performed somewhat similarly, with an annualized difference of .62%. The cumulative performance differential has compounded though and sits at 2.6%.

Interestingly, the funds pretty much moved in tandem until 2012 and that performance differences has compounded since then.

Portfolio Exposures: VDE vs XLE

XLE tracks the Energy Select Sector Index, which is essentially a sub-index of the S&P 500 (which is predominantly composed of large-caps). It has changed over the years, but the index that VDE currently tracks is includes more mid-caps and small-caps (even though it is also predominantly large-caps).

Geographic Exposure

Both VDE and XLE hold essentially 100% stocks, so I will not dig into country exposures or market classification here. For all intents and purposes, the two funds have identical geographic exposures.

Market Cap Exposure

As the below data illustrates, XLE primarily holds large-caps, while VDE is a bit more diversified in terms of market cap. Despite this difference, both funds are market-cap weighted and risk/return is overwhelmingly driven by the large-cap exposure.

XLEVDE
Large Cap86%75%
Mid Cap15%15%
Small Cap0%9%
Source: ThoughtfulFinance.com, Morningstar (data as of 1/31/2023 for VDE & 2/10/2023 for XLE)

Sector Exposure

VDE and XLE are energy ETFs and so their holdings are 100% energy stocks.

Practical Factors: VDE vs XLE

Transaction Costs

As ETFs, both XLE and VDE are free to trade on many platforms. Bid-ask spreads for both VDE and XLE are extremely low and volume is sufficient to prevent most individual investors from “moving the market.”

Expenses

The expense ratio for both XLE and VDE is .10%. At these low levels of expense ratios, small differences in expense ratios does not typically matter anyways. Something to keep in mind if one fund or the other decides to reduce fees.

Tax Efficiency & Capital Gain Distributions

Neither VDE nor XLE has ever made a capital gain distribution and I do not expect either fund to make capital gains distributions moving forward (since they are ETFs). In my opinion, these two funds are equally tax-efficient.

Options Strategies

The one factor that may sway someone towards XLE is if they are managing some type of option strategy, such as covered calls. The options market for XLE is much more active than for VDE. Of course, if someone wants to trade options without triggering tax consequences in another part of their portfolio, perhaps VDE is the better pick for the non-option holding.

Bottom Line: VDE vs XLE

VDE and XLE are fairly similar in most ways and the decision to use one versus the other depends on an investor’s preference for small-caps or large-caps. I believe investors’ time is better spent evaluating and thinking through more material decisions.

Investors looking for other energy vehicles might consider Fidelity’s energy ETF (read my post comparing FENY and VDE here) or Vanguard’s mutual fund version of VDE, VENAX.

VCR vs XLY: Nearly identical (until recently)

The Vanguard Consumer Discretionary Index Fund ETF (VCR) and State Street’s The Consumer Discretionary Select Sector SPDR Fund (XLY) are two of the largest consumer discretionary sector ETFs and two of the most popular among individual investors. Many investors compare VCR vs XLY because they are so similar. The funds are quite similar in many respects, but performance has deviated quite a bit lately.

A quick reminder that this site does NOT provide investment recommendations. Fund comparisons (such as this one) are not conducted to identify the “best” fund (since that will vary from investor to investor based on investor-specific factors). Rather, these fund comparison posts are designed to identify and distinguish between the fund details that matter versus the ones that don’t.

The Short Answer

The primary difference between the funds is that XLY is a large-cap fund, while VCR includes mid-caps and small-caps.

The Longer Answer

Historical Performance: VCR vs XLY

XLY was launched back in 1998, while VCR was launched in 2004. Since the VCR’s launch, the two funds have performed similarly, with an annualized difference of .46%. The cumulative performance differential over that timeframe is only 2.6%.

Interestingly, the funds pretty much moved in tandem until 2018 when some changes were made to indices and many index providers moved some mega-cap stocks from the tech sector to the consumer discretionary sector. Then the market environment of 2020 and 2021 caused further differences. If we look at performance from 2019 through early 2023, we find that the annualized performance difference is much wider at over 3% annually.

Portfolio Exposures: VCR vs XLY

XLY tracks the Consumer Discretionary Select Sector Index, which is essentially a sub-index of the S&P 500 (which is predominantly composed of large-caps). It has changed over the years, but the index that VCR currently tracks is includes more mid-caps and small-caps (even though it is also predominantly large-caps).

Geographic Exposure

Both VCR and XLY hold essentially 100% stocks, so I will not dig into country exposures or market classification here. For all intents and purposes, the two funds have identical geographic exposures.

Market Cap Exposure

As the below data illustrates, XLY primarily holds large-caps, while VCR is a bit more diversified in terms of market cap. Despite this difference, both funds are market-cap weighted and risk/return is overwhelmingly driven by the large-cap exposure.

XLYVCR
Large Cap84%72%
Mid Cap16%19%
Small Cap0%8%
Source: ThoughtfulFinance.com, Morningstar (data as of 1/31/2023 for VCR & 2/10/2023 for XLY)

Sector Exposure

VCR and XLY are consumer discretionary ETFs and so their holdings are 100% consumer discretionary stocks.

Practical Factors: VCR vs XLY

Transaction Costs

As ETFs, both XLY and VCR are free to trade on many platforms. Bid-ask spreads for both VCR and XLY are extremely low and volume is sufficient to prevent most individual investors from “moving the market.” Investors looking for a mutual fund may want to read my comparison of VCR vs VCDAX (VCR’s mutual fund share class).

Expenses

The expense ratio for both XLY and VCR is .10%. At these low levels of expense ratios, small differences in expense ratios does not typically matter anyways. Something to keep in mind if one fund or the other decides to reduce fees.

Tax Efficiency & Capital Gain Distributions

Neither VCR nor XLY has ever made a capital gain distribution and I do not expect either fund to make capital gains distributions moving forward (since they are ETFs). In my opinion, these two funds are equally tax-efficient.

Options Strategies

The one factor that may sway someone towards XLY is if they are managing some type of option strategy, such as covered calls. The options market for XLY is much more active than for VCR. Of course, if someone wants to trade options without triggering tax consequences in another part of their portfolio, perhaps VCR is the better pick for the non-option holding.

Bottom Line: VCR vs XLY

VCR and XLY are fairly similar in most ways and the decision to use one versus the other depends on an investor’s preference for small-caps or large-caps. I believe investors’ time is better spent evaluating and thinking through more material decisions.

For those interested in other consumer discretionary ETFs, check out my comparison of Fidelity’s consumer discretionary ETF FDIS vs VCR.

Scroll to Top