State Street’s Technology Select Sector SPDR Fund (XLK) and the Invesco QQQ ETF (QQQ) are two of the largest and oldest ETFs. XLK is a tech sector ETF, while QQQ is a core holding of many investor portfolios. Both are oriented towards tech, although XLK only holds tech while QQQ is a bit more diversified sector-wise.
A quick reminder that this site does NOT provide investment recommendations. Fund comparisons (such as this one) are not conducted to identify the “best” fund (since that will vary from investor to investor based on investor-specific factors). Rather, these fund comparison posts are designed to identify and distinguish between the fund details that matter versus the ones that don’t.
The Short Answer
The primary difference between the funds is that XLK only holds tech stocks, while QQQ includes others sectors.
The Long Answer
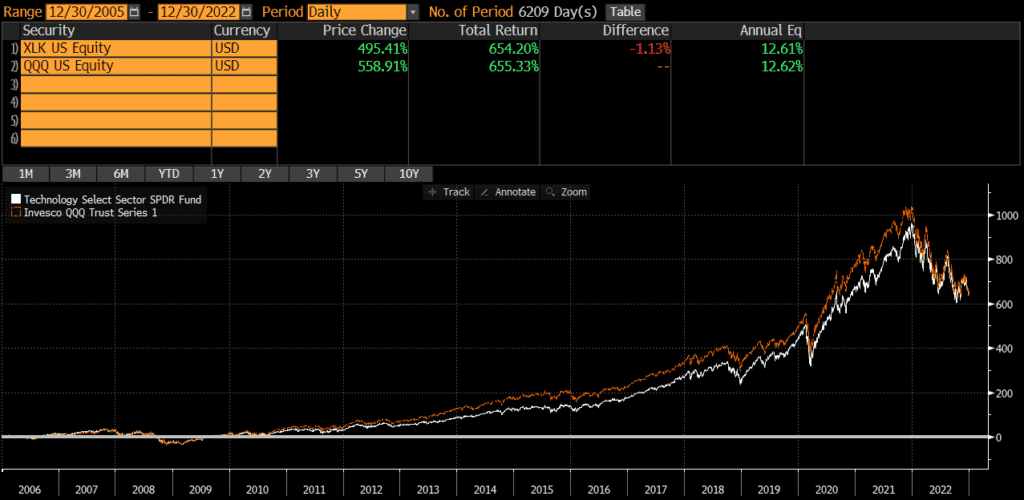
Historical Performance: QQQ vs XLK
XLK was launched in 1998, while QQQ was launched in 1999. Since QQQ’s launch, it has outperformed XLK by 1.21% annually. The cumulative performance differential over that time period is about 143%.

However, much of that difference was caused by the dot com crash of 2000. If start the comparison in 2005, the annual performance difference is only .01%!
Differences between QQQ vs XLK
The two main differences between XLK and QQQ are their sector exposures. XLK tracks the tech-only The Technology Select Sector Index. QQQ tracks the Nasdaq 100 Index which covers many sectors (even though it is heavily weighted towards tech).
Geographic Exposure
Both XLK and QQQ hold essentially 100% stocks, so I will not dig into country exposures or market classification here. For all intents and purposes, the two funds have identical exposures.
Market Cap Exposure
XLK and QQQ have identical market cap exposures. Due to market cap weighting, both funds are overwhelmingly influenced by the large-cap holdings though.
| XLK | QQQ | |
| Large-Cap | 93% | 93% |
| Mid-Cap | 7% | 7% |
| Small-Cap | 0% | 0% |
Sector Weights
The sector weights between XLK and QQQ are quite different.
| XLK | QQQ | |
| Basic Materials | 0.00% | 0.00% |
| Consumer Cyclical | 0.00% | 15.54% |
| Financial Services | 8.48% | 0.75% |
| Real Estate | 0.00% | 0.24% |
| Communication Services | 0.00% | 16.18% |
| Energy | 0.00% | 0.48% |
| Industrials | 0.00% | 4.20% |
| Technology | 89.25% | 48.56% |
| Consumer Defensive | 0.00% | 6.02% |
| Healthcare | 0.00% | 6.76% |
| Utilities | 0.00% | 1.25% |
Expenses
The expense ratio for XLK is .10%, while QQQ’s expense ratio is .20%. Although QQQ’s expense ratio is 100% higher than XLK’s, its only 10 basis points in absolute terms.
Transaction Costs
ETFs are free to trade at many brokers and custodians, so both XLK and QQQ should be free to trade in most cases. Additionally, these funds are among the largest ETFs and are very liquid. The bid-ask spread of both XLK and QQQ is about .01%, so individual investor trades will not generally be large enough to “move” the market.
Tax Efficiency & Capital Gain Distributions
ETFs are typically more tax-efficient than mutual funds, due to their ability to avoid realizing capital gains through like-kind redemptions (a process that is beyond the scope of this post). As expected, neither QQQ nor XLK has ever made a capital gains distribution (nor do I expect them to). Thus, these funds are about as tax-efficient as any fund can be and either fund is appropriate in taxable accounts.
Final Thoughts: QQQ vs XLK
Both XLK and QQQ are large, popular funds sponsored and managed by two of the largest asset managers in the world. XLK and QQQ are quite different, but performance has been extremely similar. Although QQQ is a bit more diversified, it’s still a concentrated fund.
Neither fund should be a core holding, but either can play a role in a portfolio. Investors just need to decide which sectors they want exposure to for that role when deciding between XLK and QQQ.