The Vanguard Materials Index Fund ETF (VAW) and State Street’s The Materials Select Sector SPDR Fund (XLB) are two of the largest Materials sector ETFs and two of the most popular among individual investors. Many investors compare VAW vs XLB because they are so similar. The funds are nearly identical and I consider them interchangeable for most intents and purposes.
A quick reminder that this site does NOT provide investment recommendations. Fund comparisons (such as this one) are not conducted to identify the “best” fund (since that will vary from investor to investor based on investor-specific factors). Rather, these fund comparison posts are designed to identify and distinguish between the fund details that matter versus the ones that don’t.
The Short Answer
The primary difference between the funds is that XLB is a large-cap fund, while VAW includes mid-caps and small-caps.
The Longer Answer
Historical Performance: VAW vs XLB
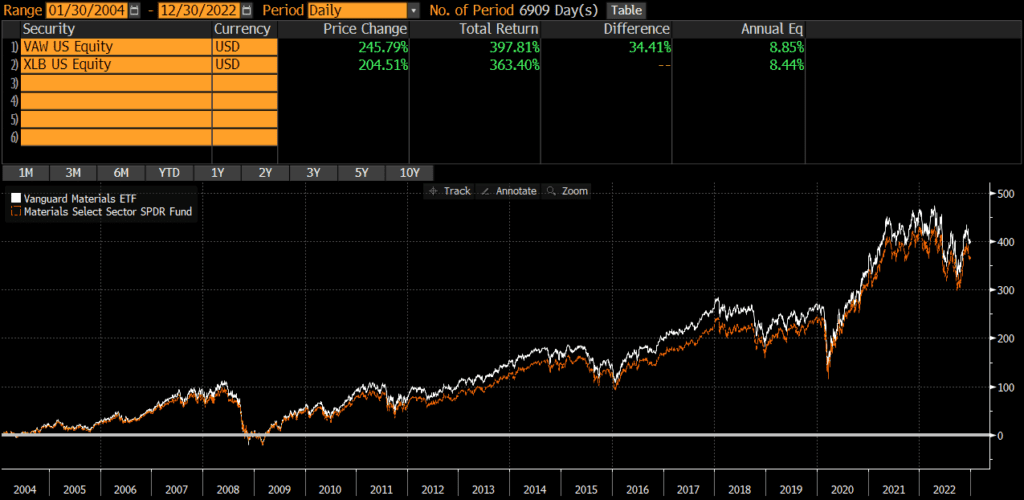
XLB was launched back in 1998, while VAW was launched in 2004. Since the VAW’s launch, the two funds have performed similarly, with an annualized difference of only .41%. The cumulative performance differential over that timeframe has compounded to roughly 35% though.
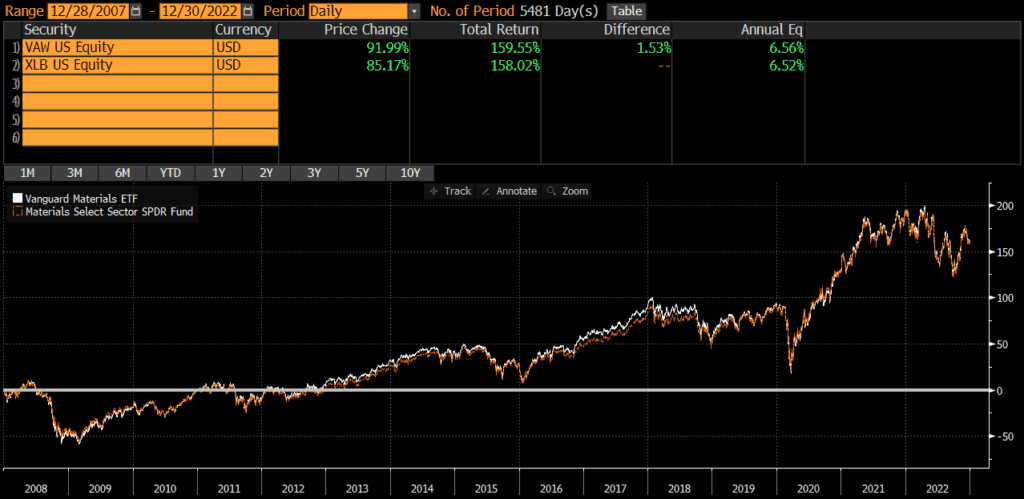
Interestingly, if we look at performance from 2008 through early 2022, we find that the annualized performance difference is only .04%! Thus, for the past ~15 years, performance has been nearly identical.
Portfolio Exposures: VAW vs XLB
XLB tracks the Materials Select Sector Index, which is essentially a sub-index of the S&P 500 (which is predominantly composed of large-caps). It has changed over the years, but the index that VAW currently tracks is includes more mid-caps and small-caps (even though it is also predominantly large-caps).
Geographic Exposure
Both VAW and XLB hold essentially 100% stocks, so I will not dig into country exposures or market classification here. For all intents and purposes, the two funds have identical geographic exposures.
Market Cap Exposure
As the below data illustrates, XLB primarily holds large-caps, while VAW is a bit more diversified in terms of market cap. Despite this difference, both funds are market-cap weighted and risk/return is overwhelmingly driven by the large-cap exposure.
| XLB | VAW | |
| Large Cap | 61% | 48% |
| Mid Cap | 40% | 39% |
| Small Cap | 0% | 13% |
Sector Exposure
VAW and XLB are materials ETFs and so their holdings are 100% materials stocks.
Practical Factors: VAW vs XLB
Transaction Costs
As ETFs, both XLB and VAW are free to trade on many platforms. Bid-ask spreads for both VAW and XLB are extremely low and volume is sufficient to prevent most individual investors from “moving the market.”
Expenses
The expense ratio for both XLB and VAW is .10%. At these low levels of expense ratios, small differences in expense ratios does not typically matter anyways. Something to keep in mind if one fund or the other decides to reduce fees.
Tax Efficiency & Capital Gain Distributions
VAW has never made a capital gain distribution and XLB has not made one since 2000. I do not expect either fund to make capital gains distributions moving forward (since they are ETFs). In my opinion, these two funds are equally tax-efficient.
Options Strategies
The one factor that may sway someone towards XLB is if they are managing some type of option strategy, such as covered calls. The options market for XLB is much more active than for VAW. Of course, if someone wants to trade options without triggering tax consequences in another part of their portfolio, perhaps VAW is the better pick for the non-option holding.
Bottom Line: VAW vs XLB
VAW and XLB are nearly identical in most ways and I personally consider them identical and interchangeable (the period from 2004 through 2007 notwithstanding). I believe investors’ time is better spent evaluating and thinking through more material decisions.