QQQ is one of the largest, most popular, and most liquid ETFs. The NASDAQ Composite Index is one of the most popular and most-watched indices. Interestingly, “the Q’s” does not track the NASDAQ Composite Index (“the Nasdaq”); QQQ tracks the Nasdaq 100 Index. In other words, “The NASDAQ” Composite Index is referred to in the news and displayed on websites/TV, while the NASDAQ 100 Index seems to be the benchmark for more investable funds and strategies. Despite their similar names, a comparison of the NASDAQ vs QQQ reveals some major differences.
The NASDAQ and QQQ have very different compositions, slightly different weights and exposures, and performance differences have reflected that. It is important to note that QQQ is an investable ETF, while the Nasdaq Composite is an index rather than investment vehicle.
A reminder that these are simply examples as this site does NOT provide investment recommendations.
Historical Performance: the NASDAQ vs QQQ
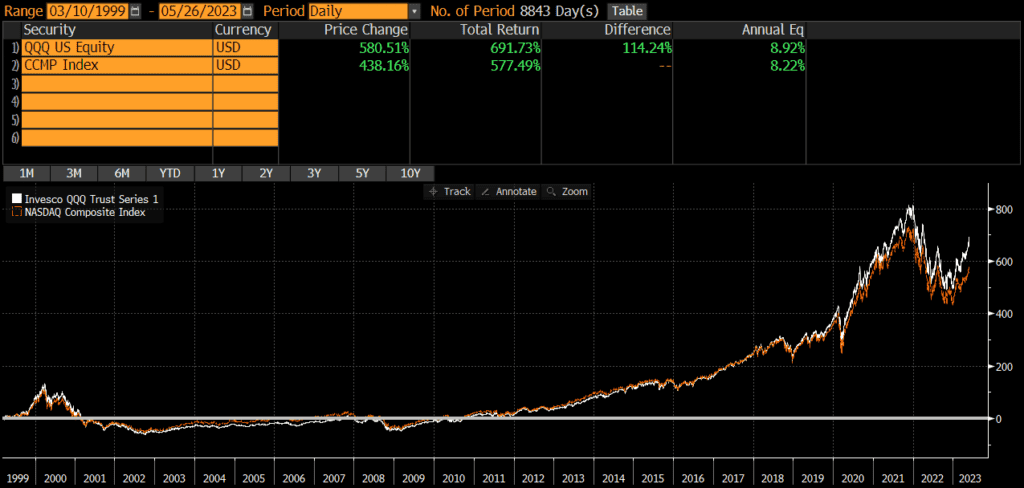
While the Nasdaq index goes back to 1985, QQQ was launched in 1999. Since that time, QQQ has outperformed the NASDAQ by .7% annually. In other words, the “Q’s” have beaten the headline Nasdaq index by a small margin, although the cumulative performance difference is a nearly 115%!
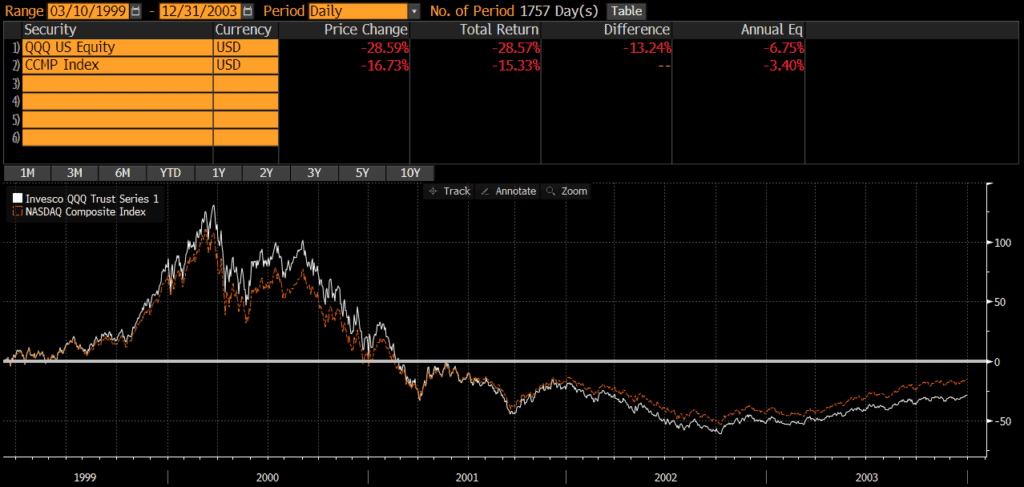
However, there have been periods when the Nasdaq index has beaten QQQ as well. For instance, from inception through 2003, the QQQ’s had an annualized return of -6.75% versus -3.4% for the Nasdaq composite index.
Those looking to evaluate performance history before the 2000s should compare the index performance of these ETFs’ benchmarks and may want to read our post on the Nasdaq 100 vs Nasdaq Composite.
Investors looking for a lower cost version of QQQ may want to research QQQM and/or read my post comparing QQQM vs QQQ. Investors looking a mutual fund version of the NASDAQ should read my comparison of QQQ vs FNCMX.
Differences between the NASDAQ and QQQ
Overall, QQQ and the Nasdaq composite are relatively similar, since they are both based on the same universe of stocks. The NASDAQ has approximately 3,589 constituent stocks (as of 3/31/2023), while QQQ owns roughly 100 stocks. The NASDAQ site publishes the index methodologies for both the Composite and 100.
Geographic Exposure
Substantially all (95%+) of QQQ and the Nasdaq composite index is composed of US-based companies, so I will not include the usual tables of countries, market classification, and so on.
Market Cap Exposure
QQQ holds the 100 largest stocks on the NASDAQ exchange (excluding financials), so it has a much larger weighting to large-caps than the NASDAQ which tracks the Composite Index. However, both the Nasdaq composite and QQQ use weighting methodologies based on market-cap, so large-caps dominate the performance of each.
Below is an estimate of the market cap exposure as of 11/28/2022.
| the NASDAQ | QQQ | |
| Large Cap | 73% | 93% |
| Mid Cap | 16% | 7% |
| Small Cap | 10% | 0% |
Sector Weights
Given that the NASDAQ is a much broader index than QQQ, it is not surprising that the NASDAQ represents more sectors and is less concentrated than QQQ. Below are the sector weightings of the two, as of 11/29/2022.
| NASDAQ Comp Index | QQQ | |
| Basic Materials | 0.39% | 0.00% |
| Consumer Cyclical | 14.17% | 14.25% |
| Financial Services | 5.53% | 0.85% |
| Real Estate | 1.23% | 0.00% |
| Communication Services | 13.18% | 15.25% |
| Energy | 0.82% | 0.00% |
| Industrials | 5.28% | 5.07% |
| Technology | 43.31% | 47.92% |
| Consumer Defensive | 5.08% | 7.22% |
| Healthcare | 9.89% | 7.96% |
| Utilities | 1.14% | 1.48% |
Final Thoughts: the NASDAQ vs QQQ
The decision of whether to invest in QQQ or a fund that tracks the Nasdaq Composite Index comes down to whether an investor wants a more fund that is more concentrated in large-cap and tech or a more diversified portfolio. As the chart of the NASDAQ vs QQQ shows, QQQ has done better historically although this may not hold true moving forward (especially if tech and/or large-caps fall out of favor).