Fund Review

Is It Better To Rent or Buy in California?

Is It Better to Rent or Buy in California?

Deciding between renting and buying a home in California can be a challenging task. While the state is known for its stunning coastline, abundant opportunities, and sunny weather, the high costs associated with living in California often leave people wondering if it’s better to rent or own their homes.

The average rent in California tends to be significantly higher than the national average, with prices varying greatly depending on location, property type, and amenities. Meanwhile, buying properties in the state can be a considerable investment, due to the substantially higher home values when compared to other states. Ultimately the decision to rent or buy in California depends on an individual’s financial situation, lifestyle preferences, and future plans.

Balancing these factors requires a careful evaluation of one’s circumstances. Utilizing resources such as Rent vs Buy Calculators can also be a valuable tool to help individuals make a well-informed decision based on their unique situation. (This tool takes into account various factors like everyday costs of renting, renter’s insurance, security deposit for renting, and expenses related to owning a home. It can help you get an idea of the financial aspects involved in both renting and buying properties, allowing you to make a more informed decision based on your individual circumstances.)

Financial Considerations

Cost of Living in California

California is known for its high cost of living, which impacts both renters and homeowners alike. For those already in California (or those committed to living in California), the cost of buying should always be compared against the cost of renting. For instance, someone might think a $5,000/month mortgage is a lot. But if the alternative is to rent for $4,000, then they should re-frame the question from a $5,000 absolute cost to a $1,000 difference. A slight change in thinking, but it takes into account the alternative costs.

Non-Californians who are considering a move to California should consider the cost of living. It is essential for anyone considering a move to California to research these factors and evaluate them alongside their personal income to determine how feasible it is to live in California.

Housing Prices and Rent Rates

California has some of the highest housing prices and rent rates in the nation. On the other hand, rent rates also tend to be considerably higher than the national average, which may help offset some of the costs associated with buying a home for some individuals.

Down Payments

When considering purchasing a home in California, one must also factor in the closing costs and down payments. For first-time homebuyers, the down payment on a conventional loan can be as low as 3%. Seasoned homebuyers may need a down payment of at least 5%. FHA loans often require a 3.5% down payment, while USDA and VA loans may not require any down payment. Many homebuyers using qualified mortgage (QM) loans put 20% down, while non-QM loans typically require a down payment of 10% to 30%.

Closing Costs, Unexpected Expenses, etc.

When it comes to determining whether renting or buying is the right choice, it depends on the numbers. Renting versus buying ultimately comes down to the math – comparing not only mortgage payments and rent rates but also property taxes and other expenses. The decision is highly dependent on an individual’s personal financial situation, preferences, and long-term goals. It is always recommended that potential homeowners and renters run their own numbers or seek professional assistance to accurately assess their options.

Additional Costs and Expenses of Homeownership

When considering whether to rent or buy a home in California, it’s essential to take into account the various additional costs and expenses associated with homeownership. This section will outline several of these cost factors, covering Mortgage Insurance and Taxes, Maintenance, Utilities, and Upkeep. Renters typically save A LOT of money by not being responsible for maintenance and repairs (although they also miss out on the potential for appreciation).

Mortgage Insurance

Homebuyers who make a down payment of less than 20% are typically required to pay for private mortgage insurance (PMI). This additional cost should be factored into the monthly mortgage payment.

Hazard Insurance

Hazard insurance protects against fires, floods, etc. The annual cost often runs between $1,000-$2,000 for median priced homes in California, although the costs are rising due to the recent spate of natural disasters and fires.

Property Taxes

Property taxes are an essential expense to consider as a homeowner. In California, these taxes are often around 1.25% of the property value per year. California also has a law referred to as Prop 13, which limits property tax increases to 2% per year. This obviously keeps property taxes predictable and keeps a lid on expenses, although it is also blamed for the sky high property prices and low for sale inventory in the state. Lastly, I should note that there is a risk of Prop 13 being rolled back. I do not expect this to happen, but its been floated as an idea before and similar propositions have come up for a vote.

Maintenance

Owning a home also comes with responsibility for maintaining and repairing the property. Maintenance costs can range from regular upkeep, such as landscaping and painting, to larger expenses like roof replacements or plumbing repairs. It’s crucial for prospective homebuyers to establish a budget for repairs and unexpected expenses to ensure they can afford to maintain their investment in the long run.

Utilities

Utilities are an essential expense for any living situation. For homeowners, utilities may include electricity, gas, water, sewer, and trash services. While renters often have some or all of these costs included in their monthly rent, homeowners must budget for all utility expenses on top of their mortgage payments and other costs.

To determine if renting or buying in California is the right option, it’s essential to carefully weigh these additional costs and expenses. The answer will always depend on the individual’s financial situation and long-term goals, as well as the specific numbers involved. By taking the time to evaluate all aspects thoroughly, prospective homebuyers can make an informed decision about their housing future.

Pros and Cons of Renting and Buying in California

Pros of Renting

Renting a home in California has its advantages, primarily flexibility and fewer responsibilities. One benefit of renting is that tenants can easily relocate without the time-consuming and costly process of selling or buying properties or arranging for renters. And while the average rent in California is much higher than the national average, is still cheaper than many peoples’ mortgage payments.

Another advantage is the freedom from maintenance costs, as the landlord is responsible for most property repairs. For renters, this means lower expenses and fewer responsibilities than homeowners. Furthermore, cities with strict rent control and tenant-friendly laws make renting even more appealing for long-term residents.

Pros of Buying

While renting has its merits, there are also benefits of homeownership in California. Historically, a primary benefit has been equity appreciation. Homeowners who secure a mortgage are able to essentially fix their housing costs for 30 years (or however long their mortgage is). A portion of monthly payments are credited toward principal, which builds equity in a property. Of course, any upside appreciation is captured by the homeowner.

When owning a property, individuals also have the freedom to make alterations or improvements to the space without the need for landlord permission. Moreover, some tax advantages come with homeownership, including the possibility of deducting mortgage interest and property taxes from income taxes.

Cons of Renting

Despite the flexibility offered by renting, tenants also face some drawbacks. Renters are continuously subjected to landlord approvals, meaning simple tasks like changing a room’s color or adopting a pet may become complicated bureaucratic endeavors. Dealing with another party regarding one’s home is rarely fun.

Cons of Buying

Homeownership in California comes with its financial challenges, such as the often-prohibitive initial costs of buying a property. Buyers must also budget for ongoing expenses like property taxes, insurance, and maintenance costs, which can add up quickly.

Without potential equity appreciation, renting is probably the better financial choice for many. Many people buy because they expect inflation to push rents and prices up in the future. However, is we relax this assumption, then buying is not as attractive in the long-term.

Overall, the decision of renting versus buying in California depends on various factors, including financial and non-financial considerations. Prospective residents must carefully weigh their options and thoroughly evaluate their personal situation to make the best choice for their unique circumstances.

Housing and Real Estate Market Trends

Housing Market Overview

California’s housing market has long been known for its high prices and demand. The state has experienced significant growth in recent years, with the median home price increasing in recent years. While some areas have seen more substantial price increases, there are notable variations city to city. In high-cost areas like San Jose, San Francisco, and Los Angeles, the gap between renting and buying has been larger than in other regions.

Recent Changes Due to the Pandemic

The COVID-19 pandemic had a considerable impact on the California housing market. Some trends observed during this time include:

  • A shift in buyer preferences: Homebuyers have been looking for more space and amenities, leading to higher demand for suburban properties. This has contributed to price increases in more affordable, outlying suburbs and smaller metro areas.
  • A drop in the number of homes sold: The California housing market saw a 37.5% decrease in the number of homes sold in September 2022 compared to the previous year. The decline in inventory has pushed prices even higher.
The pandemic drove for sale inventory to historically low levels.

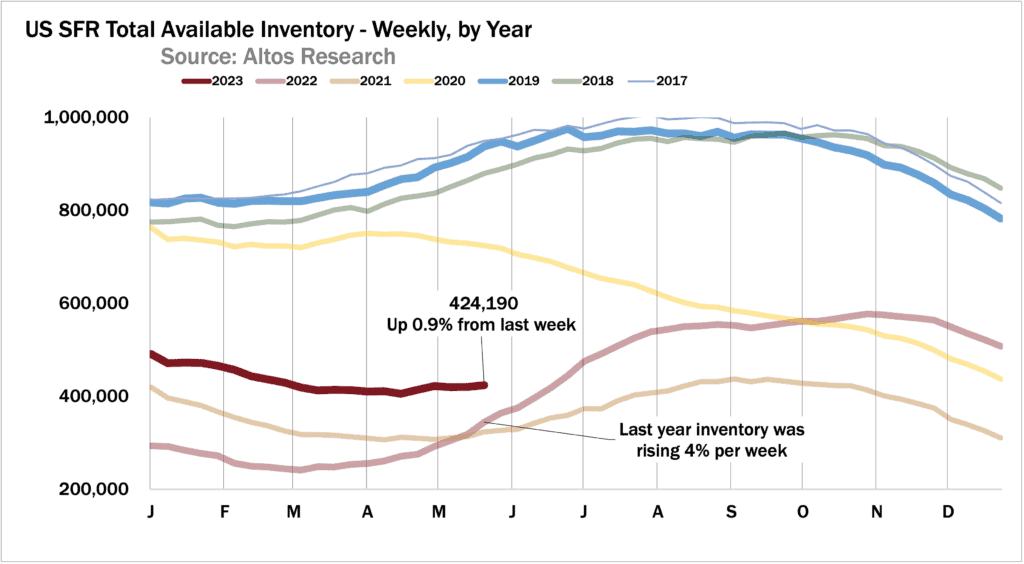
These changes have made the decision to rent or buy in California much more complex, although they probably tilt the scales more towards renting. Every city and neighborhood is different, so it’s essential for potential buyers and renters to work closely with a knowledgeable real estate agent who can provide guidance and assistance in evaluating their options based on the latest trends and data.

Long-term Financial Implications

Home Ownership and Equity Growth

When considering buying a home in California, one of the key aspects to examine is the potential for equity growth. Historically, home prices in the US have risen, allowing homeowners to build equity over time. In California, the housing market has followed a similar trend, with home prices increasing in many regions.

However, it is essential to remember that past trends may not always predict the future. Several factors, such as the local economy, job market, supply and demand, and lender policies, can influence home prices. Consequently, it is crucial to analyze your specific situation and the housing market in your desired location before deciding to buy.

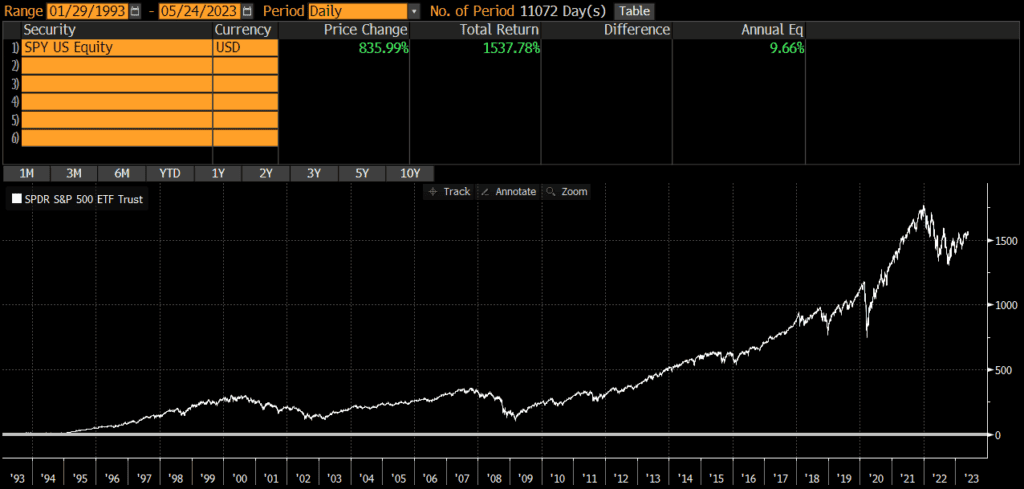
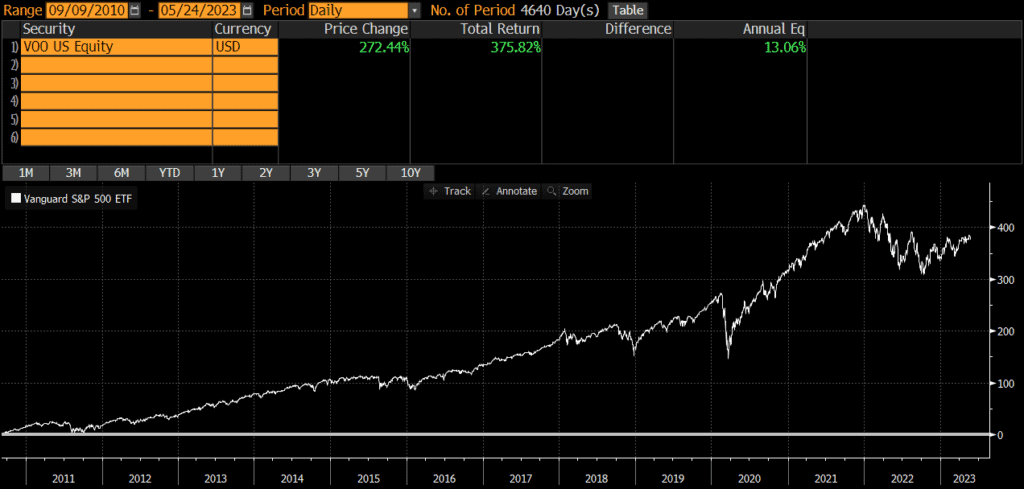
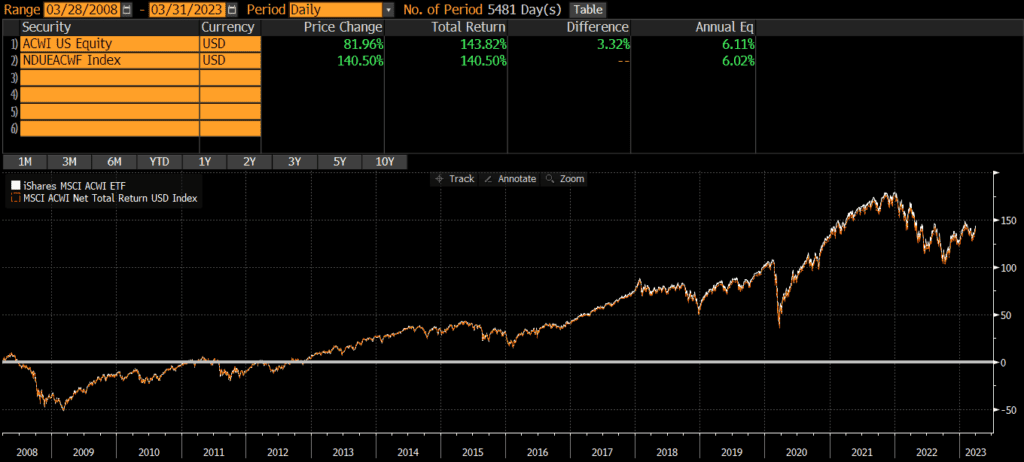
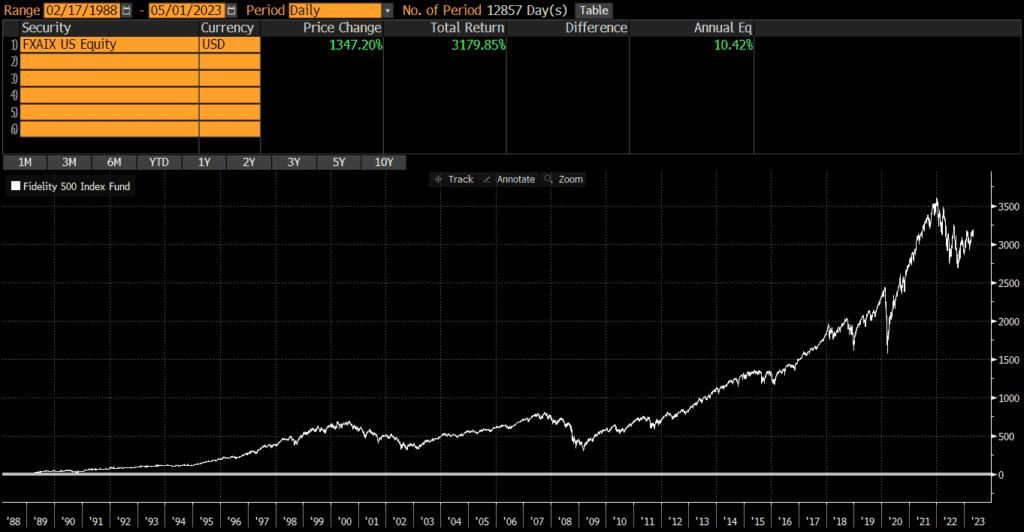
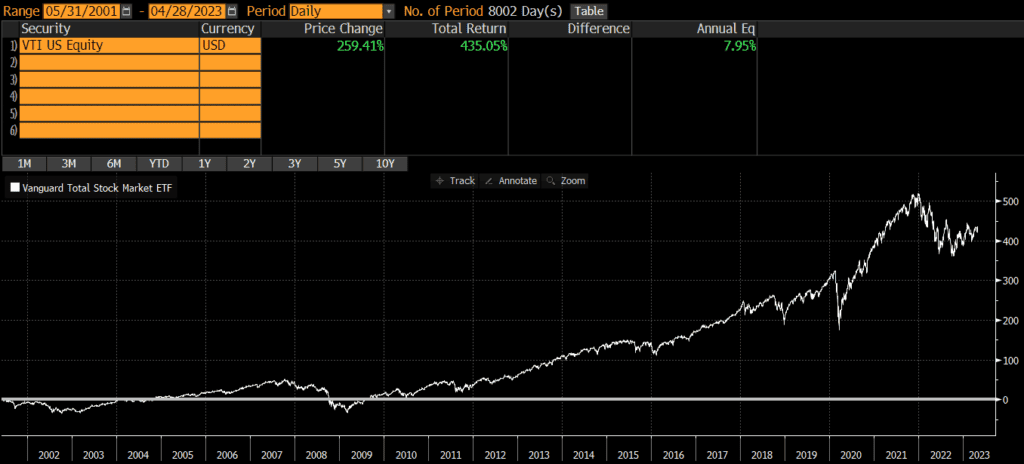
Investments and Stock Market

Another long-term financial factor to consider when deciding between renting or buying in California is the potential return on investment (ROI) from other financial opportunities, such as stock, real estate investments, and so on. In some cases, investing in stocks or other financial assets can result in a higher ROI than purchasing a home.

To determine which option is more favorable, compare the possible returns from investing in the stock market to the potential equity growth in your desired property. It is important to evaluate the risk, potential reward, and liquidity of these investments.

When it comes to deciding whether to rent or buy in California, the answer often depends on the numbers. Carefully analyzing the potential equity growth of a property, comparing ROI of alternative investments, and considering your personal financial situation can help inform your decision. Keep in mind that the future may not always mirror the past, so it is crucial to be cautious and consider various scenarios.

Personal Factors to Consider

When deciding whether to rent or buy in California, it’s okay to take non-financial personal factors into account too!

Career and Job Stability

One of the most important aspects to consider is your career and job stability. Moving frequently for work can impact your choice between renting and buying. If your career requires you to relocate often or you anticipate changing jobs in the near future, renting may be a more suitable option for you.

It’s crucial to remember that buying a home involves upfront costs like down payments, closing costs, and moving expenses. Renting provides more flexibility, as you can easily move without worrying about selling a property or breaking a mortgage.

Financial Goals

Another critical factor to consider is your financial goals. Before deciding on renting or buying, you should assess your current savings, debt level, and future financial plans. Buying a home in California may require a larger down payment and higher monthly mortgage payments, which might conflict with other financial goals or require careful budgeting. Consider whether your financial goals align with the costs and benefits of renting versus buying, as well as your ability to manage the ongoing expenses associated with homeownership.

Lifestyle Preferences

Lastly, think about your lifestyle preferences and how they relate to your living situation. Owning a home provides more autonomy in terms of decorating, renovating, and customizing your living space. Homeownership can also offer a sense of stability and permanence. This can be especially important if you have school-age children and staying at the same school or within the same district is important.

On the other hand, renting may be better suited for those who prefer flexibility, minimal responsibility for property maintenance, and the ability to change apartments or neighborhoods more easily. You should also consider proximity to schools, work, and recreational activities that are important to you.

SPY Review: Is SPY a Good ETF to Invest In?

The State Street SPDR S&P 500 ETF Trust (symbol: SPY) is the oldest and one of the largest exchange-traded funds (ETFs) in the market and widely used by both individual and institutional investors. SPY is a low-cost index fund, which tracks the S&P 500 Index. The fund seeks to provide exposure to the US stock market at a very low price. The fund is the core of many portfolios and the below review of SPY will evaluate why that is.

A quick reminder that this site does NOT provide investment recommendations. Fund reviews (such as this one) are for educational purposes only and are not advice or recommendations.

SPY Performance

The first thing most investors want to know about is performance, so we will start there. According to Bloomberg, since the fund’s inception 30 years ago, SPY has returned nearly 10% per year. Of course, this figure can go up or down and the returns in any single year are unlikely to be 10%. From 1994 through 2022 (29 years), SPY was up in 23 years and down in 6 years. The average return in the up years was 18.5%, while the average return in the down years was -17.1%.

Source: ThoughtfulFinance.com, Bloomberg

SPY Risks

SPY owns stocks which are more volatile than cash or bonds. While the returns are higher than cash or bonds, investors need to be prepared to stomach volatility and be able to hold for the longer-term. SPY was down nearly 35% during the covid pandemic and down over 25% at one point in 2022. Looking further back, it was down nearly 50% during the 2000-2003 recession and declined over 55% during 2007-2009 recession. This is not necessarily worse than other similar funds, but it is a characteristic of stocks that investors need to be aware of.

SPY Portfolio

Fund performance is ultimately driven by a fund’s holdings and exposures, so our SPY review will examine these items.

SPY Holdings

SPY (and its underlying index) is incredibly diversified, holding over 500 stocks. This represents the large-cap segment of the US stock market.

SPYS&P 500
Number of Stocks503503
Sources: ThoughtfulFinance.com, State Street (as of 4/30/2023)

SPY Country Exposures

SPY only owns US-based companies. Investors looking for international exposure may pair SPY with international ETFs or simply hold a global ETF.

SPY Market Cap Exposure

SPY is primarily a large-cap fund which seeks to represent the largest US stocks. Even though the fund holds some mid-caps, performance is primarily driven by the large-cap exposure.

SPY
Large-Cap83%
Mid-Cap16%
Small-Cap0%
Source: ThoughtfulFinance.com, Morningstar; data as of 5/22/2023

SPY Sector Exposures

SPY is extremely diversified across sectors and mirrors the approximate weights of the broad US stock market.

SPY
Basic Materials2.27%
Consumer Cyclical10.36%
Financial Services12.34%
Real Estate2.53%
Communication Services8.75%
Energy4.31%
Industrials8.13%
Technology27.43%
Consumer Defensive7.02%
Healthcare14.14%
Utilities2.72%
Source: ThoughtfulFinance.com, Morningstar; data as of 5/22/2023

Expenses

No review of SPY would be complete without an in-depth look at the explicit and implicit costs of trading and holding SPY.

SPY Expense Ratio

SPY’s expense ratio of .095% is on the higher end for a large index fund, although it is still incredibly low in historical terms and compared to the rest of the market. Investors may be interested in comparing SPY vs VOO or SPY vs IVV.

SPY Transaction Costs

ETFs are free to trade at many brokers and custodians, so SPY should be free to trade in most cases. Additionally, it is among the largest ETFs and is very liquid. The bid-ask spread of SPY is about .01%, so individual investor trades will not generally be large enough to impact or move the market.

SPY Tax Efficiency

Like most index funds, SPY is very tax-efficient. Unlike actively-managed funds, passively-managed index funds typically have less trading and lower turnover. This results in fewer taxable events and higher tax efficiency.

ETFs are typically more tax-efficient than mutual funds, due to their ability to avoid realizing capital gains through like-kind redemptions (a process that is beyond the scope of this post). SPY has never made a capital gains distribution, so SPY is about as tax-efficient as any fund can be.

Investors in a high tax bracket with at least $250,000 may consider direct indexing rather than SPY, as direct indexing can potentially generate even more tax savings.

SPY Review: A Recap

The above review of SPY illustrates that SPY is a well-constructed, low-cost and tax-efficient index fund that provides diversified exposure to the US stock market. SPY is a great choice in many situations and a tool that I often use personally and professionally.

FAQs

VOO Review: Is VOO a Good ETF to Invest In?

The Vanguard S&P 500 ETF (symbol: VOO) is one of the largest exchange-traded funds (ETFs) in the market and widely used by both individual and institutional investors. VOO is a low-cost index fund, which tracks the S&P 500 Index. The fund seeks to provide exposure to the US stock market at a very low price. The fund is the core of many portfolios and the below review of VOO will evaluate why that is.

A quick reminder that this site does NOT provide investment recommendations. Fund reviews (such as this one) are for educational purposes only and are not advice or recommendations.

VOO Performance

The first thing most investors want to know about is performance, so we will start there. According to Bloomberg, since the fund’s inception 13 years ago, VOO has returned over 13% per year. Of course, this figure can go up or down and the returns in any single year are unlikely to be 13%. From 2011 through 2022 (12 years), VOO was up in 10 years and down in 2 years. The average return in the up years was 17.8%, while the average return in the down years was -11.34%.

Source: ThoughtfulFinance.com, Bloomberg

VOO Risks

VOO owns stocks which are more volatile than cash or bonds. While the returns are higher than cash or bonds, investors need to be prepared to stomach volatility and be able to hold for the longer-term. VOO was down nearly 35% during the covid pandemic and down over 25% at one point in 2022. This is not necessarily worse than other similar funds, but it is a characteristic of stocks that investors need to be aware of.

VOO Portfolio

Fund performance is ultimately driven by a fund’s holdings and exposures, so our VOO review will examine these items.

VOO Holdings

VOO (and its underlying index) is incredibly diversified, holding over 500 stocks. This represents the large-cap segment of the US stock market.

VOOS&P 500
Number of Stocks505503
Sources: ThoughtfulFinance.com, Vanguard (as of 4/30/2023)

VOO Country Exposures

VOO only owns US-based companies. Investors looking for international exposure may pair VOO with international ETFs or simply hold a global ETF.

VOO Market Cap Exposure

VOO is primarily a large-cap fund which seeks to represent the largest US stocks. Even though the fund holds some mid-caps, performance is primarily driven by the large-cap exposure.

VOO
Large-Cap83%
Mid-Cap17%
Small-Cap0%
Source: ThoughtfulFinance.com, Morningstar; data as of 04/30/2023

VOO Sector Exposures

VOO is extremely diversified across sectors and mirrors the approximate weights of the broad US stock market.

VOO
Basic Materials2.35%
Consumer Cyclical10.17%
Financial Services12.59%
Real Estate2.62%
Communication Services8.28%
Energy4.69%
Industrials8.18%
Technology26.42%
Consumer Defensive7.32%
Healthcare14.49%
Utilities2.88%
Source: ThoughtfulFinance.com, Morningstar; data as of 4/30/2023

Expenses

No review of VOO would be complete without an in-depth look at the explicit and implicit costs of trading and holding VOO.

VOO Expense Ratio

VOO’s expense ratio of .03% is among the lowest of any large-cap funds. Even if another fund is free, three basis points is not a material difference in my opinion.

VOO Transaction Costs

ETFs are free to trade at many brokers and custodians, so VOO should be free to trade in most cases. Additionally, it is among the largest ETFs and is very liquid. The bid-ask spread of VOO is about .01%, so individual investor trades will not generally be large enough to impact or move the market.

VOO Tax Efficiency

Like most index funds, VOO is very tax-efficient. Unlike actively-managed funds, passively-managed index funds typically have less trading and lower turnover. This results in fewer taxable events and higher tax efficiency.

ETFs are typically more tax-efficient than mutual funds, due to their ability to avoid realizing capital gains through like-kind redemptions (a process that is beyond the scope of this post). VOO has never made a capital gains distribution, so VOO is about as tax-efficient as any fund can be.

Investors in a high tax bracket with at least $250,000 may consider direct indexing rather than VOO, as direct indexing can potentially generate even more tax savings.

VOO Review: A Recap

The above review of VOO illustrates that VOO is a well-constructed, low-cost and tax-efficient index fund that provides diversified exposure to the US stock market. VOO is a great choice in many situations and a tool that I often use personally and professionally.

FAQs

ACWI ETF Review: Is ACWI A Good ETF To Invest In?

The iShares MSCI ACWI ETF (symbol: ACWI) is one of the largest exchange-traded funds (ETFs) in the market and widely used by investors for exposure to global stocks. ACWI is a low-cost index fund, which tracks the MSCI ACWI (All Country World Index) Index. As its name implies, it seeks to provide exposure to the global stock market in a single vehicle. The fund is the core of many portfolios and the below review of ACWI will evaluate why that is.

A quick reminder that this site does NOT provide investment recommendations. Fund reviews (such as this one) are for educational purposes only and are not advice or recommendations.

ACWI Performance

The first thing most investors want to know about is performance, so we will start there. According to Bloomberg, since the fund’s inception 15 years ago, ACWI has returned over 6% per year. Of course, this figure can go up or down and the returns in any single year are unlikely to be 6%. From 2009 through 2022 (14 years), ACWI was up in 10 years and down in 4 years. The average return in the up years was 18.2%, while the average return in the down years was -9.4%.

ACWI ETF performance since inception, as of March 31, 2023
Source: ThoughtfulFinance.com, Bloomberg

ACWI Risks

ACWI owns stocks which are more volatile than cash or bonds. While the returns are higher than cash or bonds, investors need to be prepared to stomach volatility and be able to hold for the longer-term. ACWI was down over 55% during the global financial crisis in 2007-2009 and dropped by a third during the covid pandemic. This is not necessarily worse than other similar funds, but it is a characteristic of stocks that investors need to be aware of.

ACWI Portfolio

Fund performance is ultimately driven by a fund’s holdings and exposures, so our ACWI review will examine these items.

ACWI Holdings

ACWI (and its underlying index) is incredibly diversified, holding over 2,000 stocks. This represents quite a bit of the global investable market.

ACWICRSP US Total Market Index
Number of Stocks2,3752,884
Sources: ThoughtfulFinance.com, iShares, MSCI (as of 3/31/2023)

ACWI Country Exposures

ACWI only stocks in dozens of countries, including both developed and emerging markets. Below are the top 10 country exposures, which is consistent with global market capitalizations.

United States60.25%
Japan5.45%
UK3.74%
China3.57%
France3.19%
Canada2.95%
Switzerland2.53%
Germany2.17%
Australia1.90%
Taiwan1.67%
Source: ThoughtfulFinance.com, iShares.com (as of 3/31/2023)

ACWI Market Cap Exposure

ACWI is a global fund which seeks to represent the global stock market, which is predominantly composed of large-caps. Even though the fund holds mid-caps, performance is primarily driven by the large-cap exposure.

ACWI
Large-Cap84%
Mid-Cap16%
Small-Cap0%
Source: ThoughtfulFinance.com, Morningstar; data as of 3/31/2023

ACWI Sector Exposures

ACWI is extremely diversified across sectors and mirrors the approximate weights of the broad US stock market.

ACWI
Basic Materials4.67%
Consumer Cyclical10.63%
Financial Services15.23%
Real Estate2.53%
Communication Services7.33%
Energy4.93%
Industrials10.29%
Technology20.95%
Consumer Defensive7.79%
Healthcare12.70%
Utilities2.94%
Source: ThoughtfulFinance.com, Morningstar; data as of 5/9/2023

Expenses

No review of ACWI would be complete without an in-depth look at the explicit and implicit costs of trading and holding ACWI.

ACWI Expense Ratio

ACWI’s expense ratio of .32% is not especially low for an index ETF, but it is a global fund (and ETFs with international holdings generally cost more) and has very few competitors. Of course, it may be difficult to get global exposure in a single ETF for much cheaper.

ACWI Transaction Costs

ETFs are free to trade at many brokers and custodians, so ACWI should be free to trade in most cases. Additionally, it is among the largest ETFs and is very liquid. The bid-ask spread of ACWI is about .01%, so individual investor trades will not generally be large enough to impact or move the market.

ACWI Tax Efficiency

Like most index funds, ACWI is very tax-efficient. Unlike actively-managed funds, passively-managed index funds typically have less trading and lower turnover. This results in fewer taxable events and higher tax efficiency.

ETFs are typically more tax-efficient than mutual funds, due to their ability to avoid realizing capital gains through like-kind redemptions (a process that is beyond the scope of this post). ACWI has never made a capital gains distribution, so ACWI is about as tax-efficient as any fund can be.

Investors in a high tax bracket with at least $250,000 may consider direct indexing rather than ACWI, as direct indexing can potentially generate even more tax savings.

ACWI Review: A Recap

The above review of ACWI illustrates that ACWI is a well-constructed, low-cost and tax-efficient index fund that provides diversified exposure to the global stock market. Investors looking to own the global stock market in a single ETF should consider ACWI.

FAQ’s

Is ACWI a good investment?

Whether ACWI is a good investment or not depends on the definition of “good investment.” If the definition is something that goes up in value, then nobody knows if it is a good investment. If the definition is a well-constructed portfolio that is low-cost and will likely do what it is supposed to do (mirror the global stock market), then yes it is a good investment.

Is ACWI safe long-term?

There is no way to say whether ACWI or any other investment is safe long-term. ACWI owns stocks, which are more volatile than cash or bonds. However, stocks have generated stronger long-term returns than cash or bonds. However, the future may unfold differently than the past, so it is impossible to say whether ACWI is safe in the long-term.

Is ACWI a risky investment?

ACWI owns stocks, which are more volatile than cash or bonds. Some of this risk is diversified away since ACWI owns thousands of stocks, so there is not too much risk or concentration in any single stock. ACWI is a well-diversified, low-cost index fund, so it is not any more risky than most stock funds.

Is ACWI a buy or sell right now?

Nobody knows the future nor whether ACWI is a buy or sell. ACWI is an index fund and many investors use index funds because they do not believe that investors can consistently time the market or predict the ideal times to buy and sell.

Is ACWI a good ETF to invest in?

The answer to this question depends on each investors’ goals. Investors looking for well-diversified, low-cost, tax-efficient exposure to the global stock market will find a lot to like in ACWI. However, ACWI is not a good ETF to invest in for those looking for something totally different.

Is ACWI good for beginners?

For investors looking for exposure to the broad global stock market, ACWI is not a bad choice. It can be the core position of a portfolio and provides instant diversification to investors who are building a portfolio.

Does ACWI pay dividends?

Yes, ACWI pays dividends. It is not necessarily a dividend-oriented fund and I would advise investors to focus on total return since dividends reduce a fund’s net asset value. In my view, receiving a dividend is equivalent to selling a small amount of the position. Investors should not focus on ACWI’s dividends or dividend yield.

FXAIX Review: Is FXAIX A Good Investment?

The Fidelity 500 Index Fund (symbol: FXAIX) is one of the largest mutual funds in the market. FXAIX is a low-cost index fund, which tracks the S&P 500 and seeks to provide exposure to the US stock market at a very low price. The fund is the core of many portfolios and the below review of FXAIX will evaluate why that is.

A quick reminder that this site does NOT provide investment recommendations. Fund reviews (such as this one) are for educational purposes only and are not advice or recommendations.

FXAIX Performance

The first thing most investors want to know about is performance, so we will start there. According to Bloomberg, since the fund’s inception 35 years ago, FXAIX has returned over 10% per year. Of course, this figure can go up or down and the returns in any single year are unlikely to be 8%. From 1990 through 2022 (32 years), FXAIX was up in 26 years and down in 6 years. The average return in the up years was 18.3%, while the average return in the down years was -17.2%.

FXAIX performance since inception, as of May 1, 2023.
Source: ThoughtfulFinance.com, Bloomberg

FXAIX Risks

FXAIX owns stocks which are more volatile than cash or bonds. While the returns are higher than cash or bonds, investors need to be prepared to stomach volatility and be able to hold for the longer-term. FXAIX was down nearly 50% during the tech crash and down over 55% during the global financial crisis from 2007-2009! This is not necessarily worse than other similar funds, but it is a characteristic of stocks that investors need to be aware of.

FXAIX Portfolio

Fund performance is ultimately driven by a fund’s holdings and exposures, so our FXAIX review will examine these items.

FXAIX Holdings

FXAIX (and its underlying index) is well diversified, holding over 500 stocks that are representative of the US stock market.

FXAIXS&P 500
Number of Stocks506506
Sources: ThoughtfulFinance.com, Fidelity (as of 3/31/2023)

FXAIX Country Exposures

FXAIX only owns US-based companies. Investors looking for international exposure may pair FXAIX with international funds or simply hold a global fund.

FXAIX Market Cap Exposure

FXAIX is a large-cap fund that seeks to represent the largest names in the US stock market, which are predominantly composed of large-caps. Even though the fund holds mid-caps, performance is primarily driven by the large-cap exposure.

FXAIX
Large-Cap84%
Mid-Cap16%
Small-Cap0%
Source: ThoughtfulFinance.com, Morningstar; data as of 3/31/2023

FXAIX Sector Exposures

FXAIX is extremely diversified across sectors and mirrors the approximate weights of the broad US stock market.

FXAIX
Basic Materials2.38%
Consumer Cyclical10.41%
Financial Services12.45%
Real Estate2.64%
Communication Services8.11%
Energy4.61%
Industrials8.42%
Technology26.66%
Consumer Defensive7.18%
Healthcare14.27%
Utilities2.86%
Source: ThoughtfulFinance.com, Morningstar; data as of 3/31/2023

Expenses

No review of FXAIX would be complete without an in-depth look at the explicit and implicit costs of trading and holding FXAIX.

FXAIX Expense Ratio

FXAIX’s expense ratio of .015% is among the lowest of any mutual funds. Even if another fund is free, one and a half basis points is not a material difference in my opinion.

FXAIX Transaction Costs

While ETFs are free to trade at many brokers and custodians, mutual funds often incur trading fees still. FXAIX should be free to trade in Fidelity accounts, but will likely cost money to buy or sell anywhere else. Investors planning to make small or frequent trades may want to consider using an ETF instead of a mutual fund. Readers may consider VOO or IVV.

FXAIX Tax Efficiency

Like most index funds, FXAIX is very tax-efficient. Unlike actively-managed funds, passively-managed index funds typically have less trading and lower turnover. This results in fewer taxable events and higher tax efficiency.

Investor looking for even more tax-efficiency may want to consider using an ETF, since they are typically more tax-efficient than mutual funds due to their ability to avoid realizing capital gains through like-kind redemptions (a process that is beyond the scope of this post).

Investors in a high tax bracket with at least $250,000 may consider direct indexing rather than FXAIX, as direct indexing can potentially generate even more tax savings.

FXAIX Review: A Recap

The above review of FXAIX illustrates that FXAIX is a well-constructed, low-cost and tax-efficient index fund that provides diversified exposure to the US stock market. FXAIX is a great choice in many situations if your account is at Fidelity. Personally, I would probably not consider this fund unless my account was at Fidelity.

FAQ’s

VTI Review: Is VTI a Good Investment?

The Vanguard Total Stock Market ETF (symbol: VTI) is one of the largest exchange-traded funds (ETFs) in the market and widely used by both individual and institutional investors. VTI is a low-cost index fund, which tracks the CRSP US Total Market. As its name implies, it seeks to provide exposure to the broad US stock market at a very low price. The fund is the core of many portfolios and the below review of VTI will evaluate why that is.

A quick reminder that this site does NOT provide investment recommendations. Fund reviews (such as this one) are for educational purposes only and are not advice or recommendations.

VTI Performance

The first thing most investors want to know about is performance, so we will start there. According to Bloomberg, since the fund’s inception 22 years ago, VTI has returned nearly 8% per year. Of course, this figure can go up or down and the returns in any single year are unlikely to be 8%. From 2002 through 2022 (21 years), VTI was up in 17 years and down in 4 years. The average return in the up years was 17.2%, while the average return in the down years was -20.5%.

VTI performance since inception, as of April 30, 2023.
Source: ThoughtfulFinance.com, Bloomberg

VTI Risks

VTI owns stocks which are more volatile than cash or bonds. While the returns are higher than cash or bonds, investors need to be prepared to stomach volatility and be able to hold for the longer-term. VTI was down over 35% during both the tech crash and during the covid pandemic. Between 2007 and 2009, the fund declined by over 55%! This is not necessarily worse than other similar funds, but it is a characteristic of stocks that investors need to be aware of.

VTI Portfolio

Fund performance is ultimately driven by a fund’s holdings and exposures, so our VTI review will examine these items.

VTI Holdings

VTI (and its underlying index) is incredibly diversified, holding nearly 4,000 stocks. This represents the vast majority of the US stock market.

VTICRSP US Total Market Index
Number of Stocks3,9073,890
Sources: ThoughtfulFinance.com, Vanguard (as of 3/31/2023)

VTI Country Exposures

VTI only owns US-based companies. Investors looking for international exposure may pair VTI with international ETFs or simply hold a global ETF.

VTI Market Cap Exposure

VTI is a “total market” fund which seeks to represent the entire US stock market, which is predominantly composed of large-caps. Even though the fund holds mid-caps and small-caps, performance is primarily driven by the large-cap exposure. This dynamic can be found by comparing VTI to SPY (a large-cap fund).

VTI
Large-Cap73%
Mid-Cap19%
Small-Cap8%
Source: ThoughtfulFinance.com, Morningstar; data as of 12/31/2022

VTI Sector Exposures

VTI is extremely diversified across sectors and mirrors the approximate weights of the broad US stock market.

VTI
Basic Materials2.65%
Consumer Cyclical9.77%
Financial Services13.93%
Real Estate3.51%
Communication Services6.71%
Energy5.15%
Industrials10.07%
Technology22.48%
Consumer Defensive6.98%
Healthcare15.69%
Utilities3.07%
Source: ThoughtfulFinance.com, Morningstar; data as of 12/31/2022

Expenses

No review of VTI would be complete without an in-depth look at the explicit and implicit costs of trading and holding VTI.

VTI Expense Ratio

VTI’s expense ratio of .03% is among the lowest of any total market funds. Even if another fund is free, three basis points is not a material difference in my opinion.

VTI Transaction Costs

ETFs are free to trade at many brokers and custodians, so VTI should be free to trade in most cases. Additionally, it is among the largest ETFs and is very liquid. The bid-ask spread of VTI is about .01%, so individual investor trades will not generally be large enough to impact or move the market.

VTI Tax Efficiency

Like most index funds, VTI is very tax-efficient. Unlike actively-managed funds, passively-managed index funds typically have less trading and lower turnover. This results in fewer taxable events and higher tax efficiency.

ETFs are typically more tax-efficient than mutual funds, due to their ability to avoid realizing capital gains through like-kind redemptions (a process that is beyond the scope of this post). VTI has never made a capital gains distribution, so VTI is about as tax-efficient as any fund can be.

Investors in a high tax bracket with at least $250,000 may consider direct indexing rather than VTI, as direct indexing can potentially generate even more tax savings.

VTI Review: A Recap

The above review of VTI illustrates that VTI is a well-constructed, low-cost and tax-efficient index fund that provides diversified exposure to the broad US stock market. VTI is a great choice in many situations and a tool that I often use personally and professionally.

FAQ’s

Scroll to Top