The MSCI Emerging Markets Index and the MSCI Emerging Markets Index Investable Market Index (IMI) are two of the most followed emerging markets indices. Many portfolios and investment vehicles are benchmarked to each index.
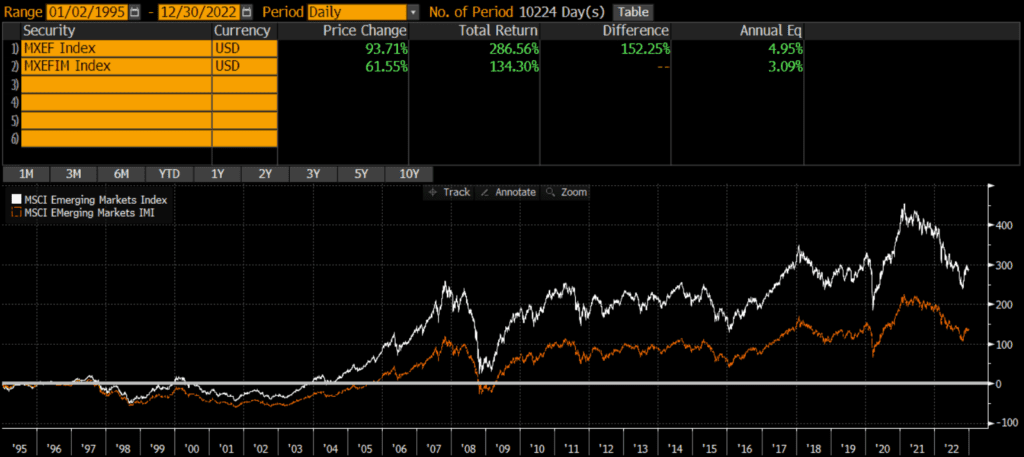
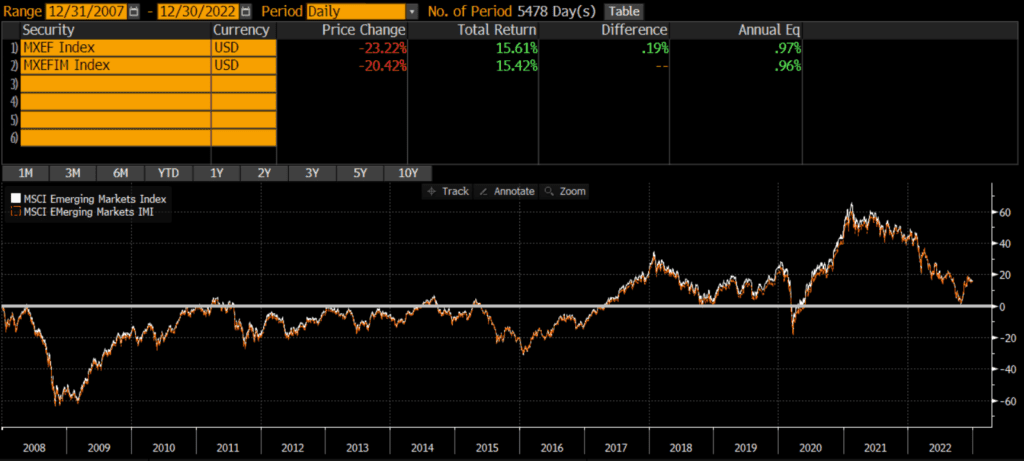
The MSCI EM Index and the MSCI EM IMI have some slight differences, but performance has been nearly identical. The below performance chart of the MSCI EM and MSCI EM IMI illustrates that the MSCI Emerging Markets Index has outperformed the IMI version on a backtested basis. However, returns since the MSCI EM IMI’s inception have been nearly identical. This similar to the findings in my analysis of the Russell 1000 vs S&P 500.
A quick note that investors cannot invest directly in an index. These unmanaged indexes do not reflect management fees and transaction costs that are associated with an investable vehicle, such as the iShares Emerging Markets ETF (symbol: EEM) or the iShares Core Emerging Markets ETF (symbol: IEMG). A reminder that these are simply examples as this site does NOT provide investment recommendations.
What is the MSCI Emerging Markets IMI Index?
The MSCI Emerging Markets Investable Market Index (IMI) is similar to the traditional MSCI Emerging Markets Index (non-IMI), but it has many more constituent stocks and includes more exposure to mid-caps and small-caps.
What is the difference between MSCI EM and MSCI EM IMI?
The MSCI Emerging Markets IMI (Investable Market Index) is similar to the traditional MSCI Emerging Markets Index (non-IMI), but it has many more constituent stocks and includes more exposure to mid-caps and small-caps.
What does MSCI Emerging Markets IMI mean?
The IMI in “MSCI Emerging Markets IMI” stands for “Investable Market Index” and connotes that it includes more stocks than the original Emerging Markets index.
Historical Performance: MSCI Emerging Market Index vs MSCI Emerging Market IMI
The MSCI Emerging Markets Index was launched way back in 1987, while the MSCI Emerging Markets IMI Index was launched 20 years later in 2007. However, MSCI has provided backtested data that goes back about a dozen years before that. Since 1995, the MSCI Emerging Markets Index has outperformed the MSCI Emerging Markets IMI Index by about 1.85% per year (4.95% vs 3.09%, respectively). The cumulative performance differential over that time period has been over 150%!

However, when we chart the performance of MSCI EM vs MSCI EM IMI since 2007 (below), we find that performance has been identical: .97% vs .96% annualized. The cumulative performance difference is less than .2%! I haven’t yet dug into the why this is (technically called performance attribution analysis), but it is a topic for future research. In the meantime, it is clear that the indices have performed identically since their common inception in 2007.

I’ve seen a similar dynamic (albeit for a different reason) between emerging and developed markets.
Composition Differences: MSCI Emerging Markets Index vs MSCI Emerging Markets IMI
Both the MSCI EM vs MSCI EM IMI indices are broad-based indices that represent emerging market equity markets. The indices have very similar geographic exposures, similar sector weights, and slightly different market cap exposures.
Geography
The MSCI EM index and the EM IMI have identical country constituents, although the weight vary ever so slightly. Below are the weights of the top five countries.
| MSCI Emerging Markets Index | MSCI Emerging Markets Investable Market Index | |
| China | 32.31 | 29.39 |
| India | 14.44 | 15.56 |
| Taiwan | 13.81 | 14.56 |
| South Korea | 11.32 | 11.65 |
| Brazil | 5.27 | 5.32 |
Market Capitalization
One of the main differences between the two indices is that the MSCI Emerging Markets Investable Markets Index (IMI) has many more constituents that the original MSCI Emerging Markets Index. According to MSCI, the number of constituents is as follows:
| MSCI Emerging Markets Index | MSCI Emerging Markets IMI Index | |
| Constituent Stocks | 1,377 | 3,204 |
Additionally, the two indices have slightly different market cap exposures. Using the iShares Emerging Markets ETF (which tracks the MSCI EM Index) (symbol EEM) and the iShares Core Emerging Markets ETF (which tracks the MSCI EM IMI Index) (symbol IEMG) as proxies, we can infer the below market cap weights of each index.
| MSCI Emerging Markets Index | MSCI Emerging Markets IMI Index | |
| Large Cap | 85% | 79% |
| Mid Cap | 10% | 17% |
| Small Cap | 0% | 5% |
Sector Weights
Again, using EEM and IEMG as proxies, we can infer the index weights are relatively close to one another.
| MSCI Emerging Markets IMI | MSCI Emerging Markets Index | |
| Basic Materials | 9.30% | 8.91% |
| Consumer Cyclical | 13.47% | 13.82% |
| Financial Services | 20.05% | 21.42% |
| Real Estate | 2.54% | 1.95% |
| Communication Services | 9.98% | 10.78% |
| Energy | 4.51% | 4.82% |
| Industrials | 7.20% | 5.78% |
| Technology | 18.80% | 19.08% |
| Consumer Defensive | 6.15% | 6.14% |
| Healthcare | 5.04% | 4.37% |
| Utilities | 2.96% | 2.93% |
Final Thoughts on MSCI EM Index vs MSCI EM IMI
Investors cannot invest in indices directly and should do their own research before deciding to invest in a fund that tracks either index. That being said, these two indices appear nearly identical in terms of geographic, market cap, and sector exposure. For all intents and purposes, I would argue that these two benchmarks are interchangeable, despite the wide historical performance difference prior to 2007.
With such a small performance difference, the costs of actual investment strategies/vehicles may be a larger consideration than which benchmark to select. Sometimes benchmark selection matters quite a bit, although that does not appear to be the case between these two indices.