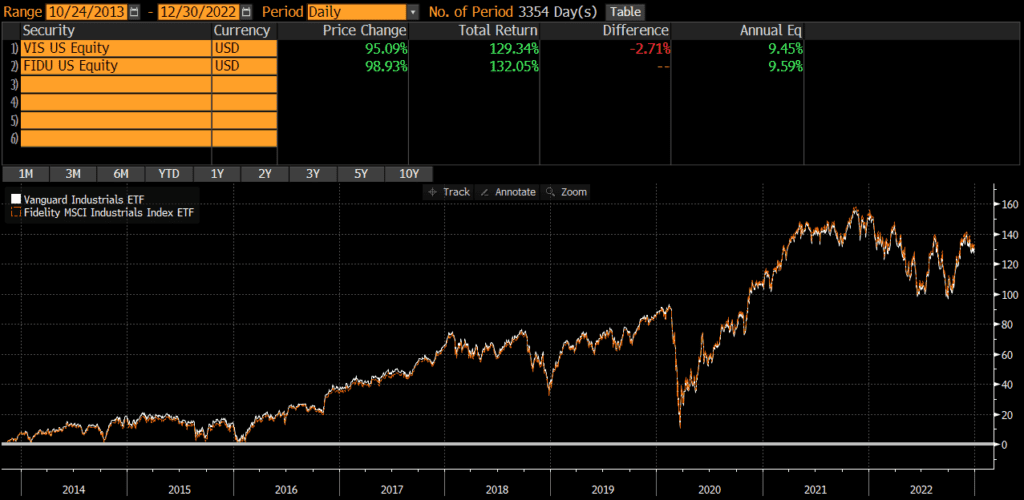
The Vanguard Industrials Index Fund ETF (VIS) and the Fidelity MSCI Industrials Index ETF (FIDU) are two of the largest industrials sector ETFs and two of the most popular among individual investors. Many investors compare VIS vs FIDU because they are so similar, although differences are difficult to find.
VIS and FIDU track the same index and there is no material difference between the funds. They are identical and interchangeable in my opinion.
The Longer Answer
Historical Performance: VIS vs FIDU
VIS was launched back in 2004, while FIDU was launched on October 21, 2013. Since then, the two funds have performed identically, with an annualized difference of only .14%! The cumulative performance differential over that timeframe has only been about 2.7% too! From a performance perspective, VIS and FIDU are identical and interchangeable.
Portfolio Exposures: VIS vs FIDU
Both VIS and FIDU track the same index, the MSCI US Investable Market Industrials 25/50 Index. Consequently, the two funds have identical geographic, market-cap, and industry exposures.
Geographic Exposure
Both VIS and FIDU hold essentially 100% stocks, so I will not dig into country exposures or market classification here. For all intents and purposes, the two funds have identical geographic exposures.
Market Cap Exposure
As mentioned above, both funds track the same index and have materially identical market cap exposures.
Sector Exposure
VIS and FIDU are industrials ETFs and so their holdings are 100% industrials stocks.
Practical Factors: VIS vs FIDU
Transaction Costs
As ETFs, both FIDU and VIS are free to trade on many platforms. Bid-ask spreads for both VIS and FIDU are extremely low and volume is sufficient to prevent most individual investors from “moving the market.”
Expenses
FIDU has a lower expense ratio at .08%, compared to VIS’s .10%. Although VIS is 25% more expensive, we’re talking about 2 basis points. At these low levels of expense ratios, the difference doesn’t matter.
Tax Efficiency & Capital Gain Distributions
Neither VIS nor FIDU has ever made a capital gains distribution and I do not expect them to make any moving forward. In my opinion, these two funds are equally tax-efficient.
From a tax-loss harvesting perspective, investors may want to avoid using these two funds as substitutes for one another since they could be considered “substantially identical” (given that they track the same index and are identical in many ways).
Bottom Line: VIS vs FIDU
VIS and FIDU are identical in nearly every way. I would not spend any time comparing them or trying to decide which is better.
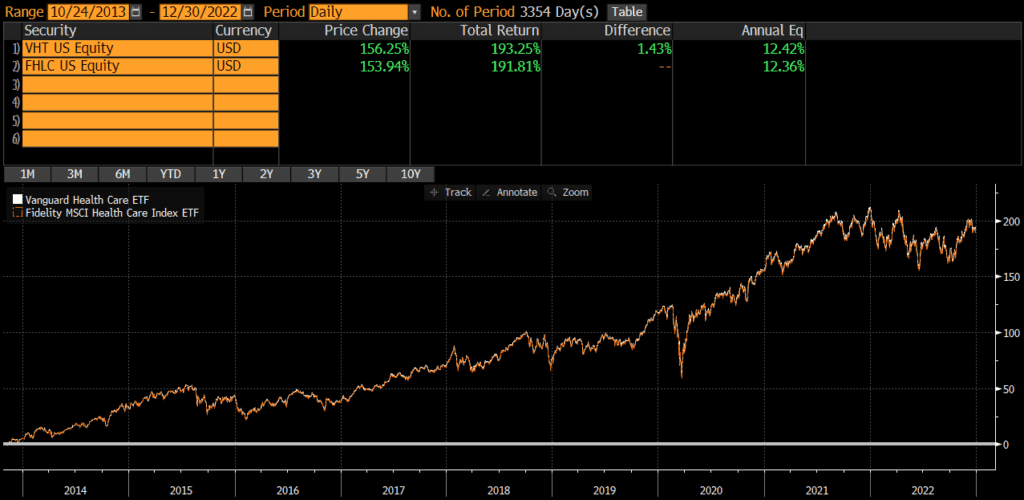
The Vanguard Health Care Index Fund ETF (VHT) and the Fidelity MSCI Health Care Index ETF (FHLC) are two of the largest health care sector ETFs and two of the most popular among individual investors. Many investors compare VHT vs FHLC because they are so similar, although differences are difficult to find.
VHT and FHLC track the same index and there is no material difference between the funds. They are identical and interchangeable in my opinion.
The Longer Answer
Historical Performance: VHT vs FHLC
VHT was launched back in 2004, while FHLC was launched on October 21, 2013. Since then, the two funds have performed identically, with an annualized difference of only .06%! The cumulative performance differential over that timeframe has only been about 1.4% too! From a performance perspective, VHT and FHLC are identical and interchangeable.
Portfolio Exposures: VHT vs FHLC
Both VHT and FHLC track the same index, the MSCI US Investable Market Health Care 25/50 Index. Consequently, the two funds have identical geographic, market-cap, and industry exposures.
Geographic Exposure
Both VHT and FHLC hold essentially 100% stocks, so I will not dig into country exposures or market classification here. For all intents and purposes, the two funds have identical geographic exposures.
Market Cap Exposure
As mentioned above, both funds track the same index and have materially identical market cap exposures.
Sector Exposure
VHT and FHLC are health care ETFs and so their holdings are 100% health care stocks.
Practical Factors: VHT vs FHLC
Transaction Costs
As ETFs, both FHLC and VHT are free to trade on many platforms. Bid-ask spreads for both VHT and FHLC are extremely low and volume is sufficient to prevent most individual investors from “moving the market.”
Expenses
FHLC has a lower expense ratio at .08%, compared to VHT’s .10%. Although VHT is 25% more expensive, we’re talking about 2 basis points. At these low levels of expense ratios, the difference doesn’t matter.
Tax Efficiency & Capital Gain Distributions
Neither VHT nor FHLC has ever made a capital gains distribution and I do not expect them to make any moving forward. In my opinion, these two funds are equally tax-efficient.
From a tax-loss harvesting perspective, investors may want to avoid using these two funds as substitutes for one another since they could be considered “substantially identical” (given that they track the same index and are identical in many ways). There are other health care ETFs out there and those interested might want to read my comparison of VHT vs XLV (State Street’s health care ETF).
Bottom Line: VHT vs FHLC
VHT and FHLC are identical in nearly every way. I would not spend any time comparing them or trying to decide which is better.
Investors looking for a mutual fund should read my post of VHT vs VHCIX (VHT’s mutual fund share class).
The Vanguard Financials Index Fund ETF (VFH) and the Fidelity MSCI Financials Index ETF (FNCL) are two of the largest financials sector ETFs and two of the most popular among individual investors. Many investors compare VFH vs FNCL because they are so similar, although differences are difficult to find.
VFH and FNCL track the same index and there is no material difference between the funds. They are identical and interchangeable in my opinion.
The Longer Answer
Historical Performance: VFH vs FNCL
VFH was launched back in 2004, while FNCL was launched on October 21, 2013. Since then, the two funds have performed identically, with an annualized difference of only .02%! The cumulative performance differential over that timeframe has only been about .45% too! From a performance perspective, VFH and FNCL are identical and interchangeable.
Portfolio Exposures: VFH vs FNCL
Both VFH and FNCL track the same index, the MSCI US Investable Market Financials 25/50 Index. Consequently, the two funds have identical geographic, market-cap, and industry exposures.
Geographic Exposure
Both VFH and FNCL hold essentially 100% stocks, so I will not dig into country exposures or market classification here. For all intents and purposes, the two funds have identical geographic exposures.
Market Cap Exposure
As mentioned above, both funds track the same index and have materially identical market cap exposures.
Sector Exposure
VFH and FNCL are financial sector ETFs and so their holdings are 100% financials stocks.
Practical Factors: VFH vs FNCL
Transaction Costs
As ETFs, both FNCL and VFH are free to trade on many platforms. Bid-ask spreads for both VFH and FNCL are extremely low and volume is sufficient to prevent most individual investors from “moving the market.”
Expenses
FNCL has a lower expense ratio at .08%, compared to VFH’s .10%. Although VFH is 25% more expensive, we’re talking about 2 basis points. At these low levels of expense ratios, the difference doesn’t matter.
Tax Efficiency & Capital Gain Distributions
Neither VFH nor FNCL has ever made a capital gains distribution and I do not expect them to make any moving forward. In my opinion, these two funds are equally tax-efficient.
From a tax-loss harvesting perspective, investors may want to avoid using these two funds as substitutes for one another since they could be considered “substantially identical” (given that they track the same index and are identical in many ways). Investors may want to consider State Street’s ETF XLF and should read my comparison of VFH vs XLF.
Bottom Line: VFH vs FNCL
VFH and FNCL are identical in nearly every way. I would not spend any time comparing them or trying to decide which is better.
Investors looking for a mutual fund should read my comparison of VFH vs VFAIX (which is the mutual fund share class of VFH).
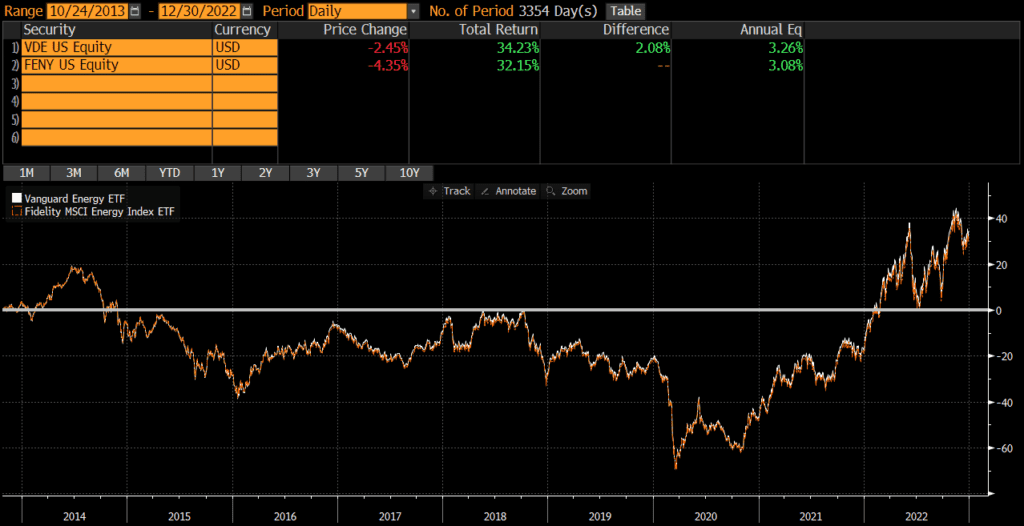
The Vanguard Energy Index Fund ETF (VDE) and the Fidelity MSCI Energy Index ETF (FENY) are two of the largest energy sector ETFs and two of the most popular among individual investors. Many investors compare VDE vs FENY because they are so similar, although differences are difficult to find.
VDE and FENY track the same index and there is no material difference between the funds. They are identical and interchangeable in my opinion.
The Longer Answer
Historical Performance: VDE vs FENY
VDE was launched back in 2004, while FENY was launched on October 21, 2013. Since then, the two funds have performed identically, with an annualized difference of only .16%! The cumulative performance differential over that timeframe has only been about 2% too! From a performance perspective, VDE and FENY are identical and interchangeable.
Portfolio Exposures: VDE vs FENY
Both VDE and FENY track the same index, the MSCI US Investable Market Energy 25/50 Index. Consequently, the two funds have identical geographic, market-cap, and industry exposures.
Geographic Exposure
Both VDE and FENY hold essentially 100% stocks, so I will not dig into country exposures or market classification here. For all intents and purposes, the two funds have identical geographic exposures.
Market Cap Exposure
As mentioned above, both funds track the same index and have materially identical market cap exposures.
Sector Exposure
VDE and FENY are energy ETFs and so their holdings are 100% energy stocks.
Practical Factors: VDE vs FENY
Transaction Costs
As ETFs, both FENY and VDE are free to trade on many platforms. Bid-ask spreads for both VDE and FENY are extremely low and volume is sufficient to prevent most individual investors from “moving the market.”
Expenses
FENY has a lower expense ratio at .08%, compared to VDE’s .10%. Although VDE is 25% more expensive, we’re talking about 2 basis points. At these low levels of expense ratios, the difference doesn’t matter.
Tax Efficiency & Capital Gain Distributions
Neither VDE nor FENY has ever made a capital gains distribution and I do not expect them to make any moving forward. In my opinion, these two funds are equally tax-efficient.
From a tax-loss harvesting perspective, investors may want to avoid using these two funds as substitutes for one another since they could be considered “substantially identical” (given that they track the same index and are identical in many ways).
Bottom Line: VDE vs FENY
VDE and FENY are identical in nearly every way. I would not spend any time comparing them or trying to decide which is better.
Investors considering other energy ETFs should read my post comparing VDE vs XLE (State Street’s energy ETF). Those looking for a mutual fund should read about VDE vs VENAX (VDE’s mutual fund share class).
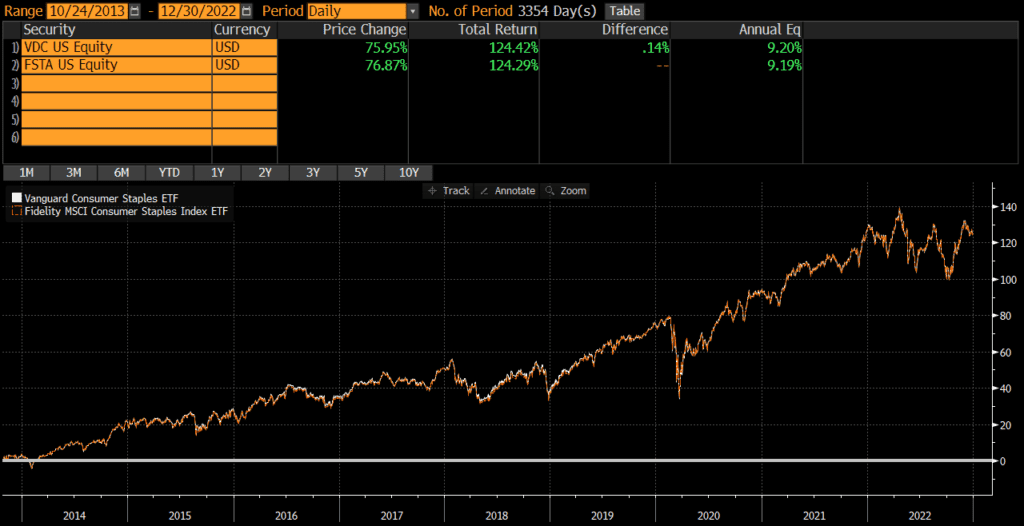
The Vanguard Consumer Staples Index Fund ETF (VDC) and the Fidelity MSCI Consumer Staples Index ETF (FSTA) are two of the largest consumer staples sector ETFs and two of the most popular among individual investors. Many investors compare VDC vs FSTA because they are so similar, although differences are difficult to find.
VDC and FSTA track the same index and there is no material difference between the funds. They are identical and interchangeable in my opinion.
The Longer Answer
Historical Performance: VDC vs FSTA
VDC was launched back in 2004, while FSTA was launched on October 21, 2013. Since then, the two funds have performed identically, with an annualized difference of only .01%! The cumulative performance differential over that timeframe has only been .14% too! From a performance perspective, VDC and FSTA are identical and interchangeable.
Portfolio Exposures: VDC vs FSTA
Both VDC and FSTA track the same index, the MSCI US Investable Market Consumer Staples 25/50 Index. Consequently, the two funds have identical geographic, market-cap, and industry exposures.
Geographic Exposure
Both VDC and FSTA hold essentially 100% stocks, so I will not dig into country exposures or market classification here. For all intents and purposes, the two funds have identical geographic exposures.
Market Cap Exposure
As mentioned above, both funds track the same index and have materially identical market cap exposures.
Sector Exposure
VDC and FSTA are consumer staples ETFs and so their holdings are 100% consumer staples stocks.
Practical Factors: VDC vs FSTA
Transaction Costs
As ETFs, both FSTA and VDC are free to trade on many platforms. Bid-ask spreads for both VDC and FSTA are extremely low and volume is sufficient to prevent most individual investors from “moving the market.”
Expenses
FSTA has a lower expense ratio at .08%, compared to VDC’s .10%. Although VDC is 25% more expensive, we’re talking about 2 basis points. At these low levels of expense ratios, the difference doesn’t matter.
Tax Efficiency & Capital Gain Distributions
VDC has not made a capital gains distribution since 2004 and I do not expect it to make any moving forward. FSTA has never made a capital gain distribution. In my opinion, these two funds are equally tax-efficient.
From a tax-loss harvesting perspective, investors may want to avoid using these two funds as substitutes for one another since they could be considered “substantially identical” (given that they track the same index and are identical in many ways).
Bottom Line: VDC vs FSTA
VDC and FSTA are identical in nearly every way. I would not spend any time comparing them or trying to decide which is better.
Investors interested in other consumer staple ETFs may want to check out my comparison of VDC vs XLP (State Street’s consumer staple ETF). Investors looking for a mutual fund should read my post of VDC’s mutual fund share class VCSAX.
The Vanguard 500 Index Fund (VFIAX) and the Blackrock iShares Core S&P Total Stock Market ETF (ITOT) are two of the largest index mutual funds in existence and easily two of the most popular among individual investors. VFIAX and ITOT form the core of many investor portfolios and many investors compare VFIAX vs ITOT in order to decide which should be the foundation of their portfolio.
There are two main differences between the funds. VFIAX is a mutual fund that holds large-caps and mid-caps, while ITOT is a total market ETF that includes small-caps. However, these are not major differences and investors should look at additional factors when deciding between the two funds.
The Longer Answer
Historical Performance: VFIAX vs ITOT
VFIAX was launched in late 2000, while ITOT was launched in January 2004. Since their common inception date, the performance difference has only been .12%. This difference has compounded over time and the cumulative performance differential over this time period is approximately 10%.
Selecting VFIAX vs ITOT is (at least partially) a bet on whether large-caps or small-caps will outperform in the future (although even a correct prediction will not make much of a difference since performance is pretty similar).
Portfolio Exposures: VFIAX vs ITOT
Geographic Exposure
Both VFIAX and ITOT hold essentially 100% stocks, so I will not dig into country exposures or market classification here. For all intents and purposes, the two funds have identical exposures.
Market Cap Exposure
VFIAX tracks the S&P 500 index and so it mostly holds large-caps with a bit of mid-cap exposure. ITOT tracks the broader S&P Total Stock Market Index and so it owns many more mid-caps and small-caps. In other words, VFIAX is a large-cap vehicle and ITOT is a total market vehicle. That being said, due to market cap weighting, both funds are overwhelmingly weighted towards large-caps.
VFIAX
ITOT
Large-Cap
85%
72%
Mid-Cap
16%
19%
Small-Cap
0%
9%
Source: ThoughtfulFinance.com, Morningstar (data as of 1/31/2023)
Sector Weights
Despite the differences in market cap exposures, the sector exposures between the two funds is nearly identical as shown below.
VFIAX
ITOT
Basic Materials
2.52%
2.72%
Consumer Cyclical
10.38%
10.72%
Financial Services
13.99%
14.04%
Real Estate
2.88%
3.59%
Communication Services
7.83%
7.22%
Energy
5.06%
4.85%
Industrials
8.76%
9.61%
Technology
23.76%
23.60%
Consumer Defensive
7.13%
6.48%
Healthcare
14.75%
14.40%
Utilities
2.94%
2.76%
Source: ThoughtfulFinance.com, Morningstar (data as of 1/31/2023)
Factors to Consider
Expenses
Some investors may point out that the expense ratios between VFIAX and ITOT differ. This is true, but at a certain level, differences in expense ratio do not matter that much. In this case, the VFIAX’s expense ratio of .04% is 25% higher than ITOT’s .03% expense ratio. However, we’re talking about 1 basis point, so even though VFIAX is 25% more expensive than ITOT, it is inconsequential.
Transaction Costs
ETFs are free to trade at many brokers and custodians, including Vanguard. However, many brokers and custodians still charge commissions and/or transaction fees to buy/sell mutual funds. To my knowledge, Vanguard does not participate in the pay-to-play arrangements (with their competitor custodians) that would allow their mutual funds to trade for free on many platforms. So if an investor account is at Vanguard, it is generally free to trade VFIAX or ITOT. However, only ITOT is free to trade in many non-Vanguard accounts.
There is a bid-ask spread when trading ETFs, but this spread is typically less than .01% for ITOT and individual investor trades will not generally be large enough to “move” the market. In the case of ITOT, individual investors should not have a problem trading.
Tax Efficiency & Capital Gain Distributions
ETFs are typically more tax-efficient than mutual funds, due to their ability to avoid realizing capital gains through like-kind redemptions (a process that is beyond the scope of this post). However, VTSAX does not make capital gains distributions (nor do I expect it to, due to Vanguard’s fund structure), so VTSAX and ITOT are both about as tax-efficient as possible.
Tax Loss Harvesting
My personal preference is to keep a portfolio entirely mutual funds or entirely ETFs, due to the mechanics of settlement during tax loss harvesting. If an ETF has declined in value and an investor sells it, the trade and cash proceeds will not settle for two business days (T+2). That investor may want to “replace” the sold ETF immediately and attempt to buy another ETF or mutual fund simultaneously.
However, mutual funds settle on T+1 basis, so cash for the mutual purchase would be due in one business day (which is one day earlier than the cash from the ETF sale is received). This can obviously cause problems and (even though this issue can be addressed with careful planning) I find it easier to keep accounts invested in similar vehicles. In this case, if a portfolio is all mutual funds, I might lean more towards VFIAX. If all ETFs, I might lean more towards ITOT.
Tradability
VFIAX does have a stated minimum of $3,000 for purchases, although this may be too small an amount to buy in a non-Vanguard account where there is a transaction fee. The minimum purchase size for ITOT is typically one share, although fractional shares are becoming more common. Investors can trade ETFs intraday, as well as in the pre-market and after-hours trading sessions. Investors can only buy/sell mutual funds once per day. This is not necessarily a major factor for long-term investors however.
Final Thoughts on VFIAX vs ITOT
Both VFIAX and ITOT are large, core funds sponsored and managed by Vanguard and Blackrock, respectively. Although VFIAX is more of a large-cap mutual fund and ITOT is a total market ETF, performance has been extremely similar. ITOT has an edge in tradability and tax-efficiency, but these funds are effectively interchangeable in most other respects.
I would not spend too much energy splitting hairs to decide which one is “better” (unless one has a clear view on whether larger caps or smaller caps will perform better in the future and even then the difference won’t be much)! In my opinion, both funds are among the best out there and investors cannot really go wrong with either.
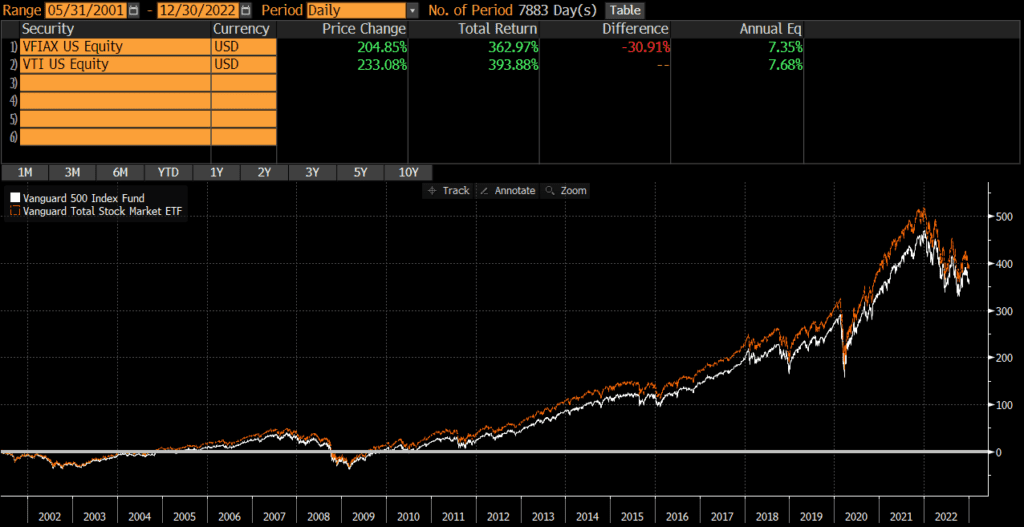
The Vanguard 500 Index Fund (VFIAX) and the Vanguard Total Stock Market ETF (VTI) are two of the largest index mutual funds in existence and easily two of the most popular among individual investors. VFIAX and VTI form the core of many investor portfolios and many investors compare VFIAX vs VTI in order to decide which should be the foundation of their portfolio.
There are two main differences between the funds. VFIAX is a mutual fund that holds large-caps and mid-caps, while VTI is a total market ETF that includes small-caps. However, these are not major differences and investors should look at additional factors when deciding between the two funds.
The Longer Answer
Historical Performance: VFIAX vs VTI
VFIAX was launched in late 2000, while VTI was launched in May 2001. Since their common inception date, the performance difference has only been .33%. This difference has compounded over time and the cumulative performance differential over this time period is approximately 31%.
Much of this performance difference was driven by small-caps’ outperformance early on, which compounded even in the face of large-caps’ dominance over the past decade. Selecting VFIAX vs VTI is (at least partially) a bet on whether large-caps or small-caps will outperform in the future (although even a correct prediction will not make much of a difference since performance is pretty similar).
Portfolio Exposures: VFIAX vs VTI
Geographic Exposure
Both VFIAX and VTI hold essentially 100% stocks, so I will not dig into country exposures or market classification here. For all intents and purposes, the two funds have identical exposures.
Market Cap Exposure
VFIAX tracks the S&P 500 index and so it mostly holds large-caps with a bit of mid-cap exposure. VTI tracks the broader CRSP U.S. Total Stock Market Index and so it owns many more mid-caps and small-caps. In other words, VFIAX is a large-cap vehicle and VTI is a total market vehicle. That being said, due to market cap weighting, both funds are overwhelmingly weighted towards large-caps.
VFIAX
VTI
Large-Cap
85%
73%
Mid-Cap
16%
19%
Small-Cap
0%
8%
Source: ThoughtfulFinance.com, Morningstar (data as of 1/31/2023)
Sector Weights
Despite the differences in market cap exposures, the sector exposures between the two funds is nearly identical as shown below.
VFIAX
VTI
Basic Materials
2.52%
2.72%
Consumer Cyclical
10.38%
10.54%
Financial Services
13.99%
14.04%
Real Estate
2.88%
3.62%
Communication Services
7.83%
7.19%
Energy
5.06%
4.95%
Industrials
8.76%
9.84%
Technology
23.76%
23.11%
Consumer Defensive
7.13%
6.53%
Healthcare
14.75%
14.62%
Utilities
2.94%
2.83%
Source: ThoughtfulFinance.com, Morningstar (data as of 1/31/2023)
Factors to Consider
Expenses
Some investors may point out that the expense ratios between VFIAX and VTI differ. This is true, but at a certain level, differences in expense ratio do not matter that much. In this case, the VFIAX’s expense ratio of .04% is 25% higher than VTI’s .03% expense ratio. However, we’re talking about 1 basis point, so even though VFIAX is 25% more expensive than VTI, it is inconsequential.
Transaction Costs
ETFs are free to trade at many brokers and custodians, including Vanguard. However, many brokers and custodians still charge commissions and/or transaction fees to buy/sell mutual funds. To my knowledge, Vanguard does not participate in the pay-to-play arrangements (with their competitor custodians) that would allow their mutual funds to trade for free on many platforms. So if an investor account is at Vanguard, it is generally free to trade VFIAX or VTI. However, only VTI is free to trade in many non-Vanguard accounts.
There is a bid-ask spread when trading ETFs, but this spread is typically less than .01% for VTI and individual investor trades will not generally be large enough to “move” the market. In the case of VTI, individual investors should not have a problem trading.
Tax Efficiency & Capital Gain Distributions
ETFs are typically more tax-efficient than mutual funds, due to their ability to avoid realizing capital gains through like-kind redemptions (a process that is beyond the scope of this post). However, VTSAX does not make capital gains distributions (nor do I expect it to, due to Vanguard’s fund structure), so VTSAX and VTI are both about as tax-efficient as possible.
Tax Loss Harvesting
My personal preference is to keep a portfolio entirely mutual funds or entirely ETFs, due to the mechanics of settlement during tax loss harvesting. If an ETF has declined in value and an investor sells it, the trade and cash proceeds will not settle for two business days (T+2). That investor may want to “replace” the sold ETF immediately and attempt to buy another ETF or mutual fund simultaneously.
However, mutual funds settle on T+1 basis, so cash for the mutual purchase would be due in one business day (which is one day earlier than the cash from the ETF sale is received). This can obviously cause problems and (even though this issue can be addressed with careful planning) I find it easier to keep accounts invested in similar vehicles. In this case, if a portfolio is all mutual funds, I might lean more towards VFIAX. If all ETFs, I might lean more towards VTI.
Tradability
VFIAX does have a stated minimum of $3,000 for purchases, although this may be too small an amount to buy in a non-Vanguard account where there is a transaction fee. The minimum purchase size for VTI is typically one share, although fractional shares are becoming more common. Investors can trade ETFs intraday, as well as in the pre-market and after-hours trading sessions. Investors can only buy/sell mutual funds once per day. This is not necessarily a major factor for long-term investors however.
Final Thoughts on VFIAX vs VTI
Both VFIAX and VTI are large, core funds sponsored and managed by Vanguard. Although VFIAX is more of a large-cap mutual fund and VTI is a total market ETF, performance has been extremely similar. VTI has an edge in tradability and tax-efficiency, but these funds are effectively interchangeable in most other respects.
I would not spend too much energy splitting hairs to decide which one is “better” (unless one has a clear view on whether larger caps or smaller caps will perform better in the future and even then the difference won’t be much)! In my opinion, both funds are among the best out there and investors cannot really go wrong with either.
The Fidelity 500 Index Fund (FXAIX) and the Blackrock iShares Core S&P Total Stock Market ETF (ITOT) are two of the largest index mutual funds in existence and easily two of the most popular among individual investors. FXAIX and ITOT form the core of many investor portfolios and many investors compare FXAIX vs ITOT in order to decide which should be the foundation of their portfolio.
There are two main differences between the funds. FXAIX is a mutual fund that holds large-caps and mid-caps, while ITOT is a total market ETF that includes small-caps. However, these are not major differences and investors should look at additional factors when deciding between the two funds.
The Longer Answer
Historical Performance: FXAIX vs ITOT
FXAIX was launched in 1988, while ITOT was launched in January 2004. Since their common inception date, the performance difference has only been .11%! This difference has compounded over time and the cumulative performance differential over this time period has been less than 10%. Selecting FXAIX vs ITOT is (at least partially) a bet on whether large-caps or small-caps will outperform in the future (although even a correct prediction will not make much of a difference since performance is pretty similar).
Portfolio Exposures: FXAIX vs ITOT
Geographic Exposure
Both FXAIX and ITOT hold essentially 100% stocks, so I will not dig into country exposures or market classification here. For all intents and purposes, the two funds have identical exposures.
Market Cap Exposure
FXAIX tracks the S&P 500 index and so it mostly holds large-caps with a bit of mid-cap exposure. ITOT tracks the broader S&P Total Market Index and so it owns many more mid-caps and small-caps. In other words, FXAIX is a large-cap vehicle and ITOT is a total market vehicle. That being said, due to market cap weighting, both funds are overwhelmingly weighted towards large-caps.
FXAIX
ITOT
Large-Cap
83%
72%
Mid-Cap
16%
19%
Small-Cap
0%
8%
Source: ThoughtfulFinance.com, Morningstar (SWPPX data as of 12/31/2022, ITOT data as of 1/31/2023)
Sector Weights
Despite the differences in market cap exposures, the sector exposures between the two funds is nearly identical as shown below.
FXAIX
ITOT
Basic Materials
2.46%
2.72%
Consumer Cyclical
9.56%
10.72%
Financial Services
13.89%
14.04%
Real Estate
2.81%
3.59%
Communication Services
7.28%
7.22%
Energy
5.23%
4.85%
Industrials
9.06%
9.61%
Technology
23.02%
23.60%
Consumer Defensive
7.61%
6.48%
Healthcare
15.90%
14.40%
Utilities
3.18%
2.76%
Source: ThoughtfulFinance.com, Morningstar (SWPPX data as of 12/31/2022, ITOT data as of 1/31/2023)
Factors to Consider
Expenses
Some investors may point out that the expense ratios between FXAIX and ITOT differ. This is true, but at a certain level, differences in expense ratio do not matter that much. In this case, the ITOT’s expense ratio of .03% is 100% higher than FXAIX’s .015% expense ratio. However, we’re talking about 1.5 basis points, so even though ITOT is 100% more expensive than FXAIX, it is inconsequential.
Transaction Costs
ETFs are free to trade at many brokers and custodians, including Fidelity. However, many brokers and custodians still charge commissions and/or transaction fees to buy/sell mutual funds. To my knowledge, Fidelity does not participate in the pay-to-play arrangements (with their competitor custodians) that would allow their mutual funds to trade for free on many platforms. So if an investor account is at Fidelity, it is generally free to trade FXAIX or ITOT. However, only ITOT is free to trade in many non-Fidelity accounts.
There is a bid-ask spread when trading ETFs, but this spread is typically less than .01% for ITOT and individual investor trades will not generally be large enough to “move” the market. In the case of ITOT, individual investors should not have a problem trading.
Tax Efficiency & Capital Gain Distributions
ETFs are typically more tax-efficient than mutual funds, due to their ability to avoid realizing capital gains through like-kind redemptions (a process that is beyond the scope of this post). FXAIX is an index fund and relatively tax-efficient. However, it has made capital gains distributions in the past and I would expect this to continue in future. ITOT has never paid out a capital gain distribution, nor do I expect it to in the future. Thus, ITOT is more tax-efficient.
Tax Loss Harvesting
My personal preference is to keep a portfolio entirely mutual funds or entirely ETFs, due to the mechanics of settlement during tax loss harvesting. If an ETF has declined in value and an investor sells it, the trade and cash proceeds will not settle for two business days (T+2). That investor may want to “replace” the sold ETF immediately and attempt to buy another ETF or mutual fund simultaneously. However, mutual funds settle on T+1 basis, so cash for the mutual purchase would be due in one business day (which is one day earlier than the cash from the ETF sale is received). This can obviously cause problems and (even though this issue can be addressed with careful planning) I find it easier to keep accounts invested in similar vehicles. In this case, if a portfolio is all mutual funds, I might lean more towards FXAIX. If all ETFs, I might lean more towards ITOT.
Tradability
FXAIX does not have a stated minimum for purchases, although some brokerages (especially competitors of Fidelity) impose minimums. The minimum purchase size for ITOT is typically one share, although fractional shares are becoming more common. Investors can trade ETFs intraday, as well as in the pre-market and after-hours trading sessions. Investors can only buy/sell mutual funds once per day. This is not necessarily a major factor for long-term investors however.
Final Thoughts on FXAIX vs ITOT
Both FXAIX and ITOT are large, core funds sponsored and managed by respectable asset managers (Fidelity and Blackrock iShares, respectively). Although FXAIX is more of a large-cap mutual fund and ITOT is a total market ETF, performance has been extremely similar. ITOT has an edge in tradability and tax-efficiency, but these funds are effectively interchangeable in most other respects.
I would not spend too much energy splitting hairs to decide which one is “better” (unless one has a clear view on whether larger caps or smaller caps will perform better in the future and even then the difference won’t be much)! In my opinion, both funds are among the best out there and investors cannot really go wrong with either.
The Fidelity 500 Index Fund (FXAIX) and the Vanguard Total Stock Market ETF (VTI) are two of the largest index mutual funds in existence and easily two of the most popular among individual investors. FXAIX and VTI form the core of many investor portfolios and many investors compare FXAIX vs VTI in order to decide which should be the foundation of their portfolio.
There are two main differences between the funds. FXAIX is a mutual fund that holds large-caps and mid-caps, while VTI is a total market ETF that includes small-caps. However, these are not major differences and investors should look at additional factors when deciding between the two funds.
The Longer Answer
Historical Performance: FXAIX vs VTI
FXAIX was launched in 1988, while VTI was launched in May 2001. Since their common inception date, the performance difference has only been .35%. This difference has compounded over time and the cumulative performance differential over this time period is approximately 33%.
Much of this performance difference was driven by large-caps’ outperformance over the past decade. Selecting FXAIX vs VTI is (at least partially) a bet on whether large-caps or small-caps will outperform in the future (although even a correct prediction will not make much of a difference since performance is pretty similar).
Portfolio Exposures: FXAIX vs VTI
Geographic Exposure
Both FXAIX and VTI hold essentially 100% stocks, so I will not dig into country exposures or market classification here. For all intents and purposes, the two funds have identical exposures.
Market Cap Exposure
FXAIX tracks the S&P 500 index and so it mostly holds large-caps with a bit of mid-cap exposure. VTI tracks the broader CRSP U.S. Total Stock Market Index and so it owns many more mid-caps and small-caps. In other words, FXAIX is a large-cap vehicle and VTI is a total market vehicle. That being said, due to market cap weighting, both funds are overwhelmingly weighted towards large-caps.
FXAIX
VTI
Large-Cap
83%
73%
Mid-Cap
16%
19%
Small-Cap
0%
8%
Source: ThoughtfulFinance.com, Morningstar (data as of 12/31/2022)
Sector Weights
Despite the differences in market cap exposures, the sector exposures between the two funds is nearly identical as shown below.
FXAIX
VTI
Basic Materials
2.46%
2.65%
Consumer Cyclical
9.56%
9.77%
Financial Services
13.89%
13.93%
Real Estate
2.81%
3.51%
Communication Services
7.28%
6.71%
Energy
5.23%
5.15%
Industrials
9.06%
10.07%
Technology
23.02%
22.48%
Consumer Defensive
7.61%
6.98%
Healthcare
15.90%
15.69%
Utilities
3.18%
3.07%
Source: ThoughtfulFinance.com, Morningstar (data as of 12/31/2022)
Factors to Consider
Expenses
Some investors may point out that the expense ratios between FXAIX and VTI differ. This is true, but at a certain level, differences in expense ratio do not matter that much. In this case, the VTI’s expense ratio of .03% is 100% higher than FXAIX’s .015% expense ratio. However, we’re talking about 1 basis point, so even though VTI is 100% more expensive than FXAIX, it is inconsequential.
Transaction Costs
ETFs are free to trade at many brokers and custodians, including Fidelity. However, many brokers and custodians still charge commissions and/or transaction fees to buy/sell mutual funds. To my knowledge, Fidelity does not participate in the pay-to-play arrangements (with their competitor custodians) that would allow their mutual funds to trade for free on many platforms. So if an investor account is at Fidelity, it is generally free to trade FXAIX or VTI. However, only VTI is free to trade in many non-Fidelity accounts.
There is a bid-ask spread when trading ETFs, but this spread is typically less than .01% for VTI and individual investor trades will not generally be large enough to “move” the market. In the case of VTI, individual investors should not have a problem trading.
Tax Efficiency & Capital Gain Distributions
ETFs are typically more tax-efficient than mutual funds, due to their ability to avoid realizing capital gains through like-kind redemptions (a process that is beyond the scope of this post). FXAIX is an index fund and relatively tax-efficient. However, it has made capital gains distributions in the past and I would expect this to continue in future. VTI has never paid out a capital gain distribution, nor do I expect it to in the future. Thus, VTI is more tax-efficient.
Tax Loss Harvesting
My personal preference is to keep a portfolio entirely mutual funds or entirely ETFs, due to the mechanics of settlement during tax loss harvesting. If an ETF has declined in value and an investor sells it, the trade and cash proceeds will not settle for two business days (T+2). That investor may want to “replace” the sold ETF immediately and attempt to buy another ETF or mutual fund simultaneously. However, mutual funds settle on T+1 basis, so cash for the mutual purchase would be due in one business day (which is one day earlier than the cash from the ETF sale is received). This can obviously cause problems and (even though this issue can be addressed with careful planning) I find it easier to keep accounts invested in similar vehicles. In this case, if a portfolio is all mutual funds, I might lean more towards FXAIX. If all ETFs, I might lean more towards VTI.
Tradability
FXAIX does not have a stated minimum for purchases, although some brokerages (especially competitors of Fidelity) impose minimums. The minimum purchase size for VTI is typically one share, although fractional shares are becoming more common. Investors can trade ETFs intraday, as well as in the pre-market and after-hours trading sessions. Investors can only buy/sell mutual funds once per day. This is not necessarily a major factor for long-term investors however.
Final Thoughts on FXAIX vs VTI
Both FXAIX and VTI are large, core funds sponsored and managed by respectable asset managers (Fidelity and Vanguard, respectively). Although FXAIX is more of a large-cap mutual fund and VTI is a total market ETF, performance has been extremely similar. VTI has an edge in tradability and tax-efficiency, but these funds are effectively interchangeable in most other respects.
I would not spend too much energy splitting hairs to decide which one is “better” (unless one has a clear view on whether larger caps or smaller caps will perform better in the future and even then the difference won’t be much)! In my opinion, both funds are among the best out there and investors cannot really go wrong with either.
The Schwab S&P 500 Index Fund (SWPPX) and the Vanguard Total Stock Market ETF (VTI) are two of the largest index mutual funds in existence and easily two of the most popular among individual investors. SWPPX and VTI form the core of many investor portfolios and many investors compare SWPPX vs VTI in order to decide which should be the foundation of their portfolio.
There are two main differences between the funds. SWPPX is a mutual fund that holds large-caps and mid-caps, while VTI is a total market ETF that includes small-caps. However, these are not major differences and investors should look at additional factors when deciding between the two funds.
The Longer Answer
Historical Performance: SWPPX vs VTI
SWPPX was launched in 1997, while VTI was launched in May 2001. Since their common inception date, the performance difference has only been .36%. This difference has compounded over time and the cumulative performance differential over this time period is approximately 34%.
Much of this performance difference was driven by small-caps’ outperformance in the early years, which has compounded (even in the face of large-cao outperformance is recent years). Thus, selecting SWPPX vs VTI is (at least partially) a bet on whether large-caps or small-caps will outperform in the future (although even a correct prediction will not make much of a difference since performance is pretty similar).
Portfolio Exposures: SWPPX vs VTI
Geographic Exposure
Both SWPPX and VTI hold essentially 100% stocks, so I will not dig into country exposures or market classification here. For all intents and purposes, the two funds have identical exposures.
Market Cap Exposure
SWPPX tracks the S&P 500 index and so it mostly holds large-caps with a bit of mid-cap exposure. VTI tracks the broader CRSP U.S. Total Stock Market Index and so it owns many more mid-caps and small-caps. In other words, SWPPX is a large-cap vehicle and VTI is a total market vehicle. That being said, due to market cap weighting, both funds are overwhelmingly weighted towards large-caps.
SWPPX
VTI
Large-Cap
83%
73%
Mid-Cap
16%
19%
Small-Cap
0%
8%
Source: ThoughtfulFinance.com, Morningstar (data as of 12/31/2022)
Sector Weights
Despite the differences in market cap exposures, the sector exposures between the two funds is nearly identical as shown below.
SWPPX
VTI
Basic Materials
2.46%
2.65%
Consumer Cyclical
9.56%
9.77%
Financial Services
13.89%
13.93%
Real Estate
2.81%
3.51%
Communication Services
7.28%
6.71%
Energy
5.23%
5.15%
Industrials
9.06%
10.07%
Technology
23.02%
22.48%
Consumer Defensive
7.61%
6.98%
Healthcare
15.90%
15.69%
Utilities
3.18%
3.07%
Source: ThoughtfulFinance.com, Morningstar (data as of 12/31/2022)
Factors to Consider
Expenses
Some investors may point out that the expense ratios between SWPPX and VTI differ. This is true, but at a certain level, differences in expense ratio do not matter that much. In this case, the VTI’s expense ratio of .03% is 50% higher than SWPPX’s .02% expense ratio. However, we’re talk about 1 basis points, so even though VTI is 50% more expensive than SWPPX, it is inconsequential.
Transaction Costs
ETFs are free to trade at many brokers and custodians, including Schwab. However, many brokers and custodians still charge commissions and/or transaction fees to buy/sell mutual funds. To my knowledge, Schwab does not participate in the pay-to-play arrangements (with their competitor custodians) that would allow their mutual funds to trade for free on many platforms. So if an investor account is at Schwab, it is generally free to trade SWPPX or VTI. However, only VTI is free to trade in many non-Schwab accounts.
There is a bid-ask spread when trading ETFs, but this spread is typically less than .01% for VTI and individual investor trades will not generally be large enough to “move” the market. In the case of VTI, individual investors should not have a problem trading.
Tax Efficiency & Capital Gain Distributions
ETFs are typically more tax-efficient than mutual funds, due to their ability to avoid realizing capital gains through like-kind redemptions (a process that is beyond the scope of this post). SWPPX is an index fund and relatively tax-efficient. However, it has made capital gains distributions in the past and I would expect this to continue in future. VTI has never paid out a capital gain distribution, nor do I expect it to in the future. Thus, VTI is more tax-efficient.
Tax Loss Harvesting
My personal preference is to keep a portfolio entirely mutual funds or entirely ETFs, due to the mechanics of settlement during tax loss harvesting. If an ETF has declined in value and an investor sells it, the trade and cash proceeds will not settle for two business days (T+2). That investor may want to “replace” the sold ETF immediately and attempt to buy another ETF or mutual fund simultaneously. However, mutual funds settle on T+1 basis, so cash for the mutual purchase would be due in one business day (which is one day earlier than the cash from the ETF sale is received). This can obviously cause problems and (even though this issue can be addressed with careful planning) I find it easier to keep accounts invested in similar vehicles. In this case, if a portfolio is all mutual funds, I might lean more towards SWPPX. If all ETFs, I might lean more towards VTI.
Tradability
SWPPX does not have a stated minimum for purchases, although some brokerages (especially competitors of Schwab) impose minimums. The minimum purchase size for VTI is typically one share, although fractional shares are becoming more common. Investors can trade ETFs intraday, as well as in the pre-market and after-hours trading sessions. Investors can only buy/sell mutual funds once per day. This is not necessarily a major factor for long-term investors however.
Final Thoughts on SWPPX vs VTI
Both SWPPX and VTI are large, core funds sponsored and managed by respectable asset managers (Schwab and Vanguard, respectively). Although SWPPX is more of a large-cap mutual fund and VTI is a total market ETF, performance has been extremely similar. VTI has an edge in tradability and tax-efficiency, but these funds are effectively interchangeable in most other respects.
I would not spend too much energy splitting hairs to decide which one is “better” (unless one has a clear view on whether larger caps or smaller caps will perform better in the future and even then the difference won’t be much)! In my opinion, both funds are among the best out there and investors cannot really go wrong with either.