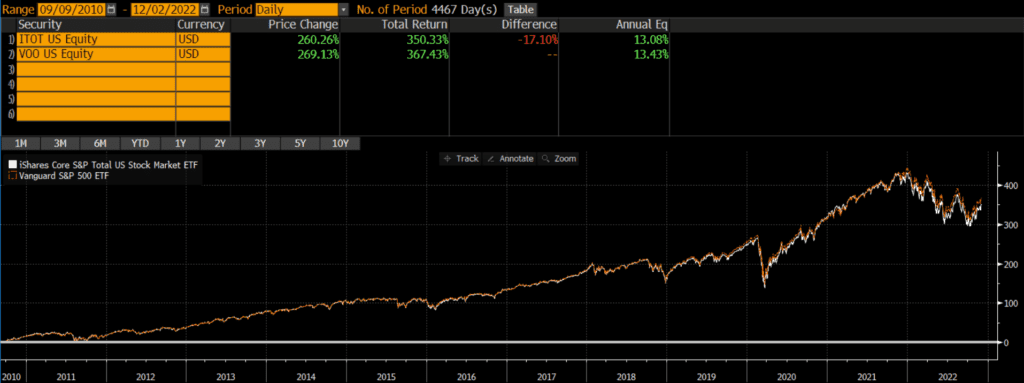
The Vanguard S&P 500 Index ETF (VOO) and the iShares Core S&P Total U.S. Stock Market ETF (ITOT) are two of the largest funds in existence. VOO and ITOT are a core holding of many investor portfolios. Many investors compare ITOT vs VOO in order to decide which should be the foundation of their portfolio.
The Short Answer
The main difference between VOO and ITOT is that VOO is a large- and mid-cap ETF, while ITOT is a total market mutual fund. Despite these differences, the total return between these two funds is nearly identical and I consider them interchangeable.
A quick reminder that this site does NOT provide investment recommendations.
The Long Answer
Historical Performance: ITOT vs VOO
ITOT was launched on January 20, 2004, while VOO was launched on September 7, 2010. Since then, VOO has outperformed by .35% annually. This is most likely driven by large-caps’ relative outperformance during this time period, although that dynamic could reverse in the future. That being said, the performance between these two funds is extremely close (especially considering the market cap differences).

Differences between ITOT vs VOO
The biggest difference between VOO and ITOT is the market cap exposure of the funds. VOO tracks the S&P 500 index which includes mostly large-caps and some mid-caps, while ITOT covers much more of the market by including more mid-caps and small-caps.
Geographic Exposure
Both VOO and ITOT hold essentially 100% stocks, so I will not dig into country exposures or market classification here. For all intents and purposes, the two funds have identical exposures.
Market Cap Exposure
VOO focuses on the S&P 500 index and so it mostly holds large-caps with a bit of mid-cap exposure. ITOT tracks the broader S&P Total Market Index and so it owns many more mid-caps and small-caps, as of 11/30/2022. In other words, VOO is a large-cap vehicle, while ITOT is a total market vehicle. That being said, due to market cap weighting, both funds are overwhelmingly influenced by the large-cap holdings.
| VOO | ITOT | |
| Large-Cap | 84% | 73% |
| Mid-Cap | 17% | 19% |
| Small-Cap | 0% | 9% |
Sector Weights
The sector weights between VOO and ITOT are nearly identical, as of 11/30/2022. The weights are within 1% for every single sector.
| VOO | ITOT | |
| Basic Materials | 2.27% | 2.66% |
| Consumer Cyclical | 10.59% | 10.45% |
| Financial Services | 13.61% | 13.96% |
| Real Estate | 2.74% | 3.45% |
| Communication Services | 7.36% | 6.94% |
| Energy | 5.37% | 5.10% |
| Industrials | 8.69% | 9.59% |
| Technology | 23.60% | 23.24% |
| Consumer Defensive | 7.38% | 6.73% |
| Healthcare | 15.42% | 15.01% |
| Utilities | 2.97% | 2.86% |
Final Thoughts: ITOT vs VOO
Both VOO and ITOT are large, core funds sponsored and managed by the two largest ETF sponsors (Vanguard and Blackrock, respectively). Although VOO is more of a large-cap ETF and ITOT is a total market ETF, performance has been nearly identical. I view these two funds as essentially interchangeable and would not spend too much energy splitting hairs to decide which one is “better.”